 13
13peptides
spectra
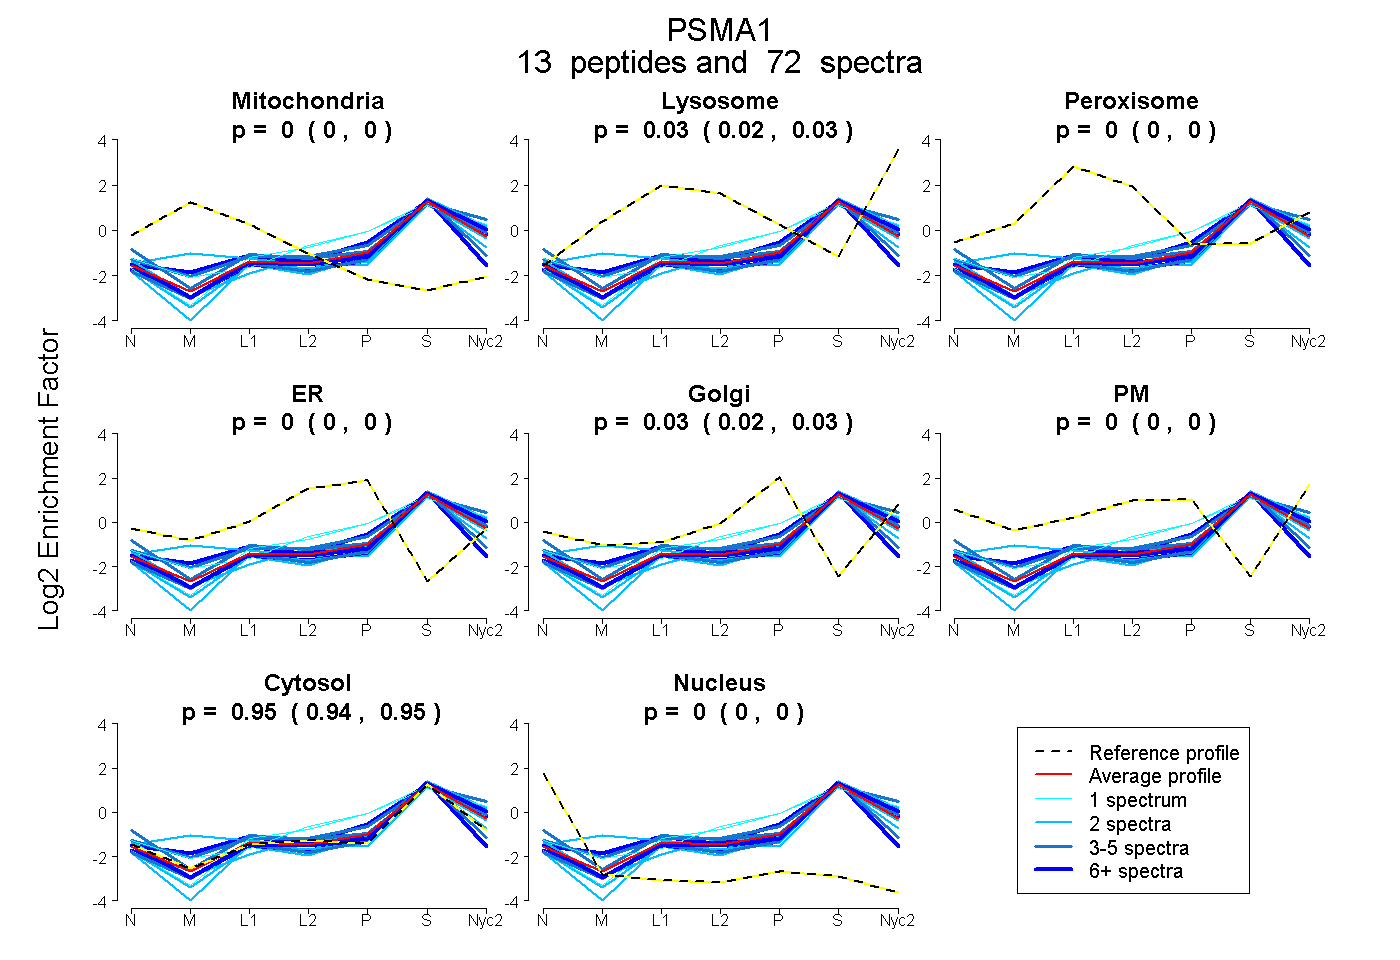
0.000 | 0.000
0.020 | 0.030
0.000 | 0.000
0.000 | 0.000
0.023 | 0.032
0.000 | 0.000
0.943 | 0.950
0.000 | 0.000
8peptides
spectra
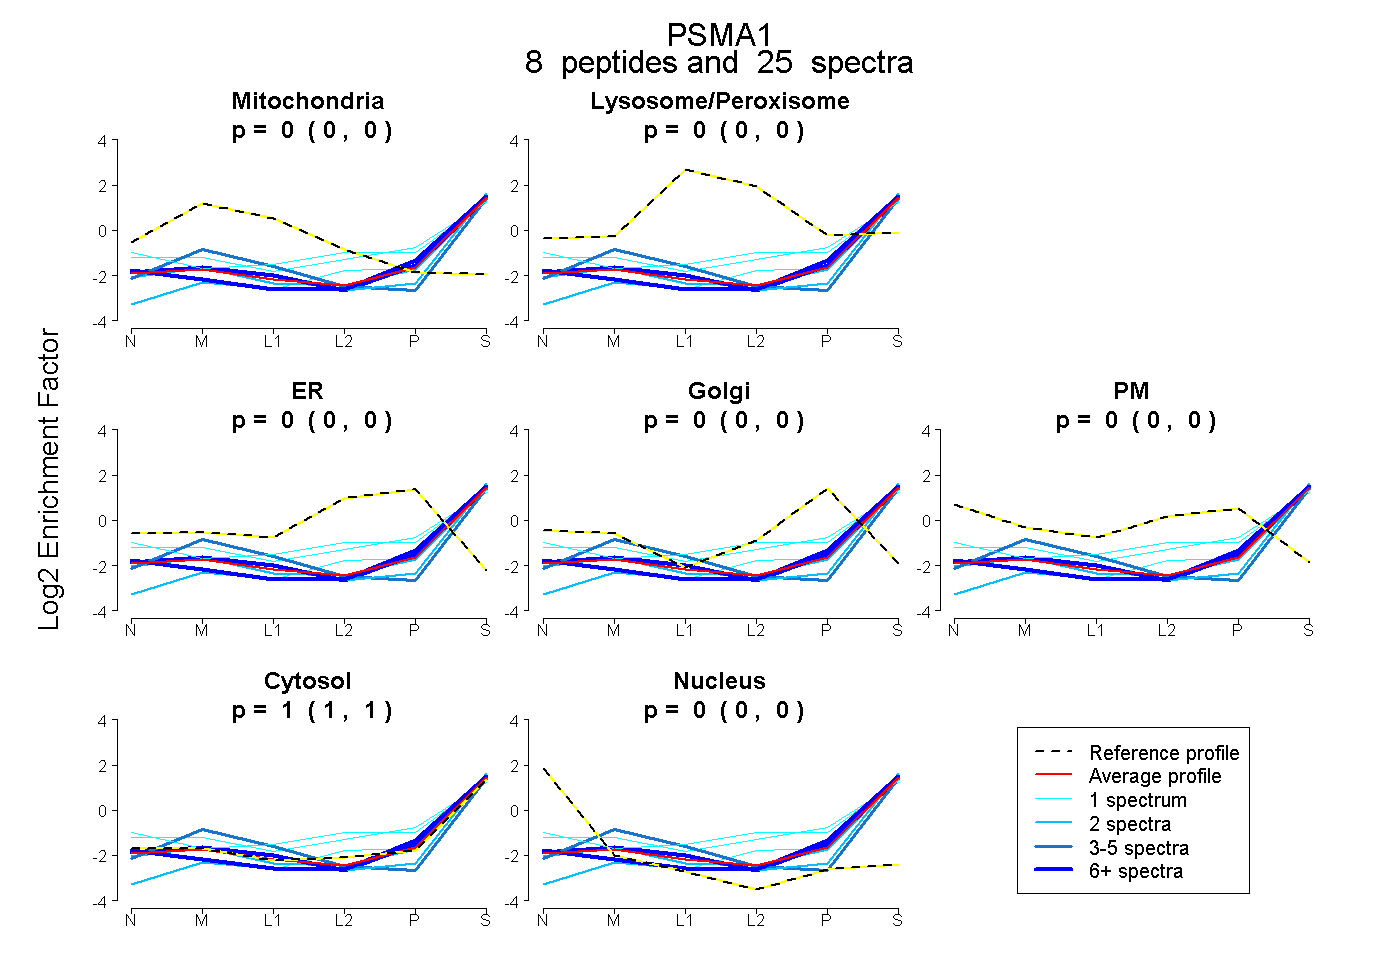
0.000 | 0.000
0.000 | 0.000
0.000 | 0.000
0.000 | 0.000
0.000 | 0.000
1.000 | 1.000
0.000 | 0.000
13peptides
spectra
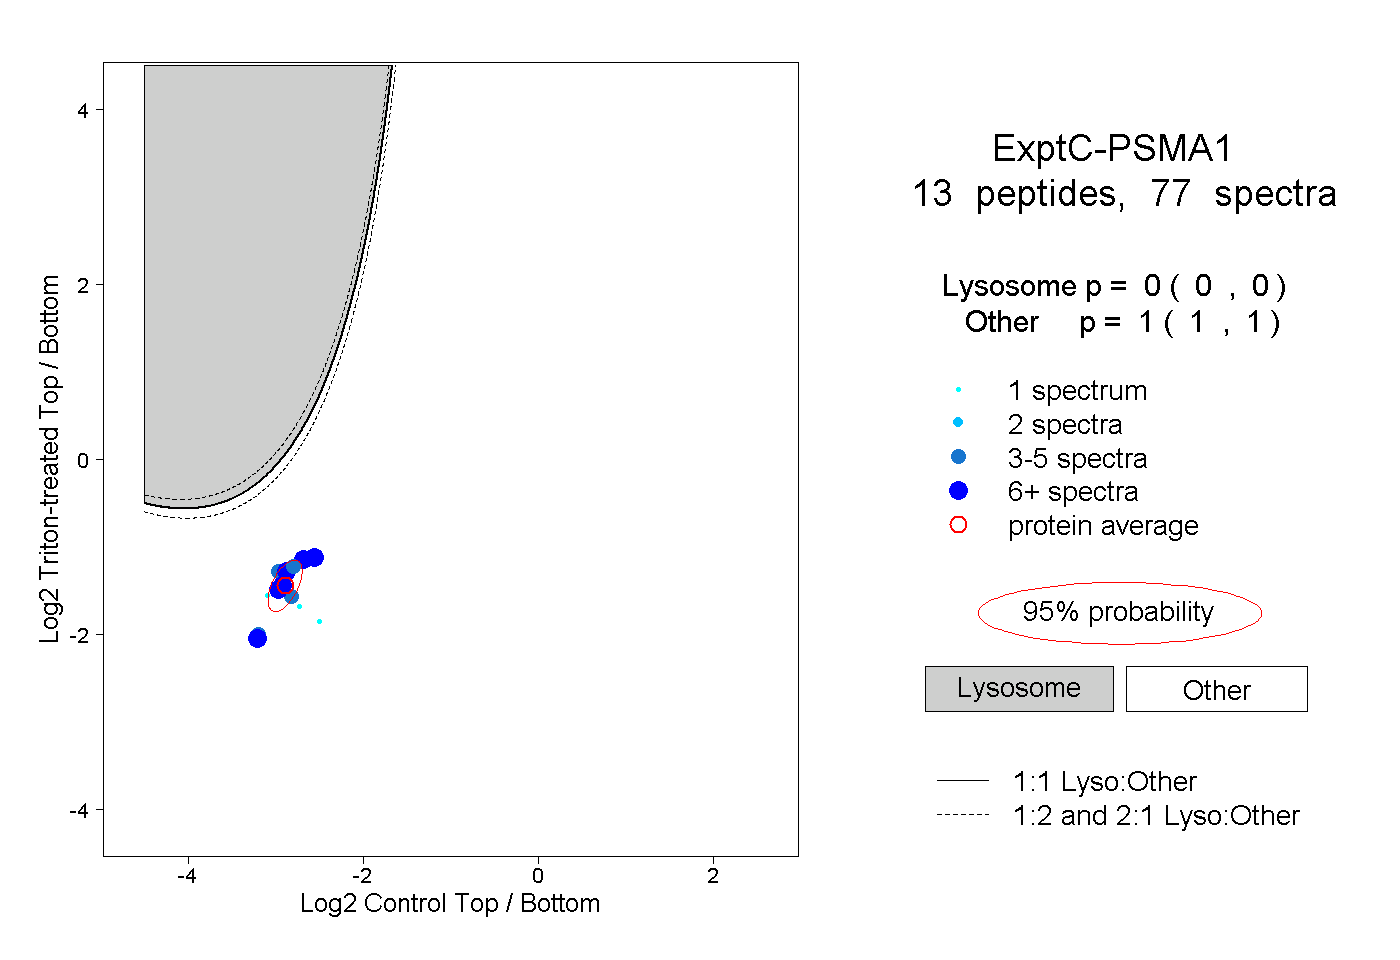
0.000 | 0.000
1.000 | 1.000
3peptides
spectra
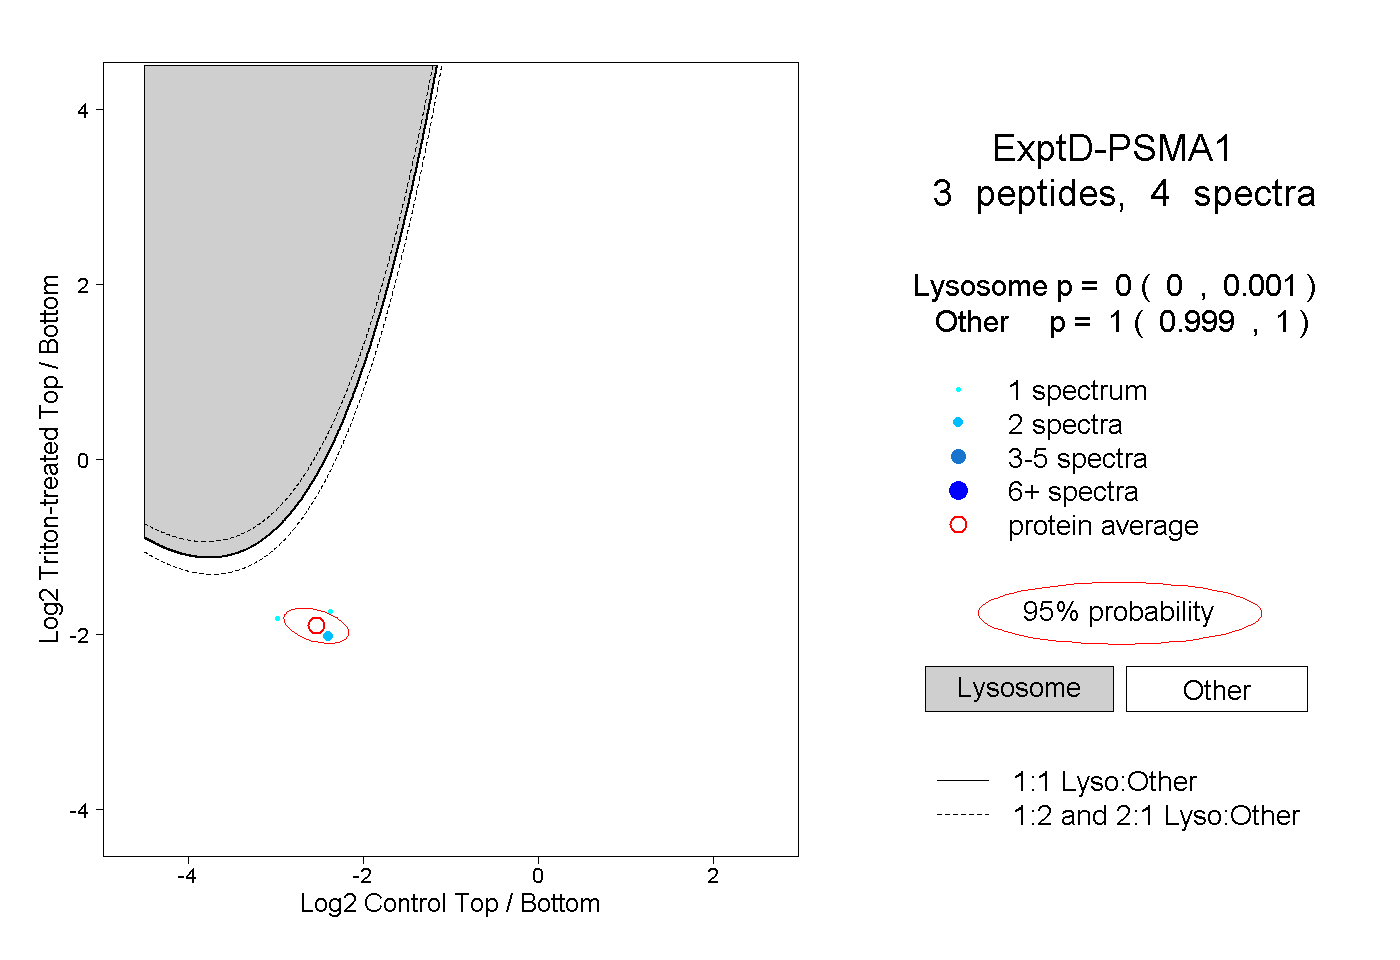
0.000 | 0.001
0.999 | 1.000