PSMA1
[ENSRNOP00000015946]
Main page
| | | Plot |
Mito |
Lyso |
|
Perox |
ER |
Golgi |
PM |
Cytosol |
Nucleus |
|
| Expt A |
 13
13
peptides |
72
spectra |
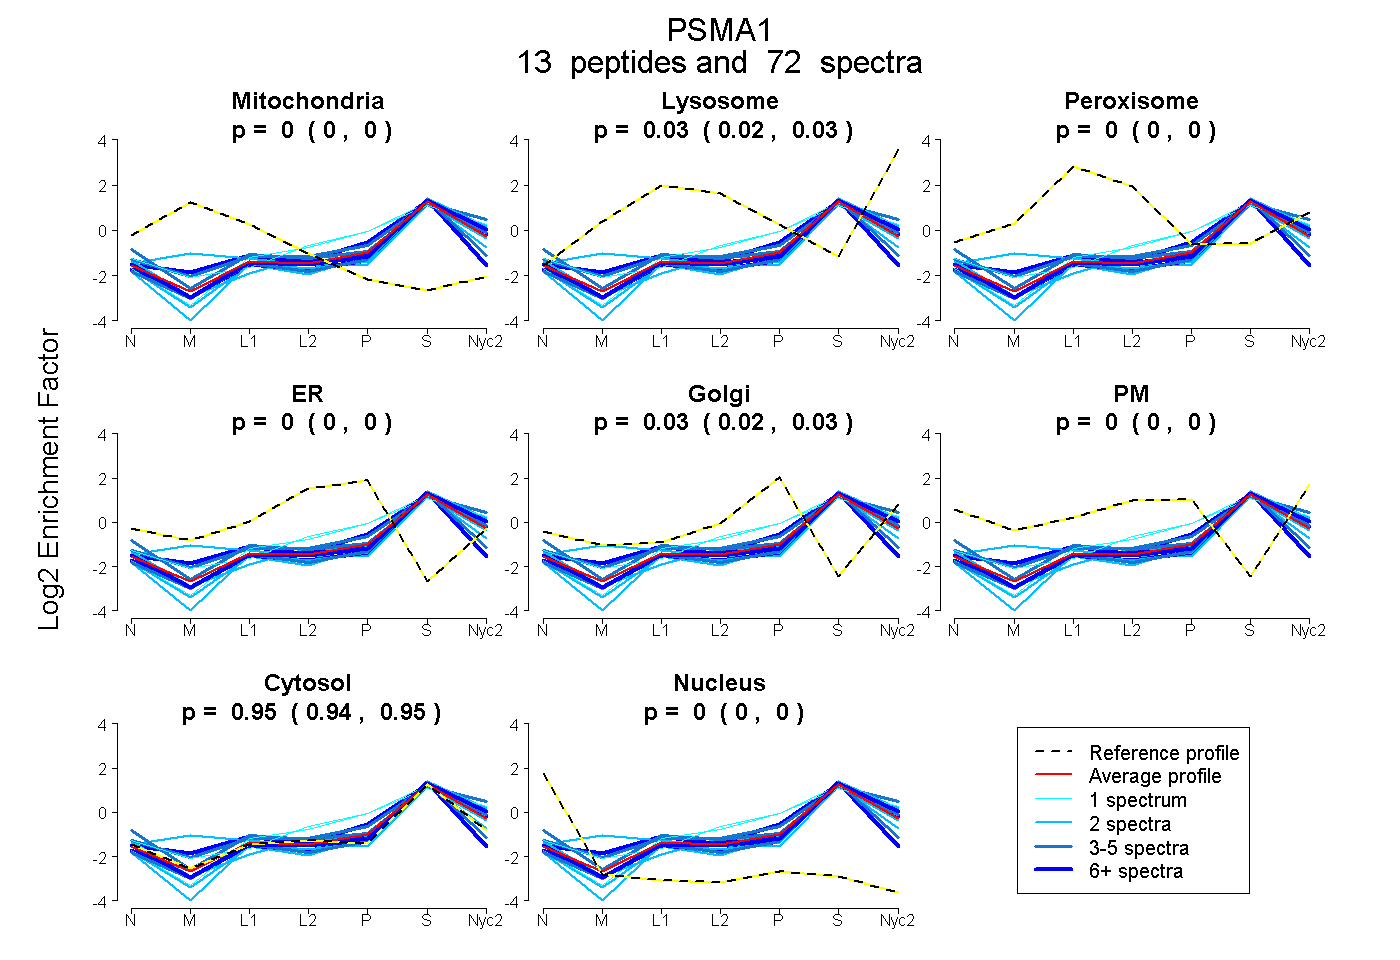 |
0.000
0.000 | 0.000 |
0.025
0.020 | 0.030 |
|
0.000
0.000 | 0.000 |
0.000
0.000 | 0.000 |
0.028
0.023 | 0.032 |
0.000
0.000 | 0.000 |
0.947
0.943 | 0.950 |
0.000
0.000 | 0.000 |
|
| | | Plot |
Mito |
|
Lyso or Perox |
|
ER |
Golgi |
PM |
Cytosol |
Nucleus |
|
| Expt B |
8
peptides |
25
spectra |
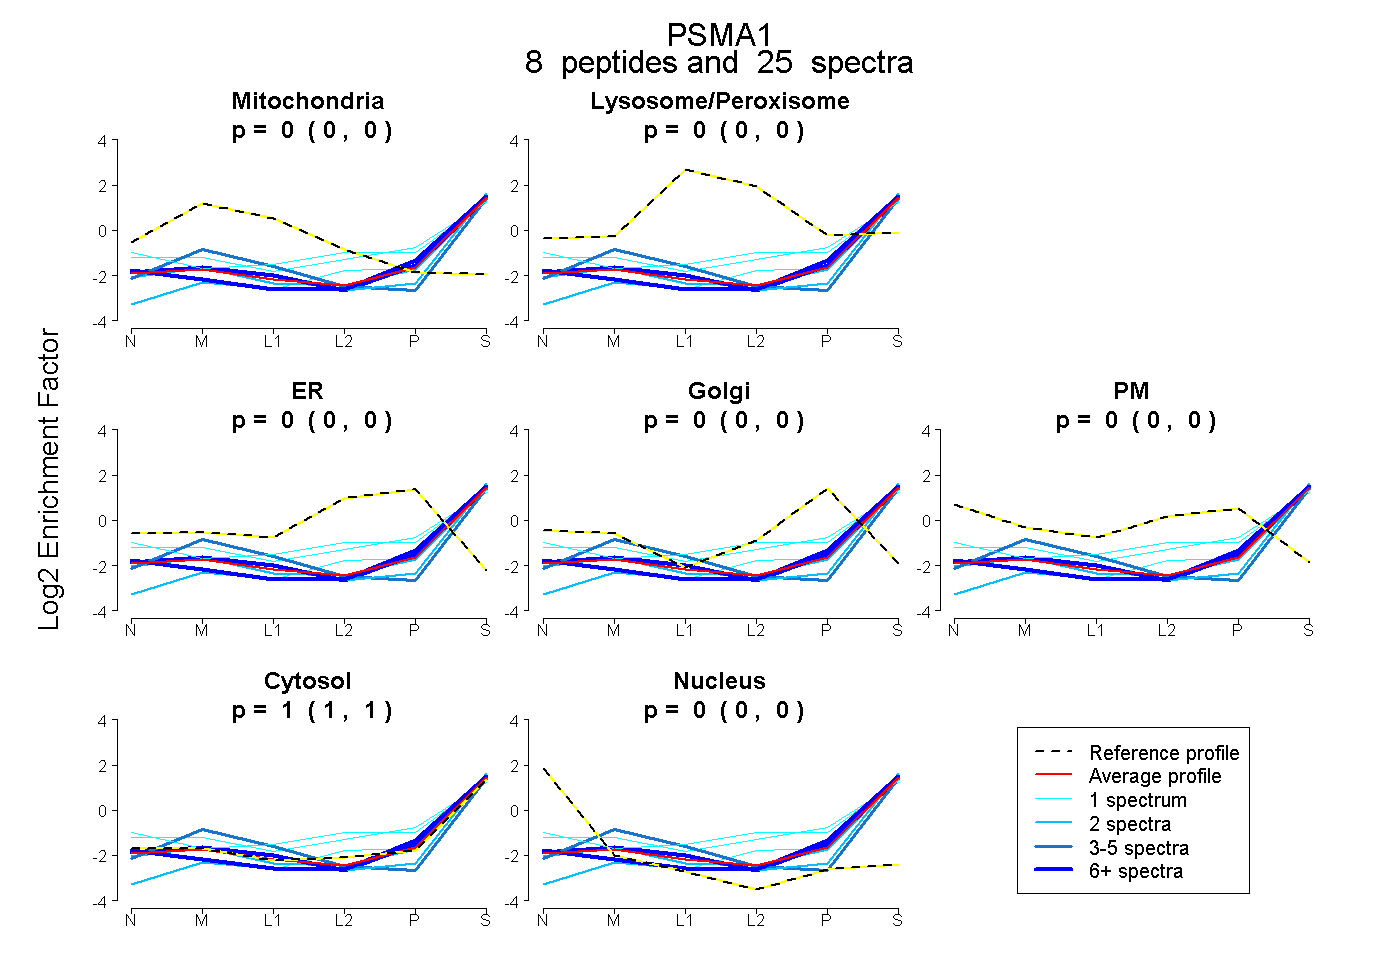 |
0.000
0.000 | 0.000 |
|
0.000
0.000 | 0.000 |
|
0.000
0.000 | 0.000 |
0.000
0.000 | 0.000 |
0.000
0.000 | 0.000 |
1.000
1.000 | 1.000 |
0.000
0.000 | 0.000 |
|
| 1 spectrum, QGSATVGLK |
0.000 |
|
0.159 |
|
0.006 |
0.000 |
0.077 |
0.758 |
0.000 |
|
| 1 spectrum, ADEPMEH |
0.000 |
|
0.000 |
|
0.000 |
0.000 |
0.000 |
1.000 |
0.000 |
|
| 9 spectra, FVFDRPLPVSR |
0.000 |
|
0.000 |
|
0.000 |
0.000 |
0.000 |
1.000 |
0.000 |
|
| 1 spectrum, AQSELAAHQK |
0.000 |
|
0.114 |
|
0.000 |
0.146 |
0.000 |
0.740 |
0.000 |
|
| 2 spectra, THAVLVALK |
0.000 |
|
0.000 |
|
0.000 |
0.000 |
0.000 |
1.000 |
0.000 |
|
| 3 spectra, LLCNFMR |
0.104 |
|
0.000 |
|
0.000 |
0.000 |
0.000 |
0.896 |
0.000 |
|
| 6 spectra, TQIPTQR |
0.000 |
|
0.000 |
|
0.000 |
0.000 |
0.000 |
1.000 |
0.000 |
|
| 2 spectra, AMSIGAR |
0.000 |
|
0.000 |
|
0.000 |
0.000 |
0.000 |
1.000 |
0.000 |
|
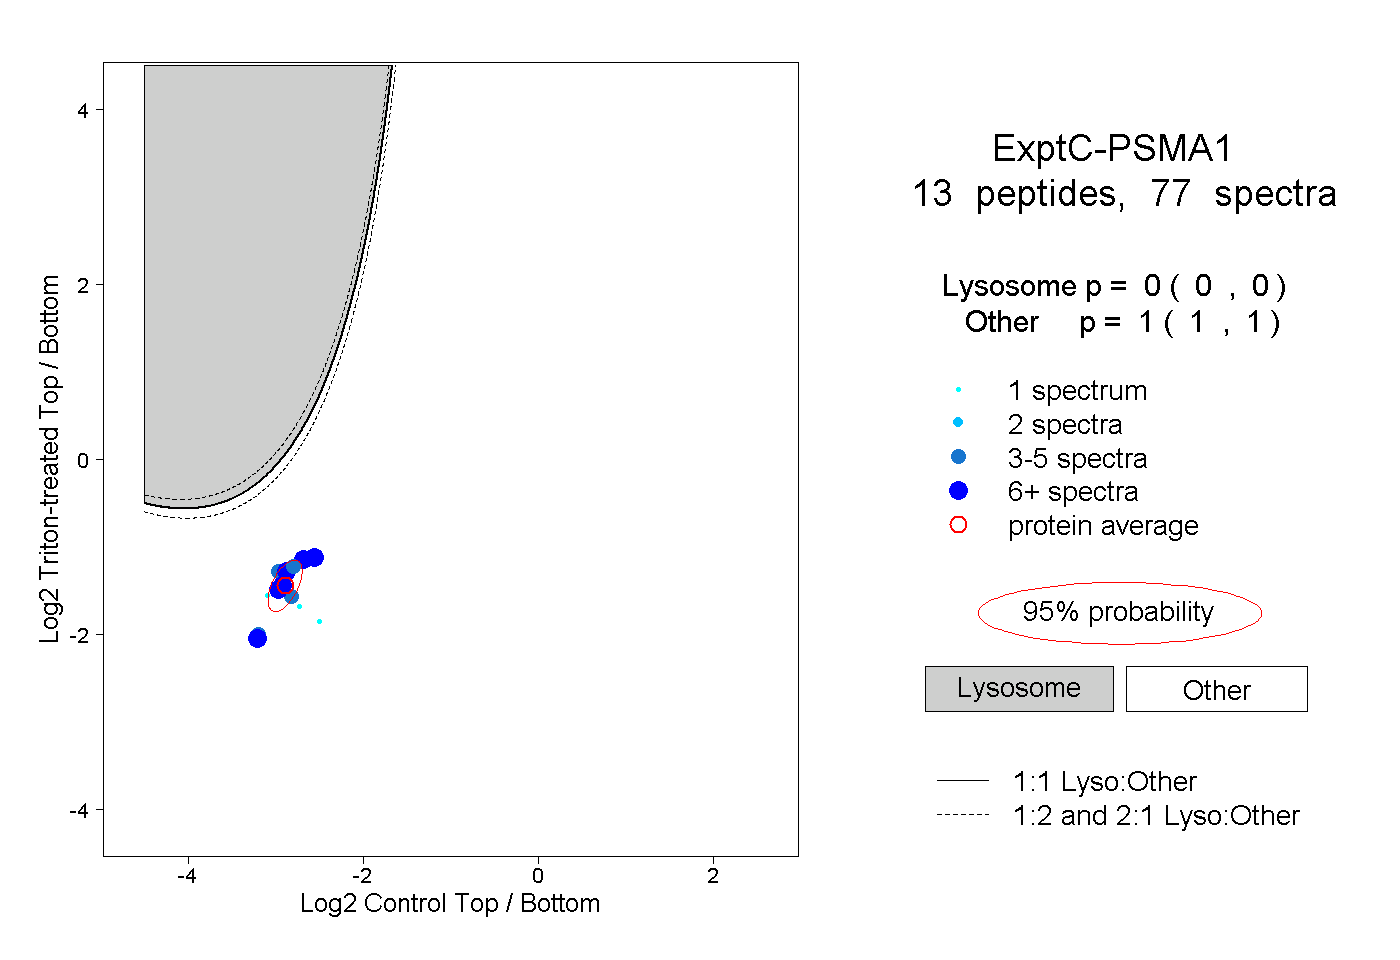
| | | Plot |
|
Lyso |
|
|
|
|
|
|
|
Other |
| Expt C |
13
peptides |
77
spectra |
 |
|
0.000
0.000 | 0.000 |
|
|
|
|
|
|
|
1.000
1.000 | 1.000 |
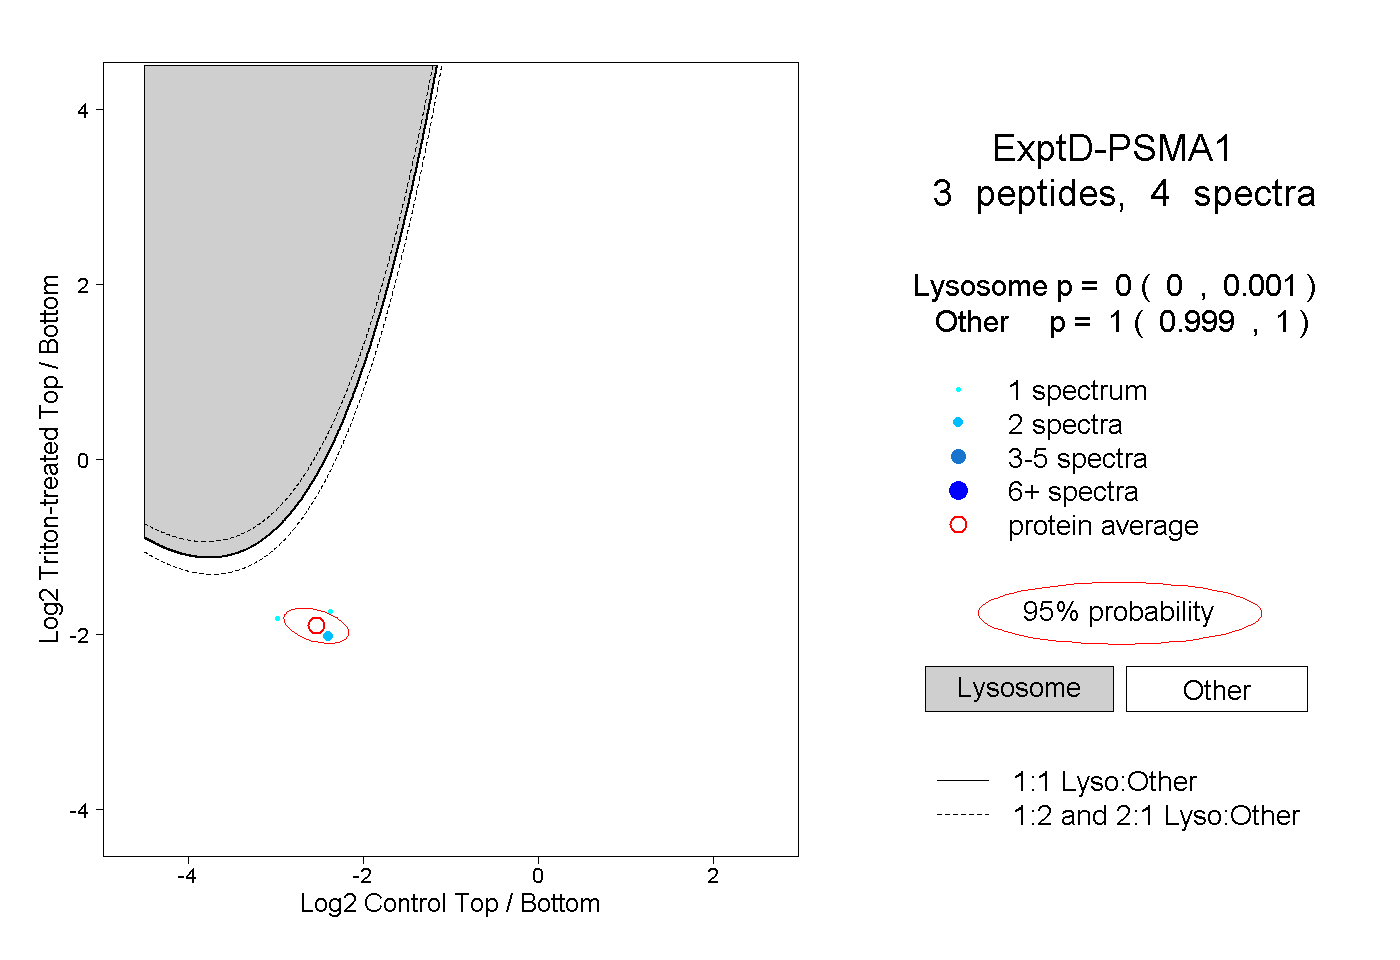
| | | Plot |
|
Lyso |
|
|
|
|
|
|
|
Other |
| Expt D |
3
peptides |
4
spectra |
 |
|
0.000
0.000 | 0.001 |
|
|
|
|
|
|
|
1.000
0.999 | 1.000 |