 11
11peptides
spectra
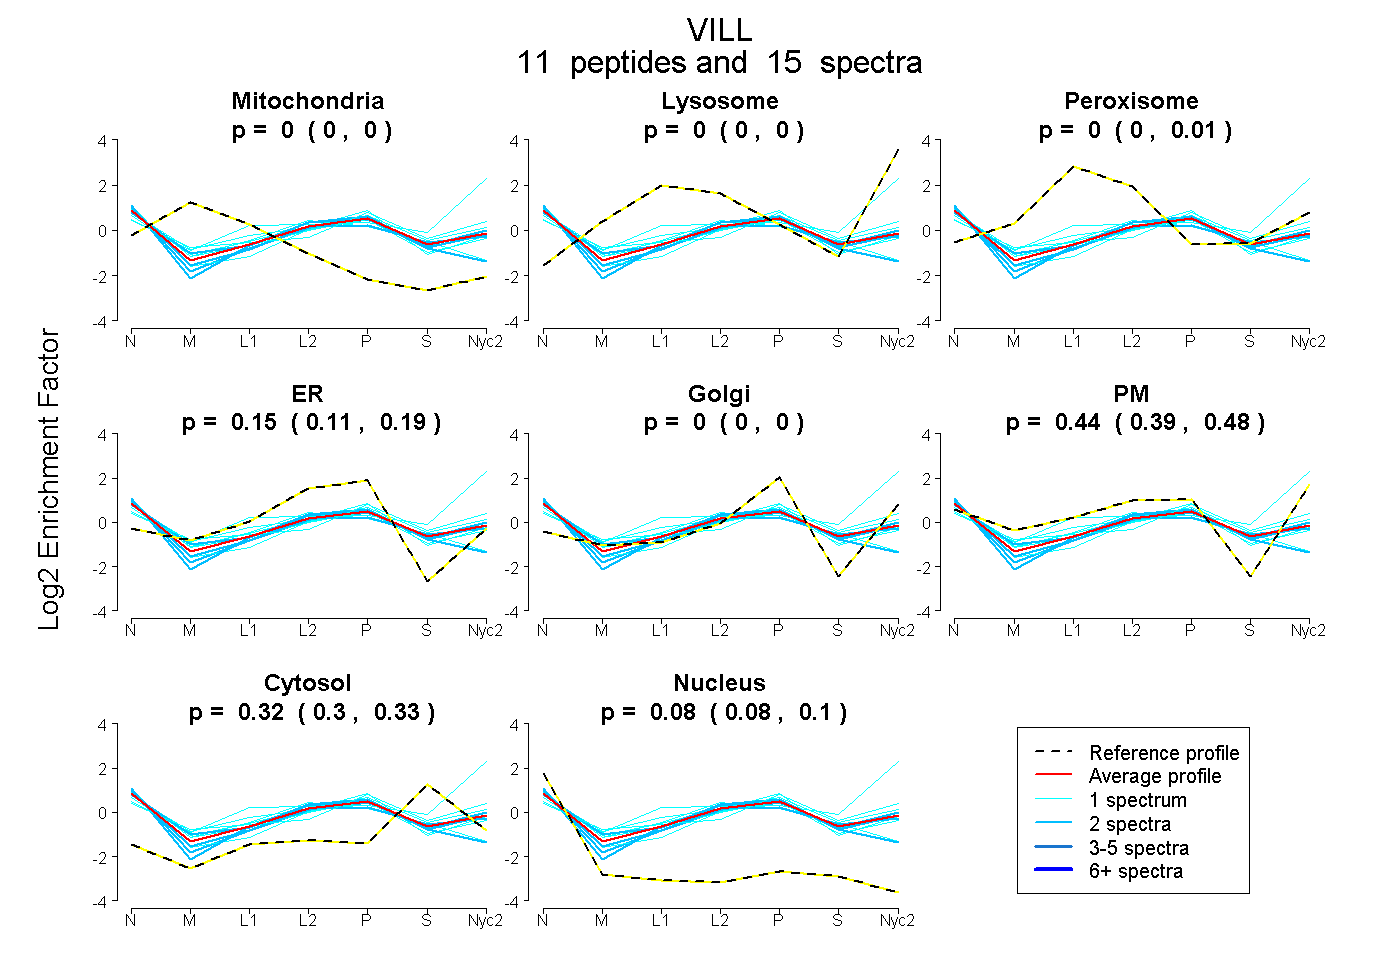
0.000 | 0.000
0.000 | 0.000
0.000 | 0.015
0.112 | 0.189
0.000 | 0.000
0.386 | 0.482
0.304 | 0.325
0.076 | 0.096
3peptides
spectra
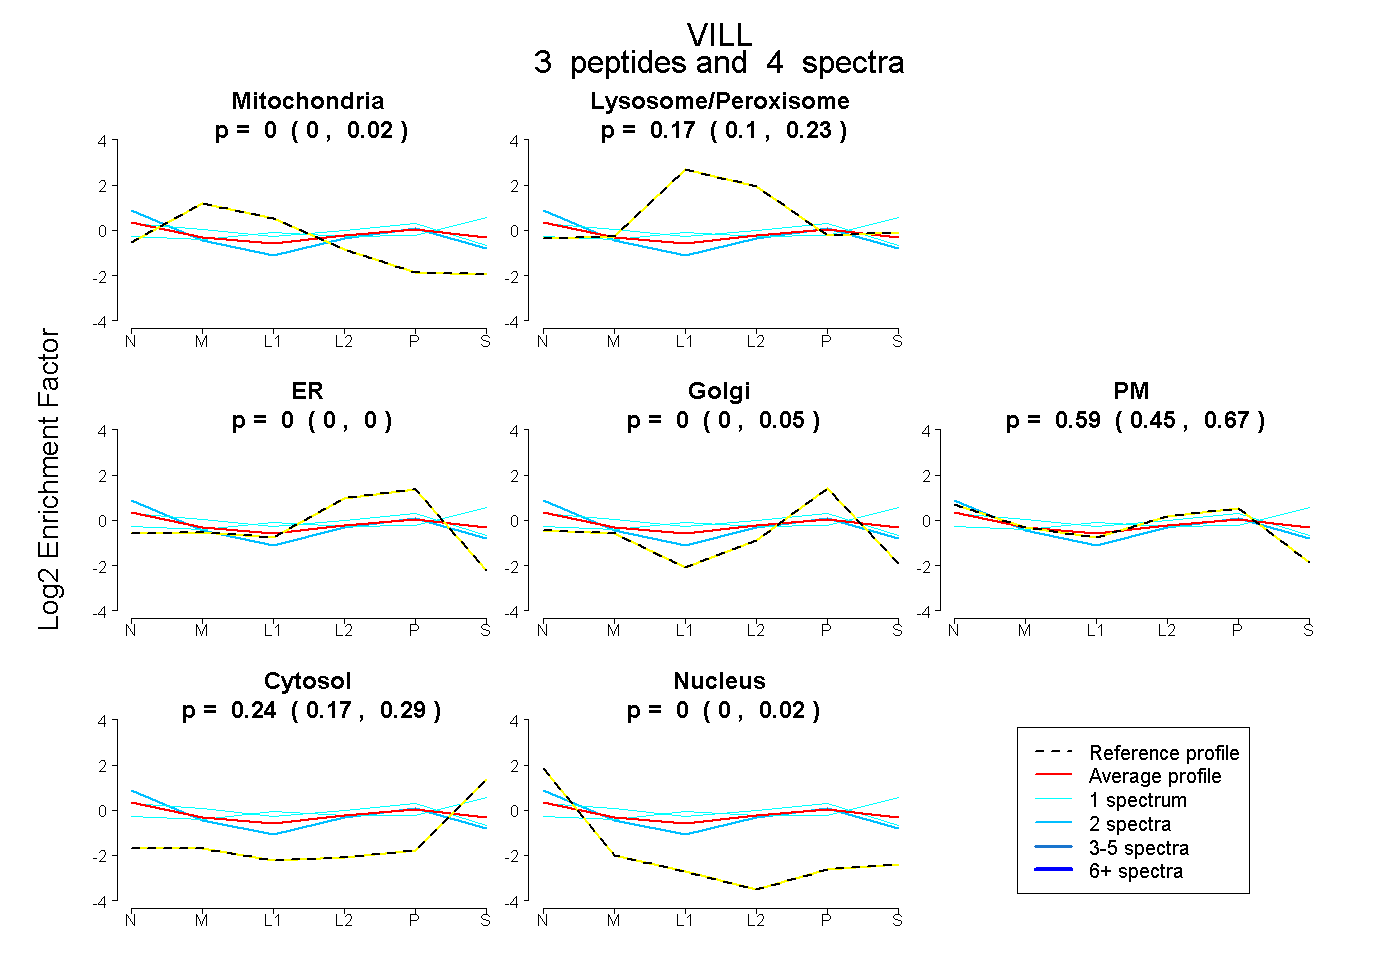
0.000 | 0.022
0.097 | 0.230
0.000 | 0.000
0.000 | 0.054
0.451 | 0.665
0.170 | 0.288
0.000 | 0.017
14peptides
spectra
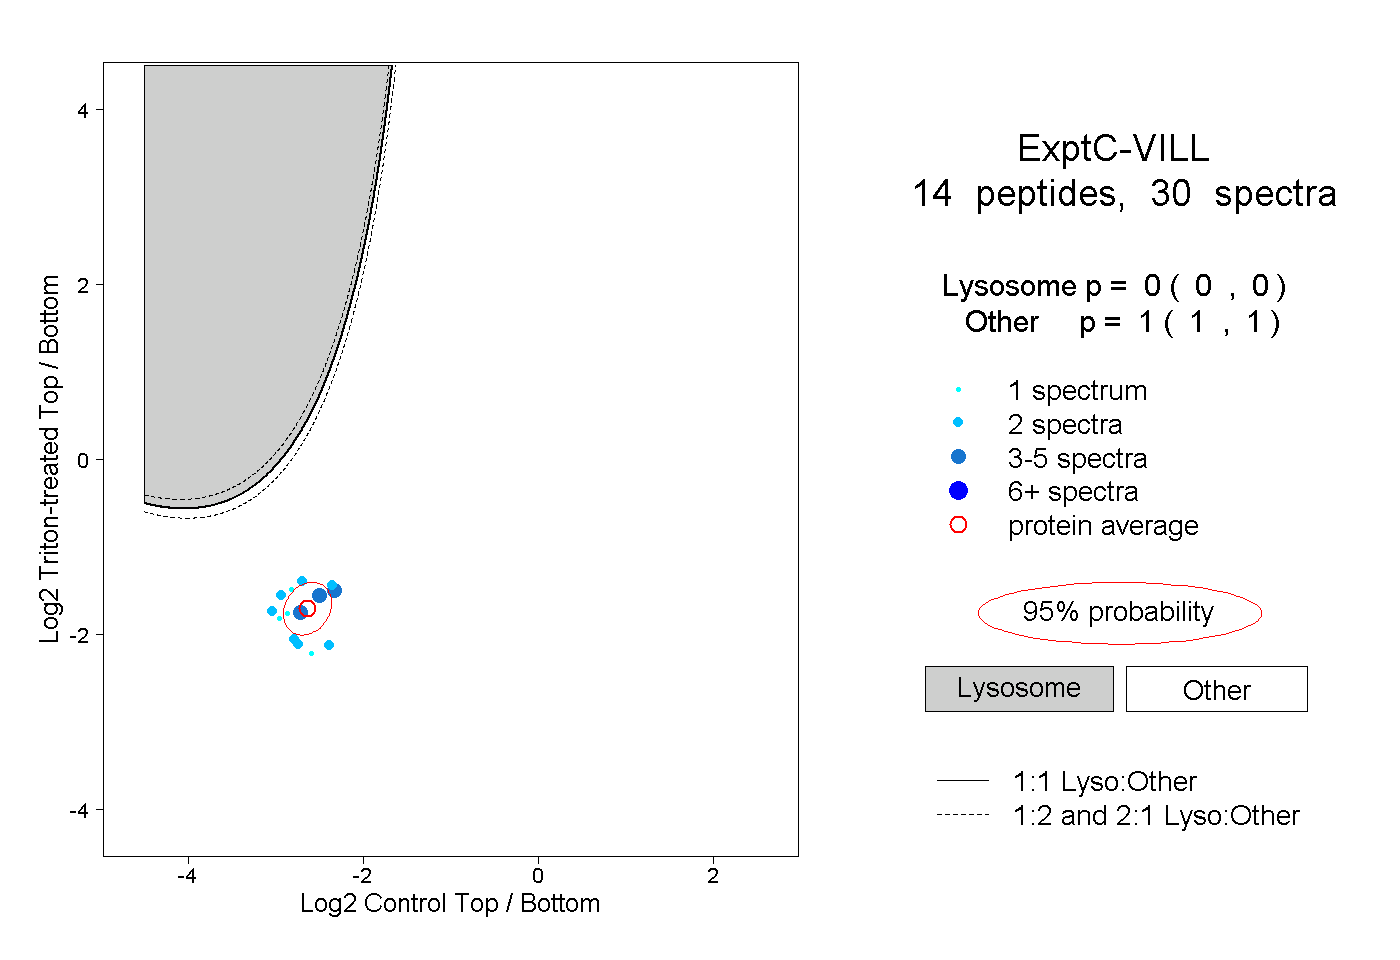
0.000 | 0.000
1.000 | 1.000