 11
11peptides
spectra
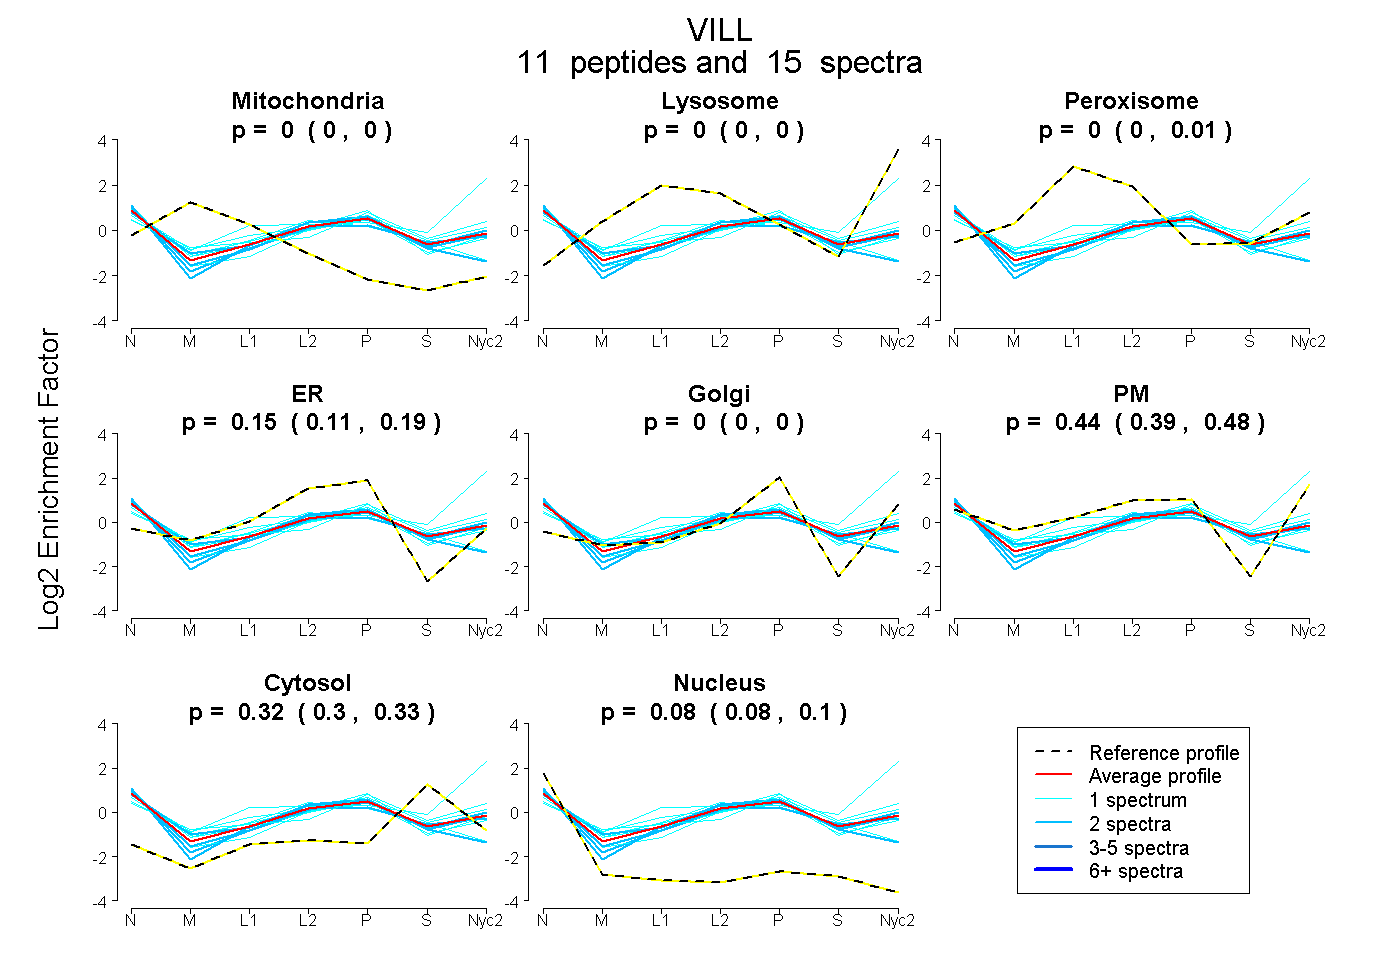
0.000 | 0.000
0.000 | 0.000
0.000 | 0.015
0.112 | 0.189
0.000 | 0.000
0.386 | 0.482
0.304 | 0.325
0.076 | 0.096
| Plot | Mito | Lyso | Perox | ER | Golgi | PM | Cytosol | Nucleus | |||||
| Expt A |
11 peptides |
15 spectra |
|
0.000 0.000 | 0.000 |
0.000 0.000 | 0.000 |
0.000 0.000 | 0.015 |
0.155 0.112 | 0.189 |
0.000 0.000 | 0.000 |
0.443 0.386 | 0.482 |
0.317 0.304 | 0.325 |
0.085 0.076 | 0.096 |
| 1 spectrum, GSQDSPENELELGLR | 0.000 | 0.000 | 0.000 | 0.123 | 0.000 | 0.495 | 0.356 | 0.026 | ||
| 1 spectrum, GDIFLLDLGK | 0.000 | 0.000 | 0.000 | 0.187 | 0.000 | 0.388 | 0.247 | 0.178 | ||
| 2 spectra, TMEVPAR | 0.000 | 0.000 | 0.002 | 0.122 | 0.000 | 0.421 | 0.332 | 0.122 | ||
| 2 spectra, LHTQPELAAQLR | 0.000 | 0.000 | 0.010 | 0.214 | 0.000 | 0.416 | 0.277 | 0.083 | ||
| 1 spectrum, AAVAWGHEYLR | 0.000 | 0.000 | 0.062 | 0.264 | 0.000 | 0.375 | 0.197 | 0.101 | ||
| 1 spectrum, TVVTVFPGNNK | 0.000 | 0.000 | 0.000 | 0.000 | 0.133 | 0.492 | 0.375 | 0.000 | ||
| 1 spectrum, APYPSNK | 0.000 | 0.277 | 0.000 | 0.000 | 0.000 | 0.444 | 0.279 | 0.000 | ||
| 2 spectra, LQQDLGDQTVLHR | 0.000 | 0.000 | 0.038 | 0.510 | 0.000 | 0.000 | 0.256 | 0.196 | ||
| 2 spectra, ALSLTCSLR | 0.000 | 0.000 | 0.000 | 0.084 | 0.000 | 0.485 | 0.314 | 0.116 | ||
| 1 spectrum, DLHCWIGK | 0.000 | 0.000 | 0.213 | 0.369 | 0.000 | 0.000 | 0.218 | 0.201 | ||
| 1 spectrum, LGESNVYNVQR | 0.000 | 0.000 | 0.000 | 0.132 | 0.000 | 0.468 | 0.287 | 0.113 |
| Plot | Mito | Lyso or Perox | ER | Golgi | PM | Cytosol | Nucleus | ||||||
| Expt B |
3 peptides |
4 spectra |
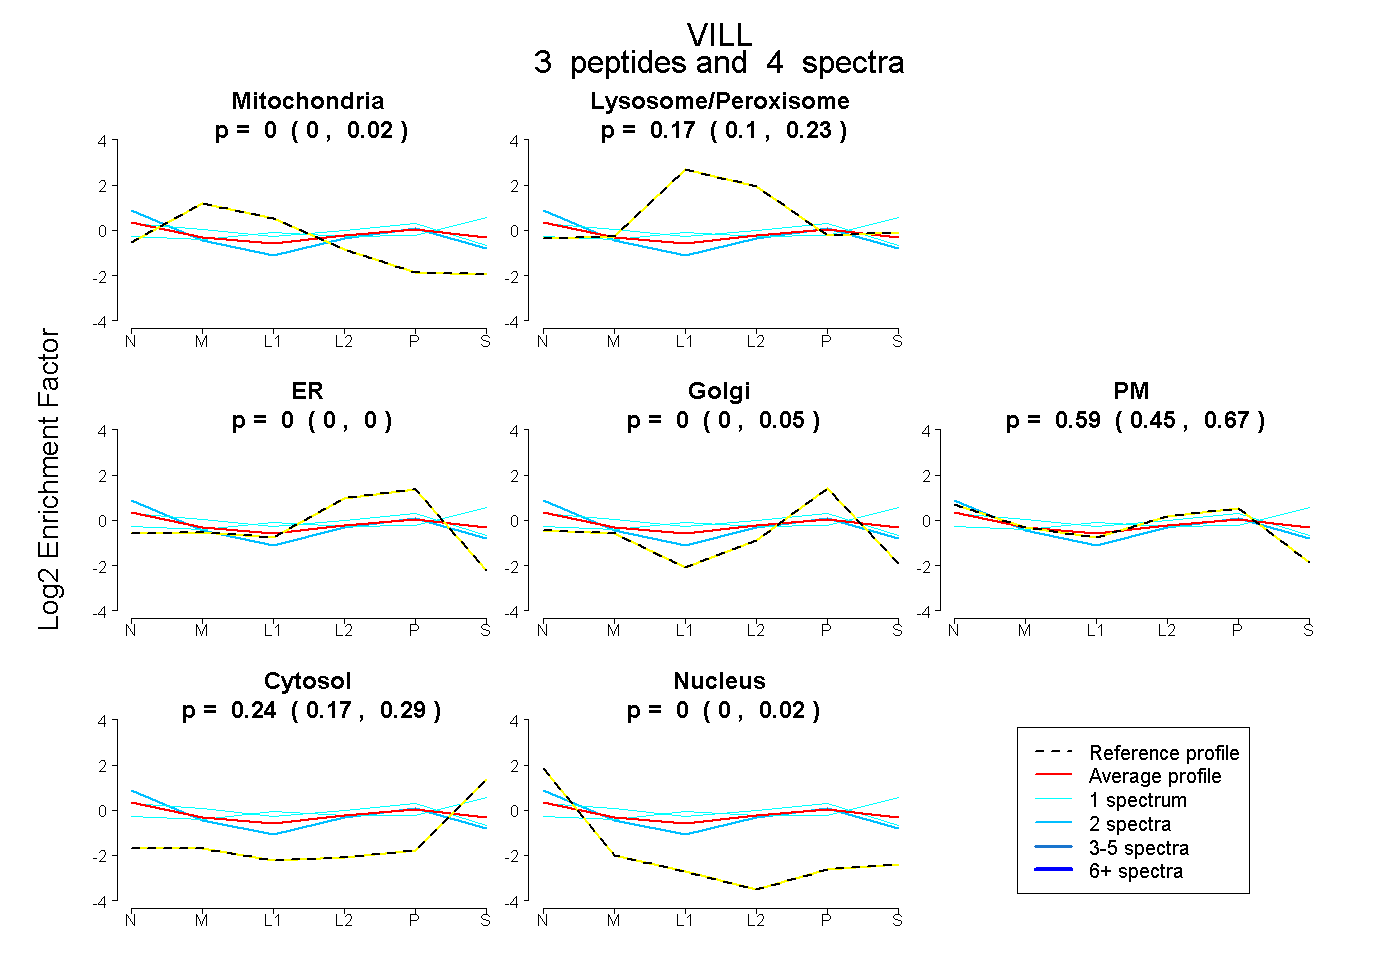 |
0.000 0.000 | 0.022 |
0.166 0.097 | 0.230 |
0.000 0.000 | 0.000 |
0.000 0.000 | 0.054 |
0.591 0.451 | 0.665 |
0.243 0.170 | 0.288 |
0.000 0.000 | 0.017 |
|||
| Plot | Lyso | Other | |||||||||||
| Expt C |
14 peptides |
30 spectra |
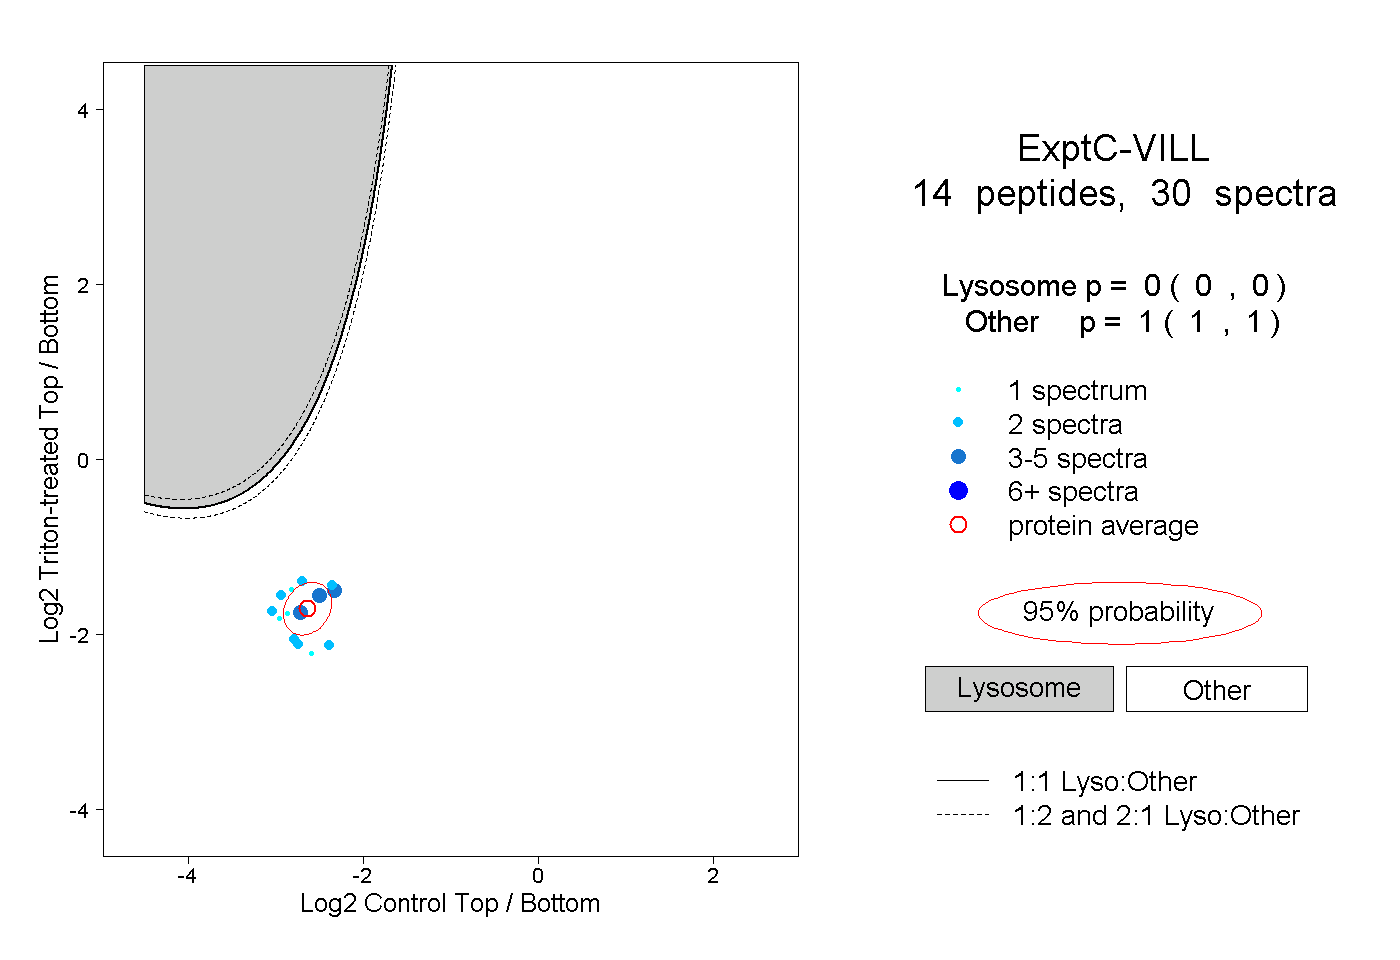 |
0.000 0.000 | 0.000 |
1.000 1.000 | 1.000 |