VILL
[ENSRNOP00000015888]
Main page
| | | Plot |
Mito |
Lyso |
|
Perox |
ER |
Golgi |
PM |
Cytosol |
Nucleus |
|
| Expt A |
 11
11
peptides |
15
spectra |
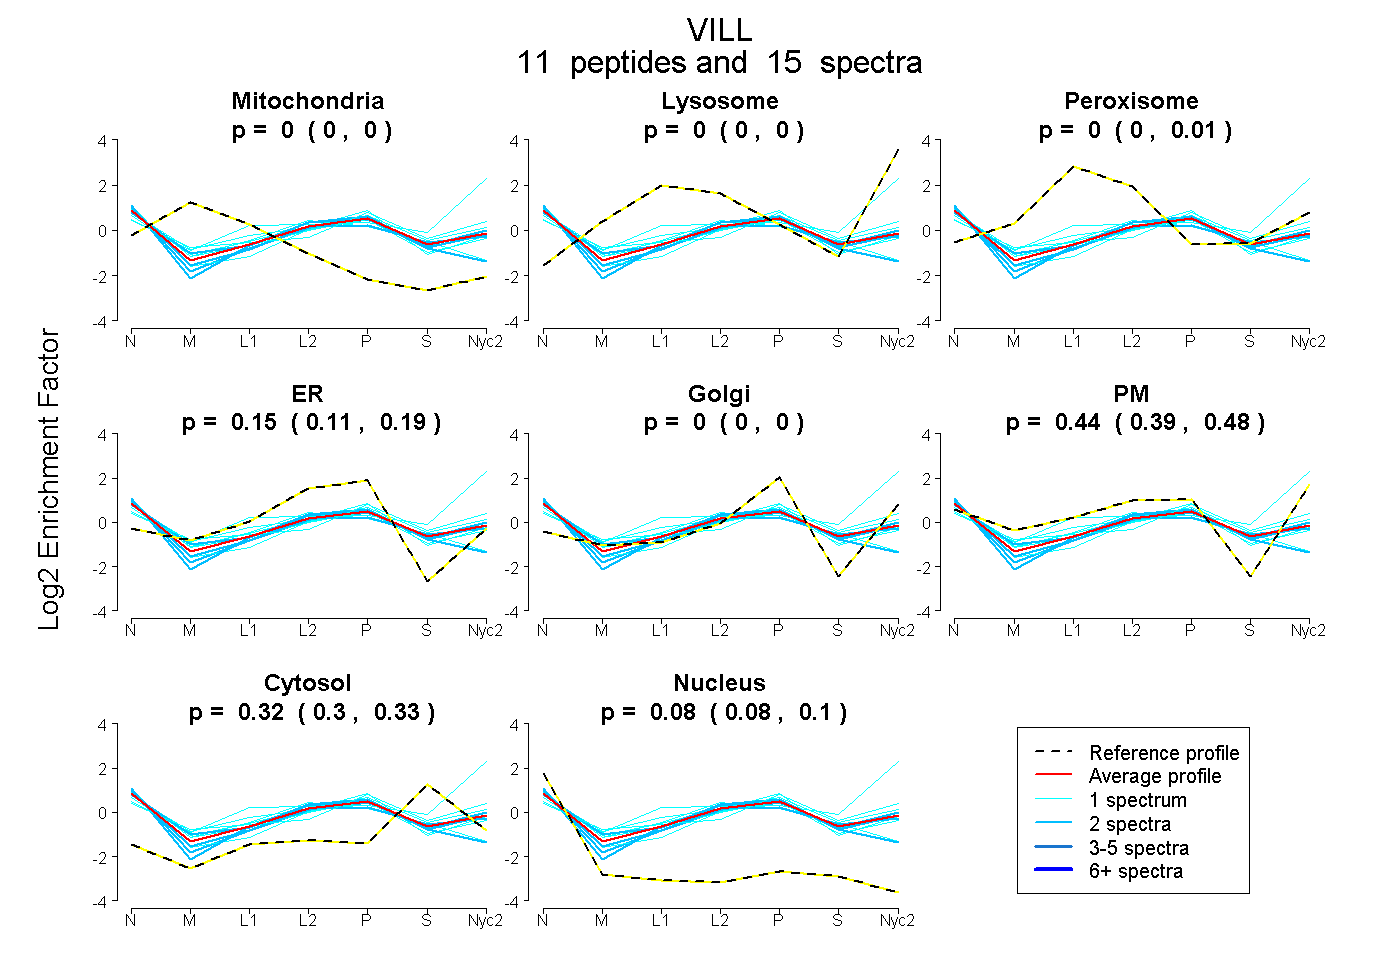 |
0.000
0.000 | 0.000 |
0.000
0.000 | 0.000 |
|
0.000
0.000 | 0.015 |
0.155
0.112 | 0.189 |
0.000
0.000 | 0.000 |
0.443
0.386 | 0.482 |
0.317
0.304 | 0.325 |
0.085
0.076 | 0.096 |
|
| | | Plot |
Mito |
|
Lyso or Perox |
|
ER |
Golgi |
PM |
Cytosol |
Nucleus |
|
| Expt B |
3
peptides |
4
spectra |
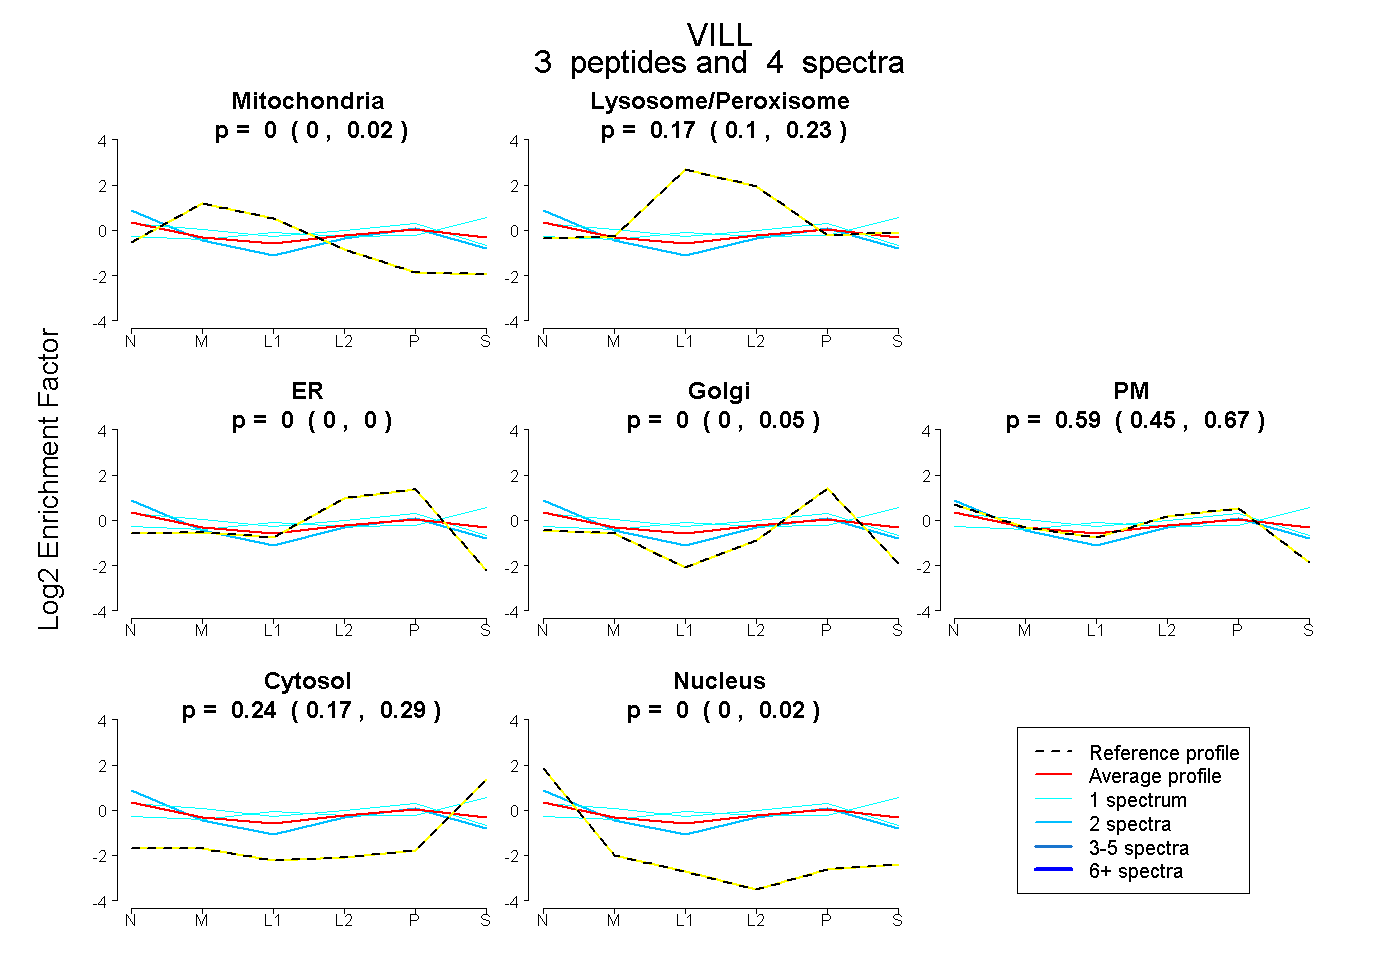 |
0.000
0.000 | 0.022 |
|
0.166
0.097 | 0.230 |
|
0.000
0.000 | 0.000 |
0.000
0.000 | 0.054 |
0.591
0.451 | 0.665 |
0.243
0.170 | 0.288 |
0.000
0.000 | 0.017 |
|
| 1 spectrum, LHTQPELAAQLR |
0.000 |
|
0.367 |
|
0.000 |
0.015 |
0.238 |
0.381 |
0.000 |
|
| 1 spectrum, VVDAENK |
0.034 |
|
0.209 |
|
0.000 |
0.052 |
0.576 |
0.129 |
0.000 |
|
| 2 spectra, ALSLTCSLR |
0.000 |
|
0.019 |
|
0.000 |
0.000 |
0.775 |
0.167 |
0.039 |
|
| | | Plot |
|
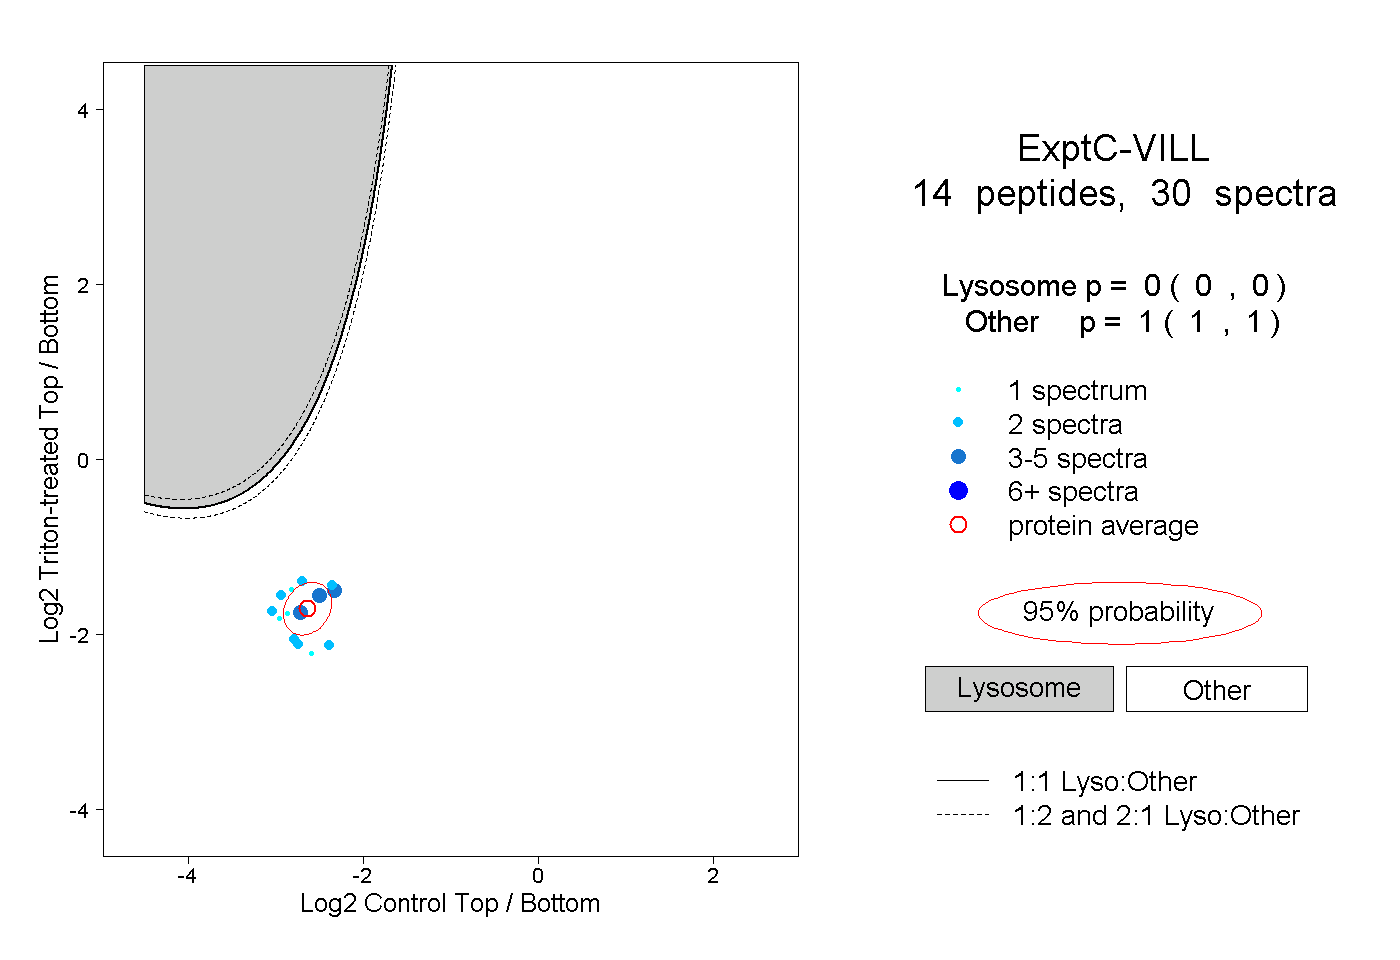
Lyso |
|
|
|
|
|
|
|
Other |
| Expt C |
14
peptides |
30
spectra |
 |
|
0.000
0.000 | 0.000 |
|
|
|
|
|
|
|
1.000
1.000 | 1.000 |