 27
27peptides
spectra
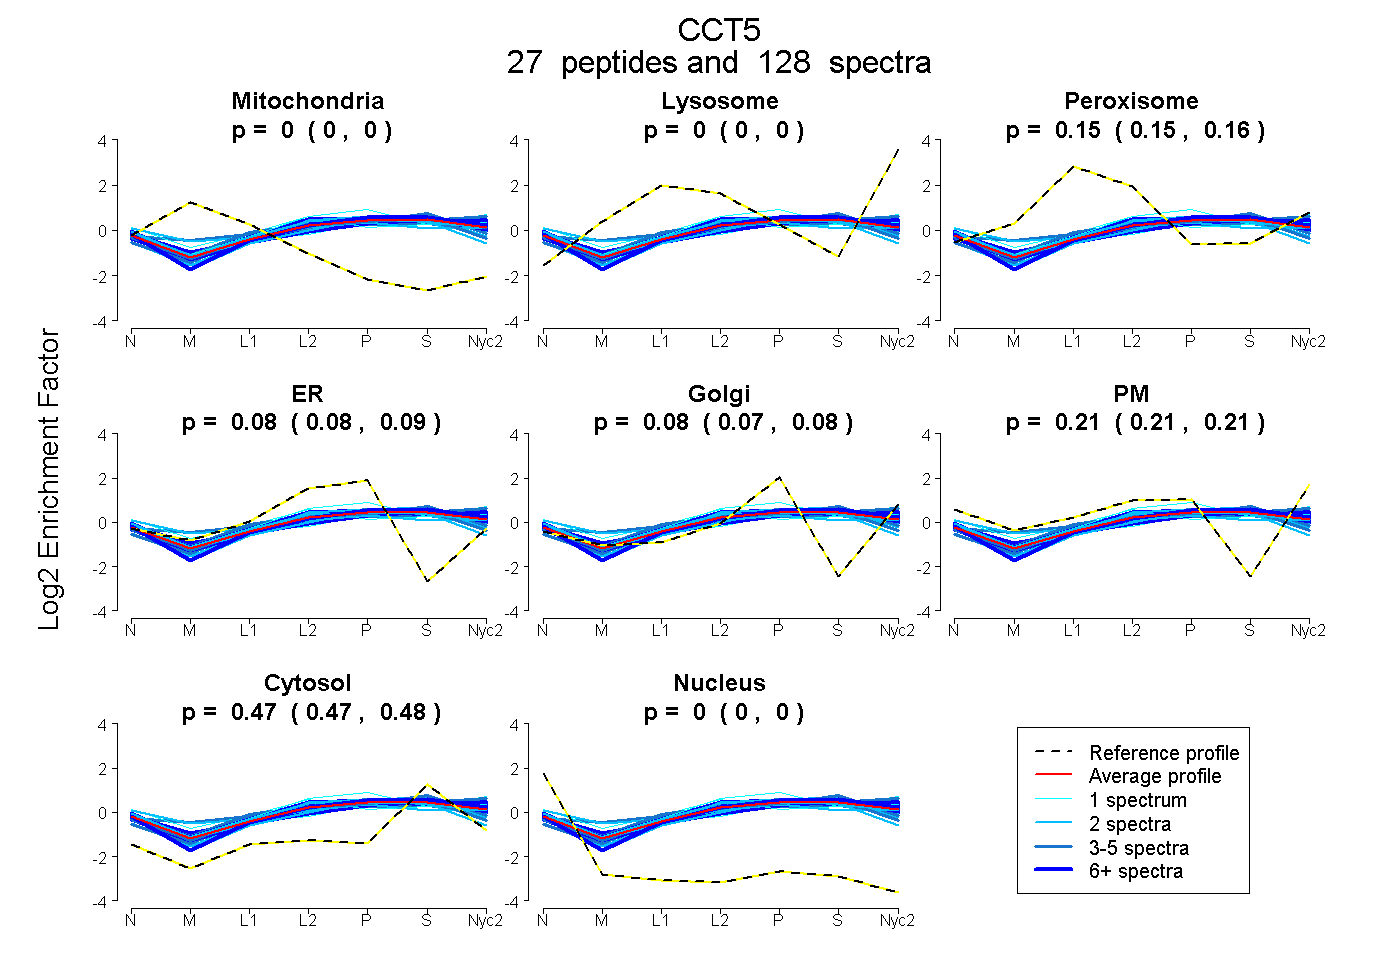
0.000 | 0.000
0.000 | 0.000
0.152 | 0.156
0.078 | 0.086
0.074 | 0.083
0.207 | 0.214
0.473 | 0.476
0.000 | 0.000
12peptides
spectra
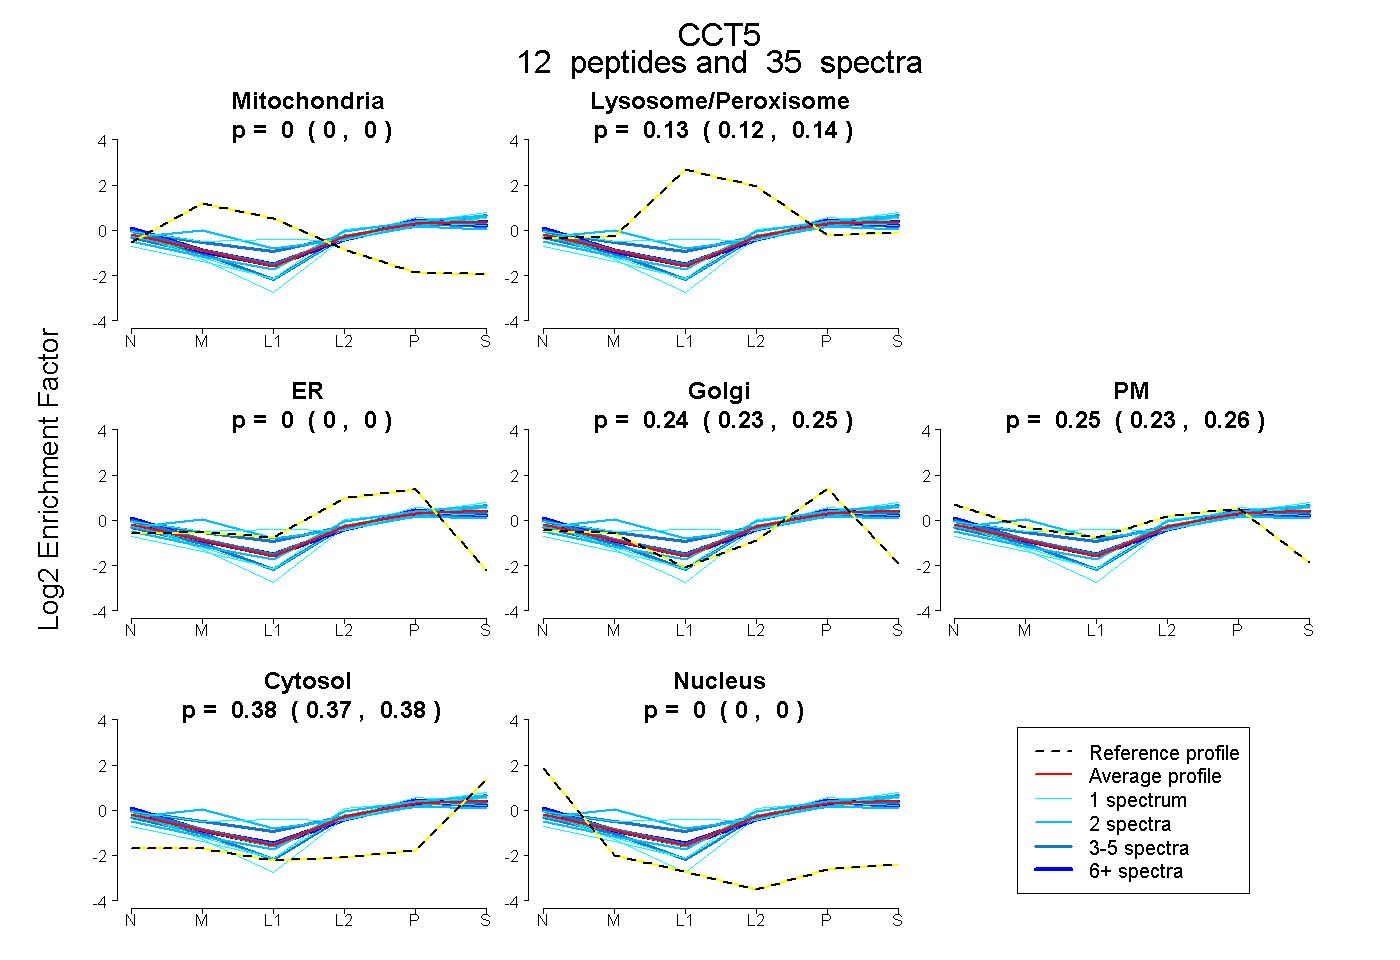
0.000 | 0.000
0.122 | 0.141
0.000 | 0.000
0.230 | 0.251
0.230 | 0.262
0.375 | 0.383
0.000 | 0.000
28peptides
spectra
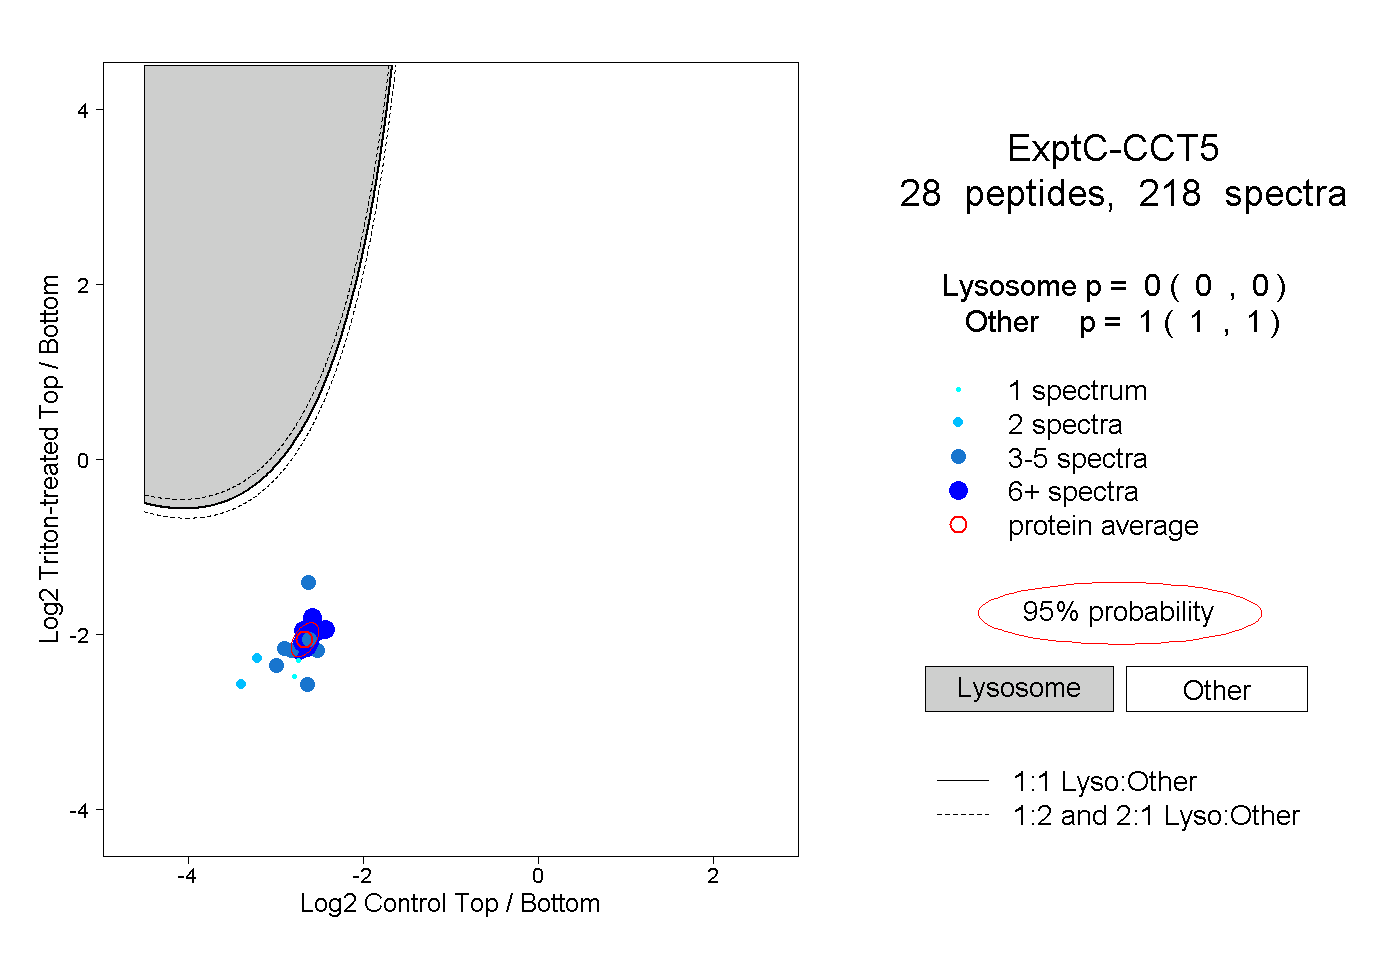
0.000 | 0.000
1.000 | 1.000
11peptides
spectra
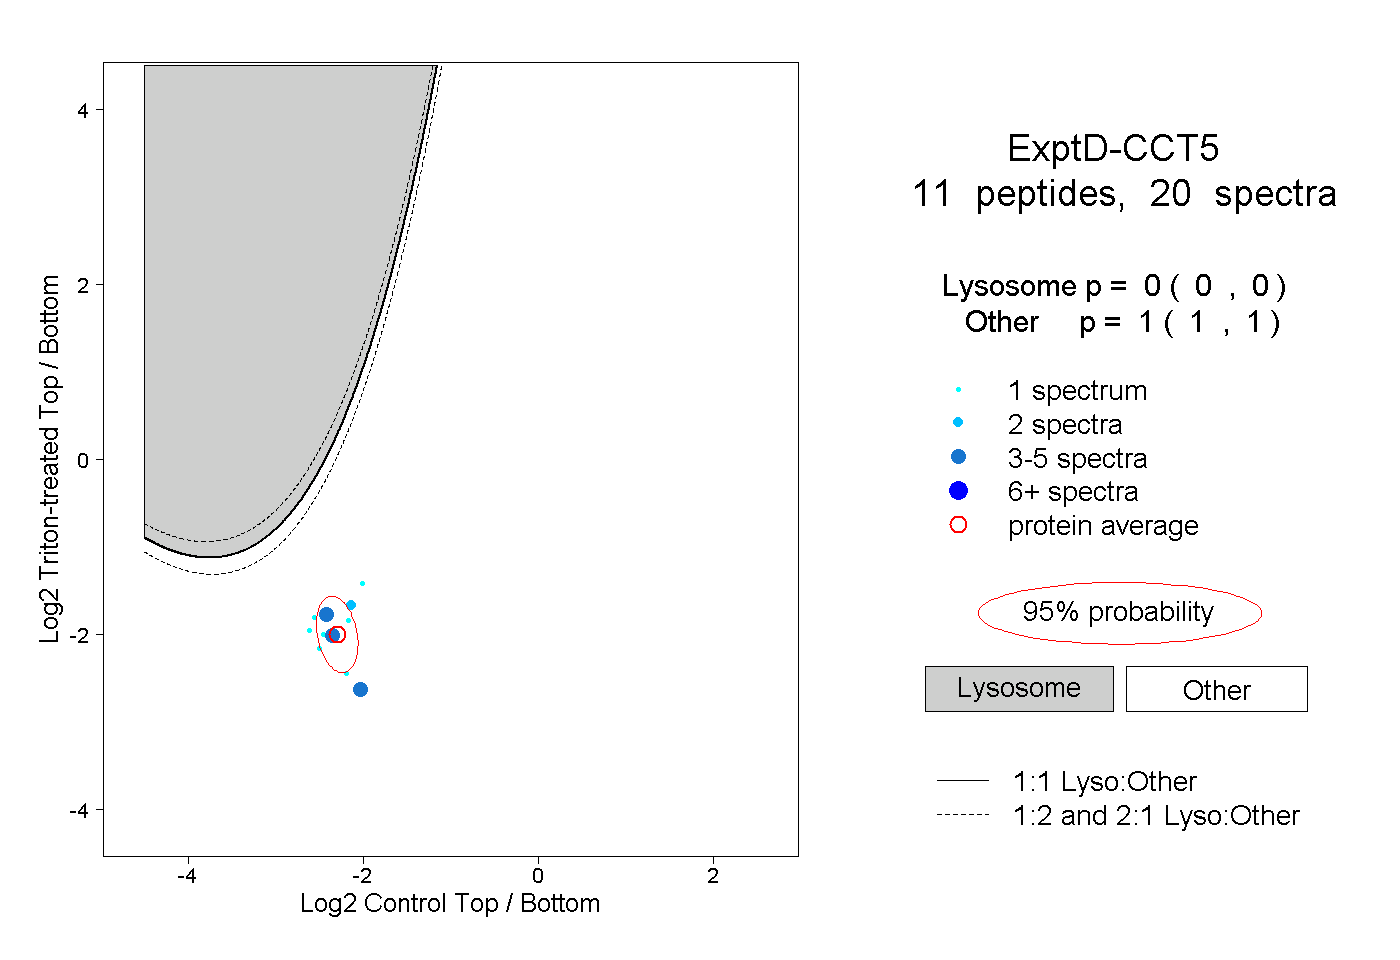
0.000 | 0.000
1.000 | 1.000