 27
27peptides
spectra
0.000 | 0.000
0.000 | 0.000
0.152 | 0.156
0.078 | 0.086
0.074 | 0.083
0.207 | 0.214
0.473 | 0.476
0.000 | 0.000
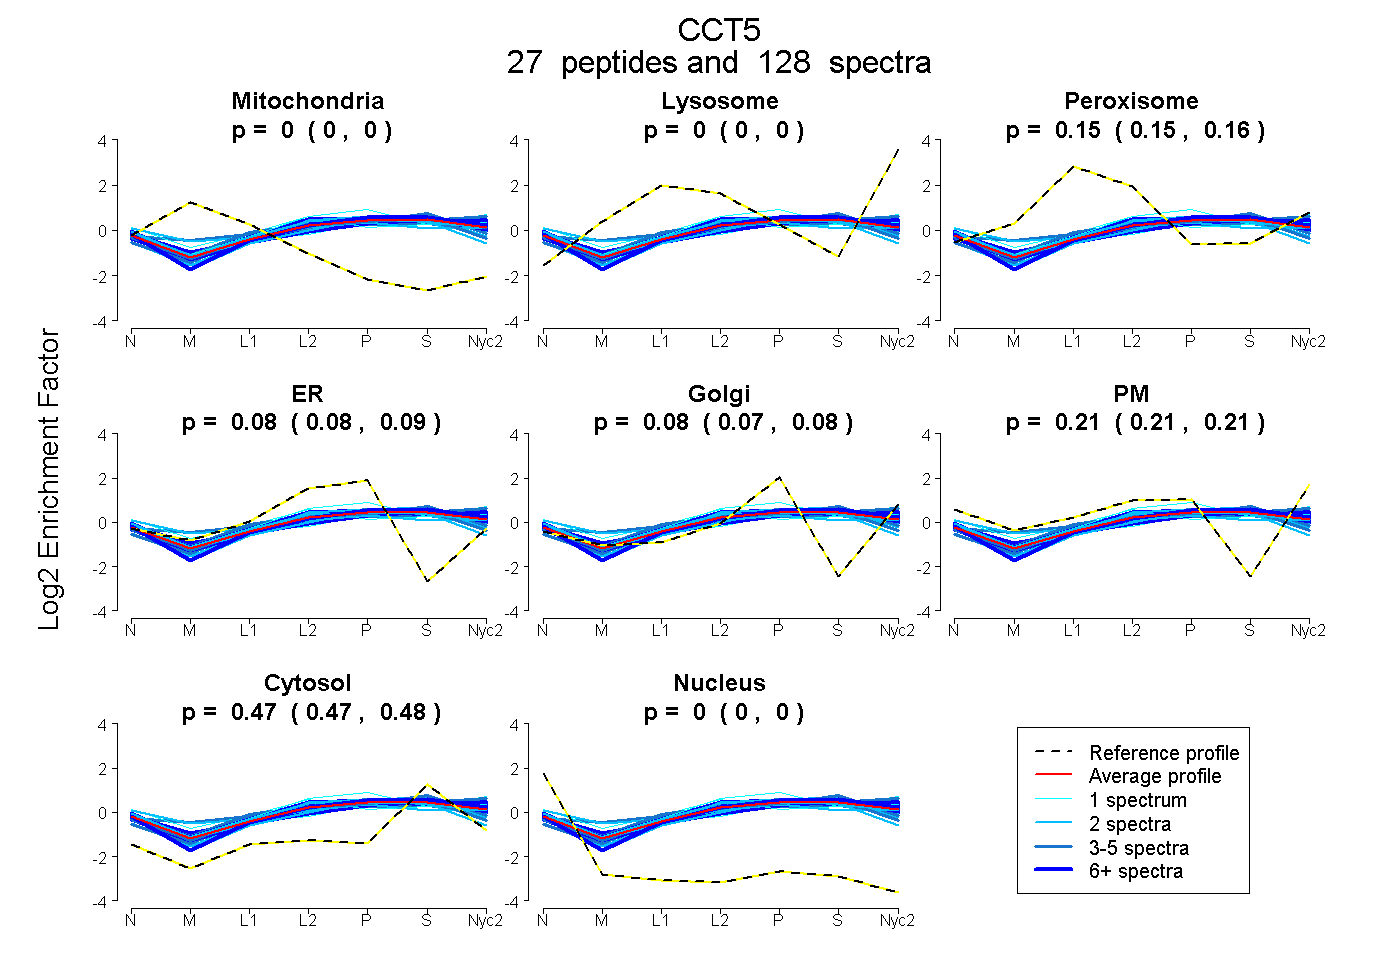
| Plot | Mito | Lyso | Perox | ER | Golgi | PM | Cytosol | Nucleus | |||||
| Expt A |
27 peptides |
128 spectra |
|
0.000 0.000 | 0.000 |
0.000 0.000 | 0.000 |
0.154 0.152 | 0.156 |
0.082 0.078 | 0.086 |
0.079 0.074 | 0.083 |
0.210 0.207 | 0.214 |
0.475 0.473 | 0.476 |
0.000 0.000 | 0.000 |
| 1 spectrum, DFSHPQMPK | 0.000 | 0.000 | 0.235 | 0.000 | 0.161 | 0.188 | 0.417 | 0.000 | ||
| 4 spectra, FSELTSEK | 0.000 | 0.000 | 0.141 | 0.104 | 0.084 | 0.227 | 0.443 | 0.000 | ||
| 4 spectra, EVLNAK | 0.000 | 0.000 | 0.287 | 0.000 | 0.206 | 0.104 | 0.402 | 0.000 | ||
| 1 spectrum, KPGESEE | 0.000 | 0.000 | 0.218 | 0.000 | 0.000 | 0.400 | 0.383 | 0.000 | ||
| 9 spectra, DVDFELIK | 0.000 | 0.000 | 0.153 | 0.114 | 0.054 | 0.180 | 0.497 | 0.000 | ||
| 18 spectra, LGFAGVVR | 0.000 | 0.000 | 0.151 | 0.074 | 0.073 | 0.262 | 0.440 | 0.000 | ||
| 4 spectra, MIIEEAK | 0.000 | 0.049 | 0.165 | 0.000 | 0.053 | 0.299 | 0.434 | 0.000 | ||
| 2 spectra, LDVTSVEDYK | 0.000 | 0.000 | 0.049 | 0.134 | 0.035 | 0.224 | 0.558 | 0.000 | ||
| 8 spectra, IADGYEQAAR | 0.000 | 0.000 | 0.073 | 0.000 | 0.000 | 0.407 | 0.520 | 0.000 | ||
| 2 spectra, GLHPIR | 0.000 | 0.000 | 0.138 | 0.124 | 0.000 | 0.221 | 0.518 | 0.000 | ||
| 6 spectra, WVGGPEIELIAIATGGR | 0.000 | 0.000 | 0.079 | 0.107 | 0.023 | 0.268 | 0.522 | 0.000 | ||
| 2 spectra, TTLGSK | 0.000 | 0.000 | 0.097 | 0.180 | 0.000 | 0.263 | 0.460 | 0.000 | ||
| 3 spectra, SHIMAAK | 0.000 | 0.000 | 0.150 | 0.081 | 0.106 | 0.203 | 0.461 | 0.000 | ||
| 4 spectra, IAIQHLDK | 0.000 | 0.000 | 0.145 | 0.110 | 0.065 | 0.207 | 0.473 | 0.000 | ||
| 3 spectra, GSNDMQYQHVIETLIGK | 0.000 | 0.000 | 0.225 | 0.054 | 0.195 | 0.000 | 0.527 | 0.000 | ||
| 1 spectrum, TSLGPNGLDK | 0.000 | 0.059 | 0.126 | 0.212 | 0.086 | 0.135 | 0.382 | 0.000 | ||
| 13 spectra, AVANTMR | 0.000 | 0.000 | 0.176 | 0.026 | 0.140 | 0.207 | 0.452 | 0.000 | ||
| 2 spectra, CPTLEQYAMR | 0.000 | 0.014 | 0.160 | 0.042 | 0.283 | 0.000 | 0.501 | 0.000 | ||
| 1 spectrum, GVIVDK | 0.000 | 0.000 | 0.151 | 0.000 | 0.131 | 0.222 | 0.497 | 0.000 | ||
| 2 spectra, VVNSCHR | 0.000 | 0.000 | 0.168 | 0.350 | 0.000 | 0.004 | 0.478 | 0.000 | ||
| 7 spectra, AVTIFIR | 0.000 | 0.000 | 0.140 | 0.039 | 0.113 | 0.230 | 0.478 | 0.000 | ||
| 9 spectra, LMGLEALK | 0.000 | 0.000 | 0.169 | 0.115 | 0.112 | 0.124 | 0.480 | 0.000 | ||
| 2 spectra, ESNPALGIDCLHK | 0.000 | 0.000 | 0.115 | 0.265 | 0.000 | 0.077 | 0.543 | 0.000 | ||
| 2 spectra, EISFGTTK | 0.000 | 0.000 | 0.097 | 0.122 | 0.000 | 0.253 | 0.528 | 0.000 | ||
| 5 spectra, MLVIEQCK | 0.000 | 0.000 | 0.150 | 0.265 | 0.000 | 0.066 | 0.520 | 0.000 | ||
| 2 spectra, LMVELSK | 0.012 | 0.000 | 0.155 | 0.035 | 0.048 | 0.344 | 0.407 | 0.000 | ||
| 11 spectra, QQISLATQMVR | 0.000 | 0.018 | 0.136 | 0.096 | 0.009 | 0.292 | 0.447 | 0.000 |
| Plot | Mito | Lyso or Perox | ER | Golgi | PM | Cytosol | Nucleus | ||||||
| Expt B |
12 peptides |
35 spectra |
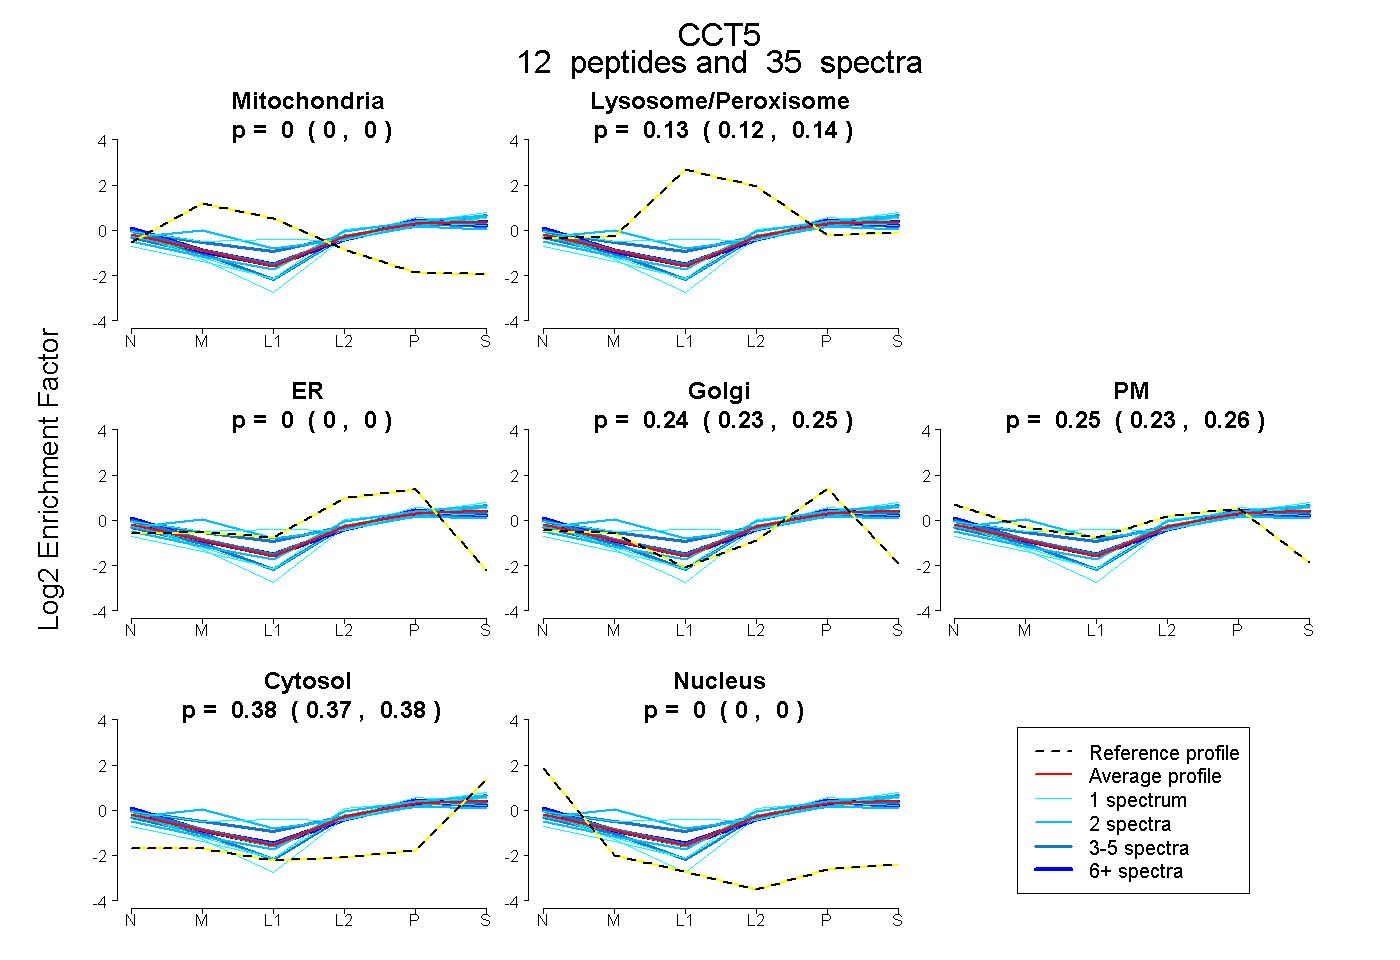 |
0.000 0.000 | 0.000 |
0.132 0.122 | 0.141 |
0.000 0.000 | 0.000 |
0.241 0.230 | 0.251 |
0.247 0.230 | 0.262 |
0.379 0.375 | 0.383 |
0.000 0.000 | 0.000 |
|||
| Plot | Lyso | Other | |||||||||||
| Expt C |
28 peptides |
218 spectra |
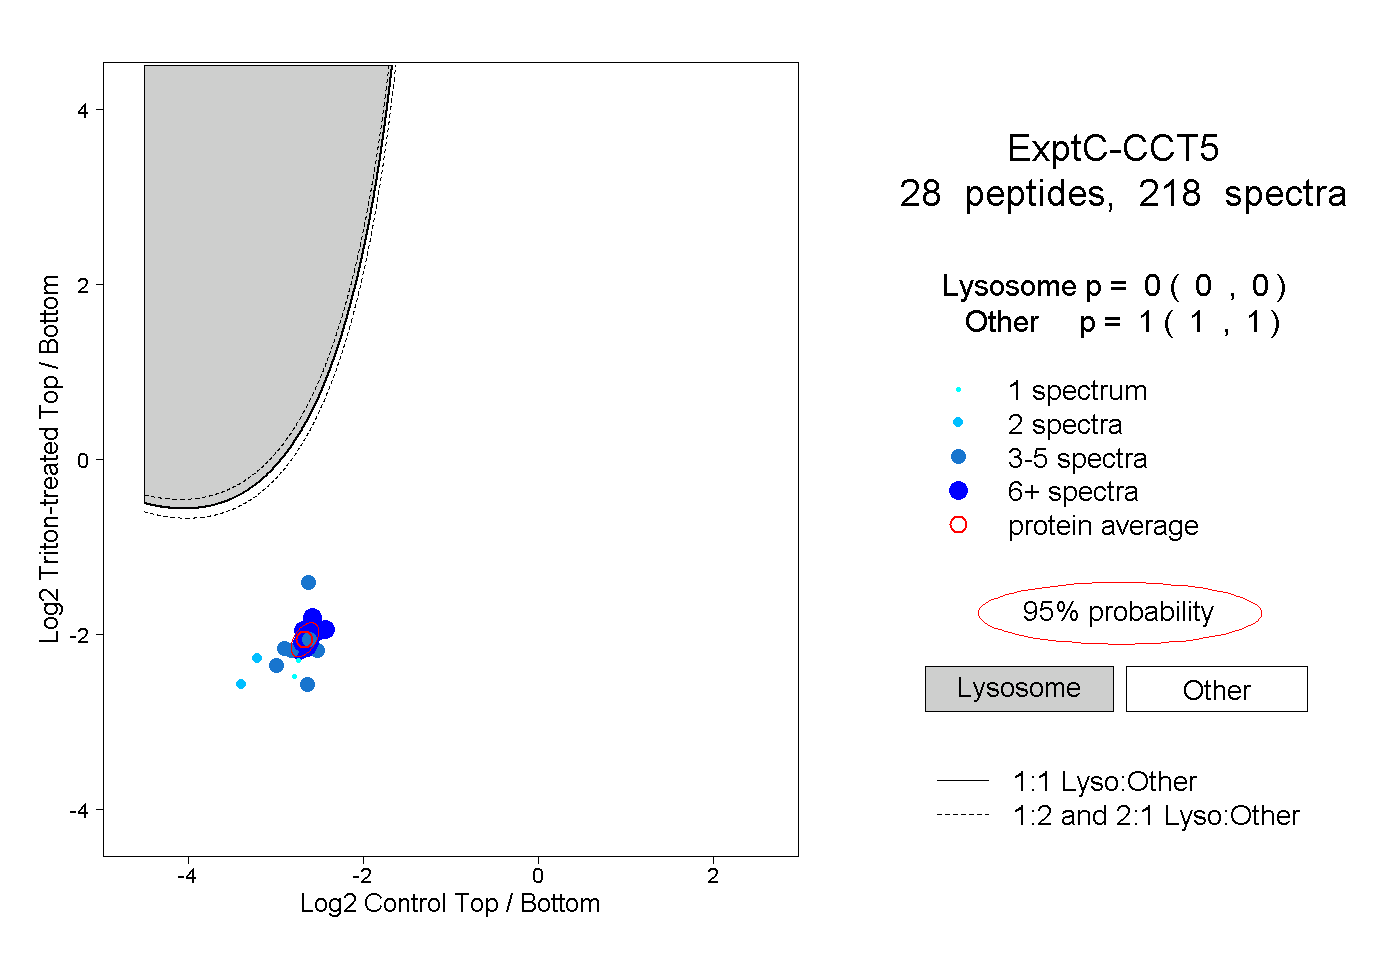 |
0.000 0.000 | 0.000 |
1.000 1.000 | 1.000 |
||||||||
| Plot | Lyso | Other | |||||||||||
| Expt D |
11 peptides |
20 spectra |
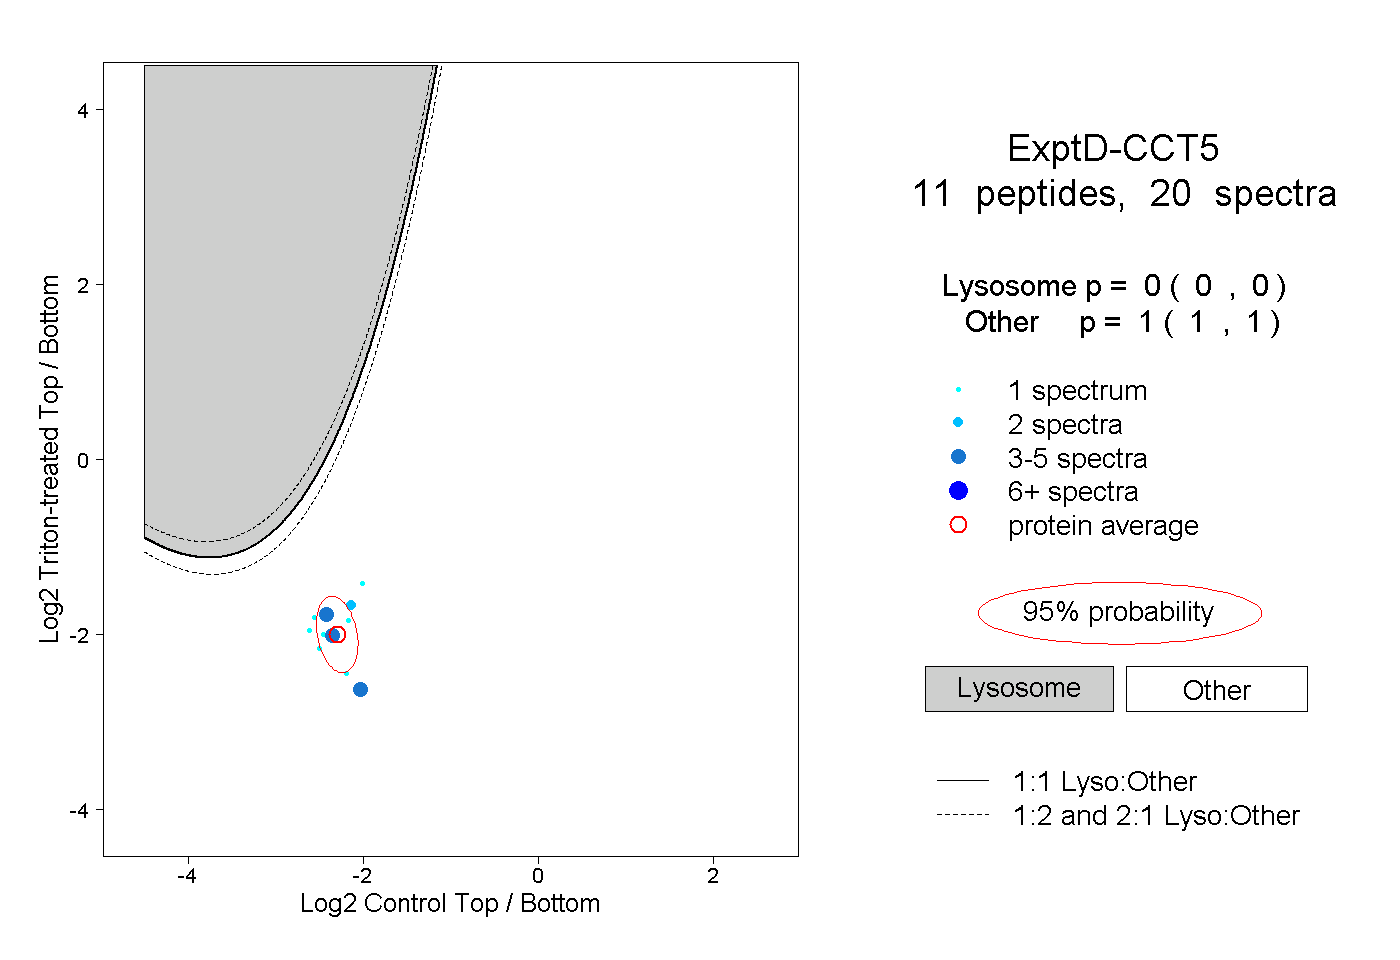 |
0.000 0.000 | 0.000 |
1.000 1.000 | 1.000 |