CCT5
[ENSRNOP00000015886]
Main page
| | | Plot |
Mito |
Lyso |
|
Perox |
ER |
Golgi |
PM |
Cytosol |
Nucleus |
|
| Expt A |
 27
27
peptides |
128
spectra |
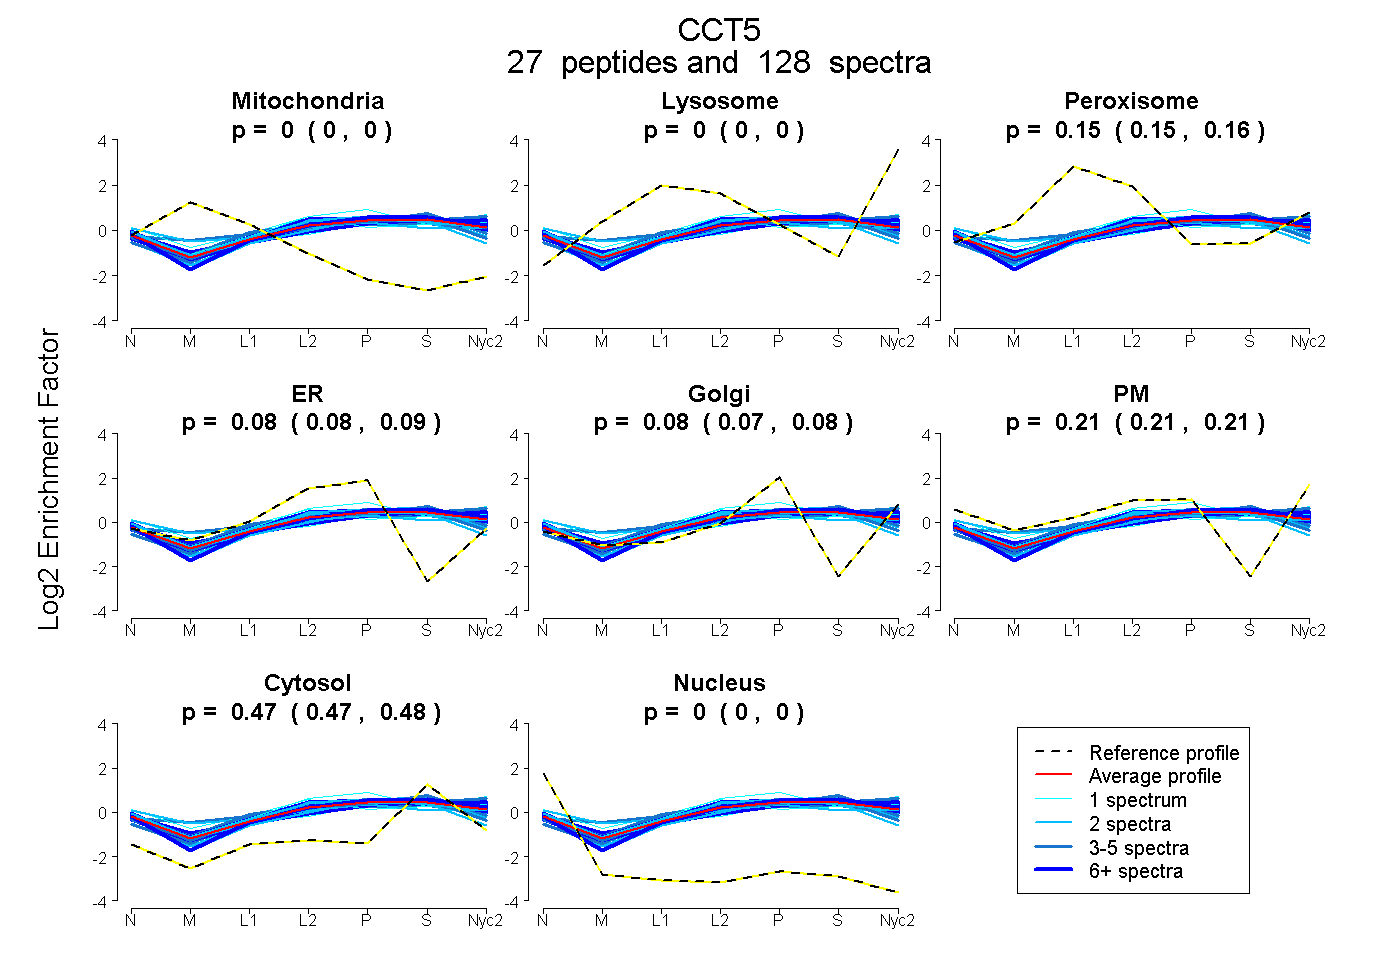 |
0.000
0.000 | 0.000 |
0.000
0.000 | 0.000 |
|
0.154
0.152 | 0.156 |
0.082
0.078 | 0.086 |
0.079
0.074 | 0.083 |
0.210
0.207 | 0.214 |
0.475
0.473 | 0.476 |
0.000
0.000 | 0.000 |
|
| | | Plot |
Mito |
|
Lyso or Perox |
|
ER |
Golgi |
PM |
Cytosol |
Nucleus |
|
| Expt B |
12
peptides |
35
spectra |
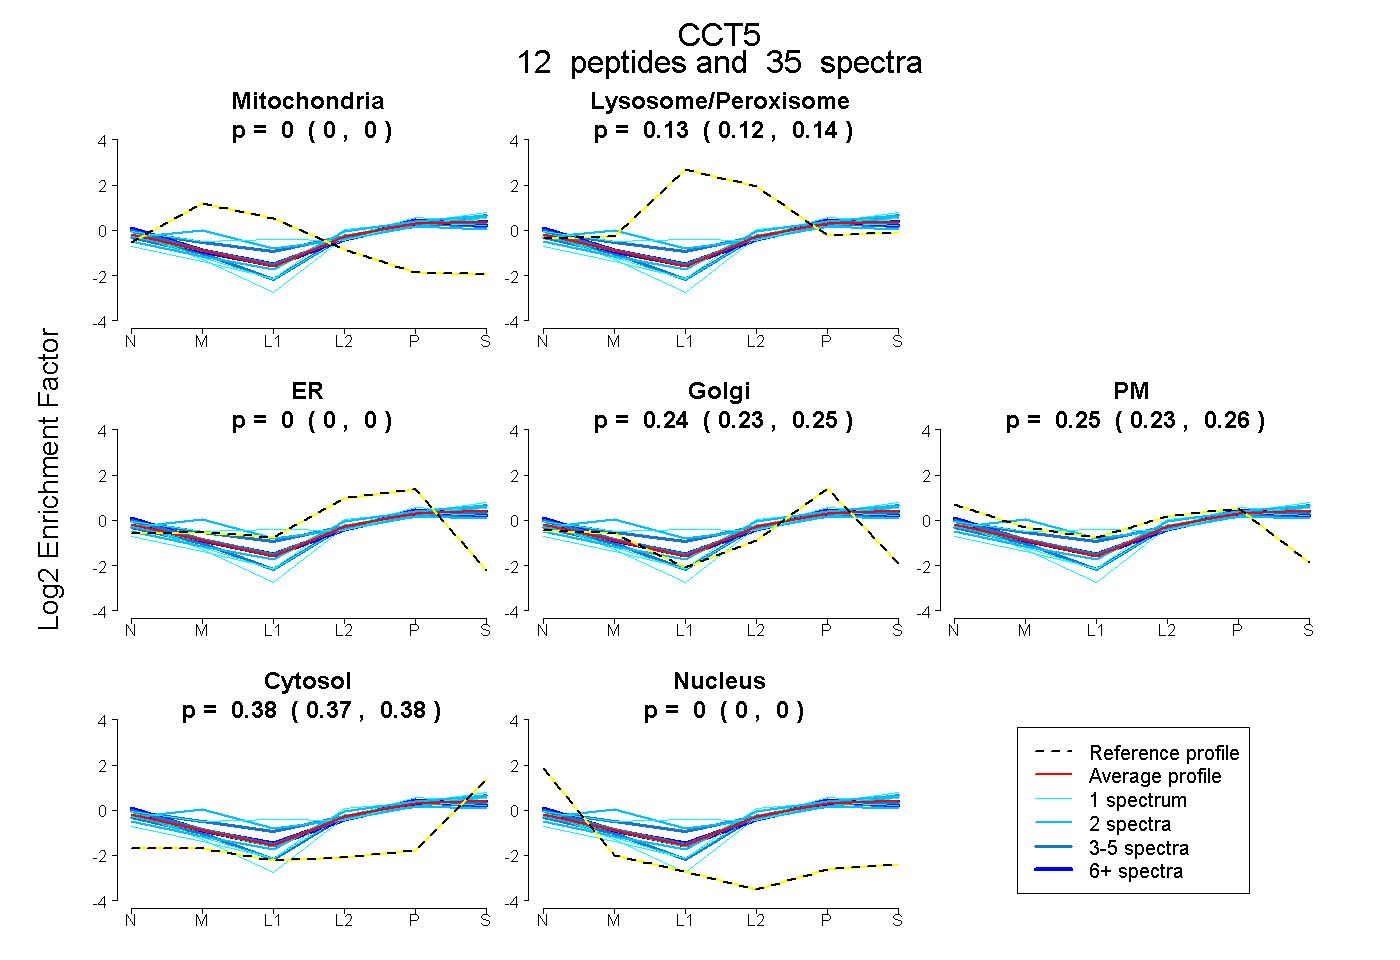 |
0.000
0.000 | 0.000 |
|
0.132
0.122 | 0.141 |
|
0.000
0.000 | 0.000 |
0.241
0.230 | 0.251 |
0.247
0.230 | 0.262 |
0.379
0.375 | 0.383 |
0.000
0.000 | 0.000 |
|
| 1 spectrum, FEEMIAQIK |
0.000 |
|
0.000 |
|
0.460 |
0.000 |
0.000 |
0.540 |
0.000 |
|
| 1 spectrum, DVDFELIK |
0.000 |
|
0.000 |
|
0.116 |
0.110 |
0.322 |
0.453 |
0.000 |
|
| 1 spectrum, TSLGPNGLDK |
0.000 |
|
0.289 |
|
0.000 |
0.208 |
0.215 |
0.288 |
0.000 |
|
| 5 spectra, AVANTMR |
0.000 |
|
0.000 |
|
0.190 |
0.069 |
0.236 |
0.506 |
0.000 |
|
| 4 spectra, LGFAGVVR |
0.000 |
|
0.101 |
|
0.000 |
0.163 |
0.364 |
0.372 |
0.000 |
|
| 6 spectra, AVTIFIR |
0.000 |
|
0.090 |
|
0.000 |
0.157 |
0.367 |
0.386 |
0.000 |
|
| 2 spectra, LMGLEALK |
0.000 |
|
0.095 |
|
0.310 |
0.103 |
0.026 |
0.466 |
0.000 |
|
| 1 spectrum, LDVTSVEDYK |
0.000 |
|
0.000 |
|
0.039 |
0.405 |
0.151 |
0.405 |
0.000 |
|
| 2 spectra, MLVIEQCK |
0.000 |
|
0.142 |
|
0.016 |
0.181 |
0.236 |
0.425 |
0.000 |
|
| 7 spectra, IADGYEQAAR |
0.000 |
|
0.094 |
|
0.000 |
0.195 |
0.372 |
0.339 |
0.000 |
|
| 2 spectra, QQISLATQMVR |
0.017 |
|
0.239 |
|
0.000 |
0.243 |
0.213 |
0.288 |
0.000 |
|
| 3 spectra, GLHPIR |
0.000 |
|
0.203 |
|
0.000 |
0.182 |
0.311 |
0.304 |
0.000 |
|
| | | Plot |
|
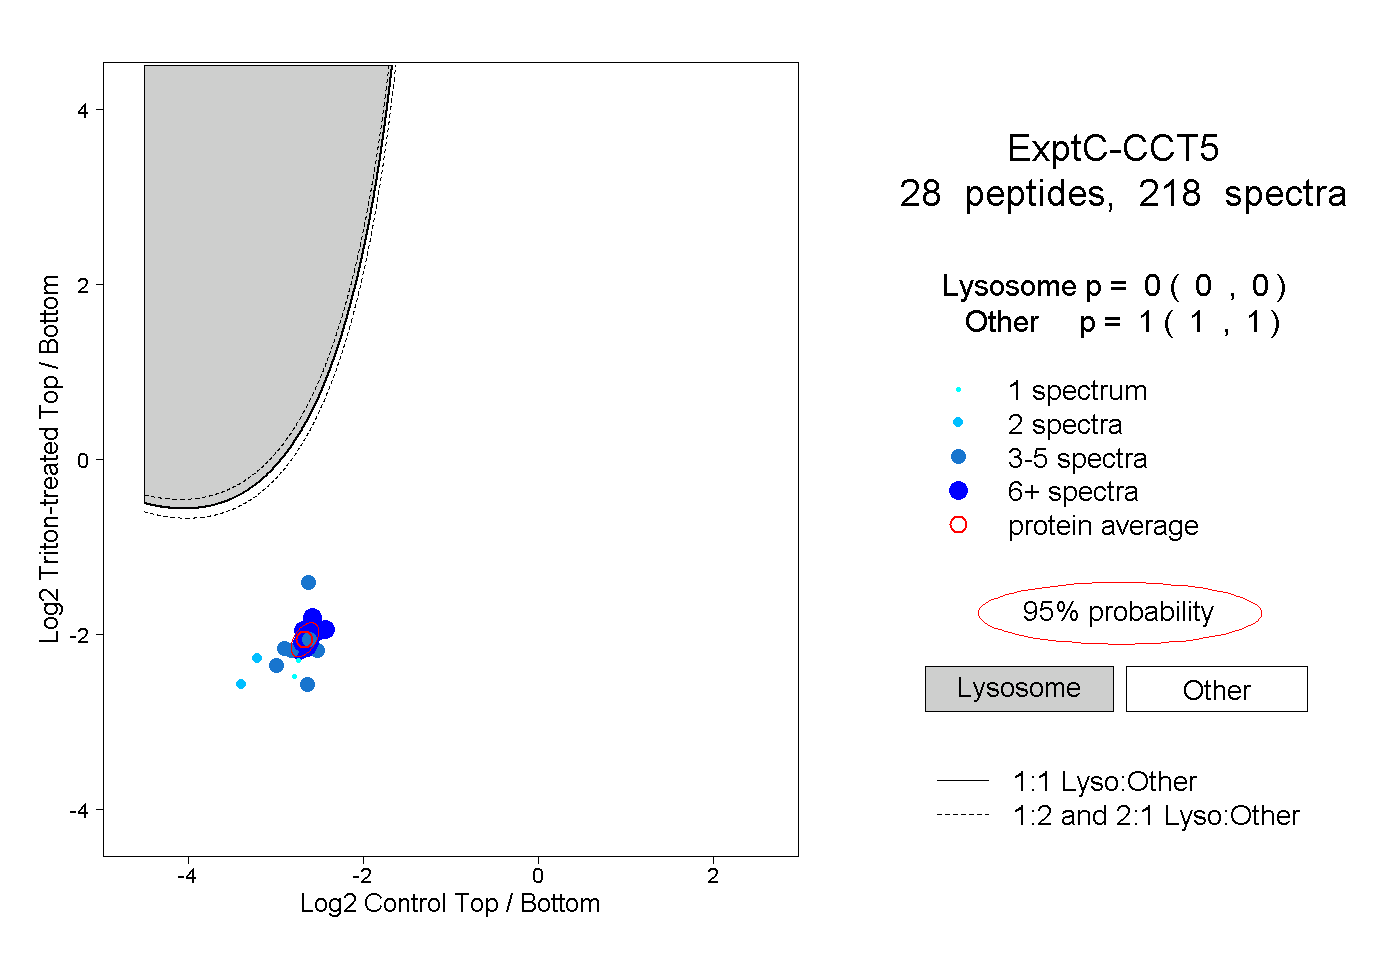
Lyso |
|
|
|
|
|
|
|
Other |
| Expt C |
28
peptides |
218
spectra |
 |
|
0.000
0.000 | 0.000 |
|
|
|
|
|
|
|
1.000
1.000 | 1.000 |
| | | Plot |
|
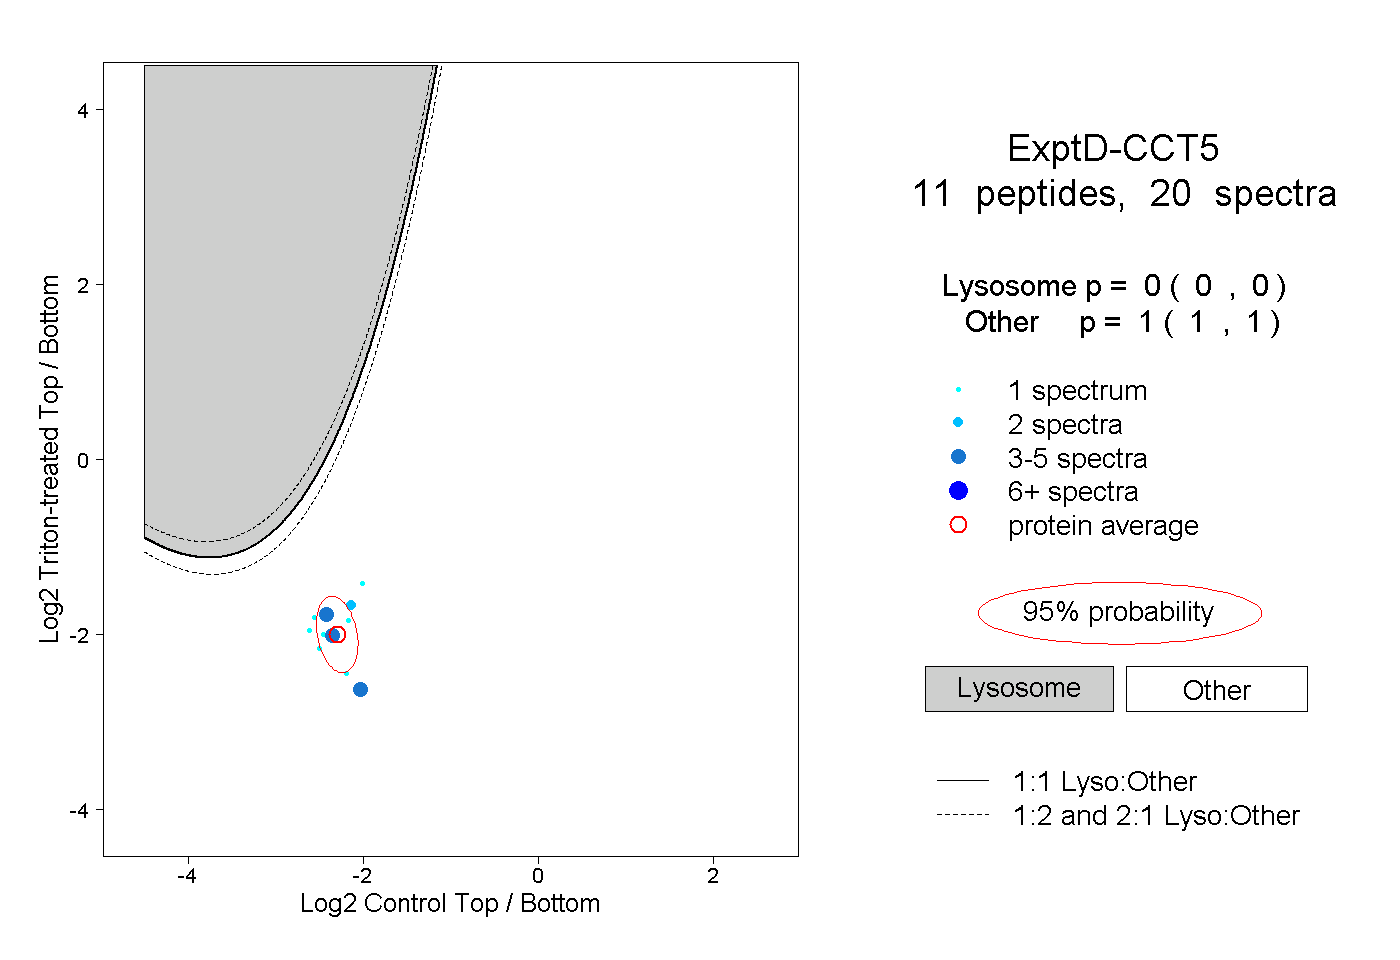
Lyso |
|
|
|
|
|
|
|
Other |
| Expt D |
11
peptides |
20
spectra |
 |
|
0.000
0.000 | 0.000 |
|
|
|
|
|
|
|
1.000
1.000 | 1.000 |