 11
11peptides
spectra
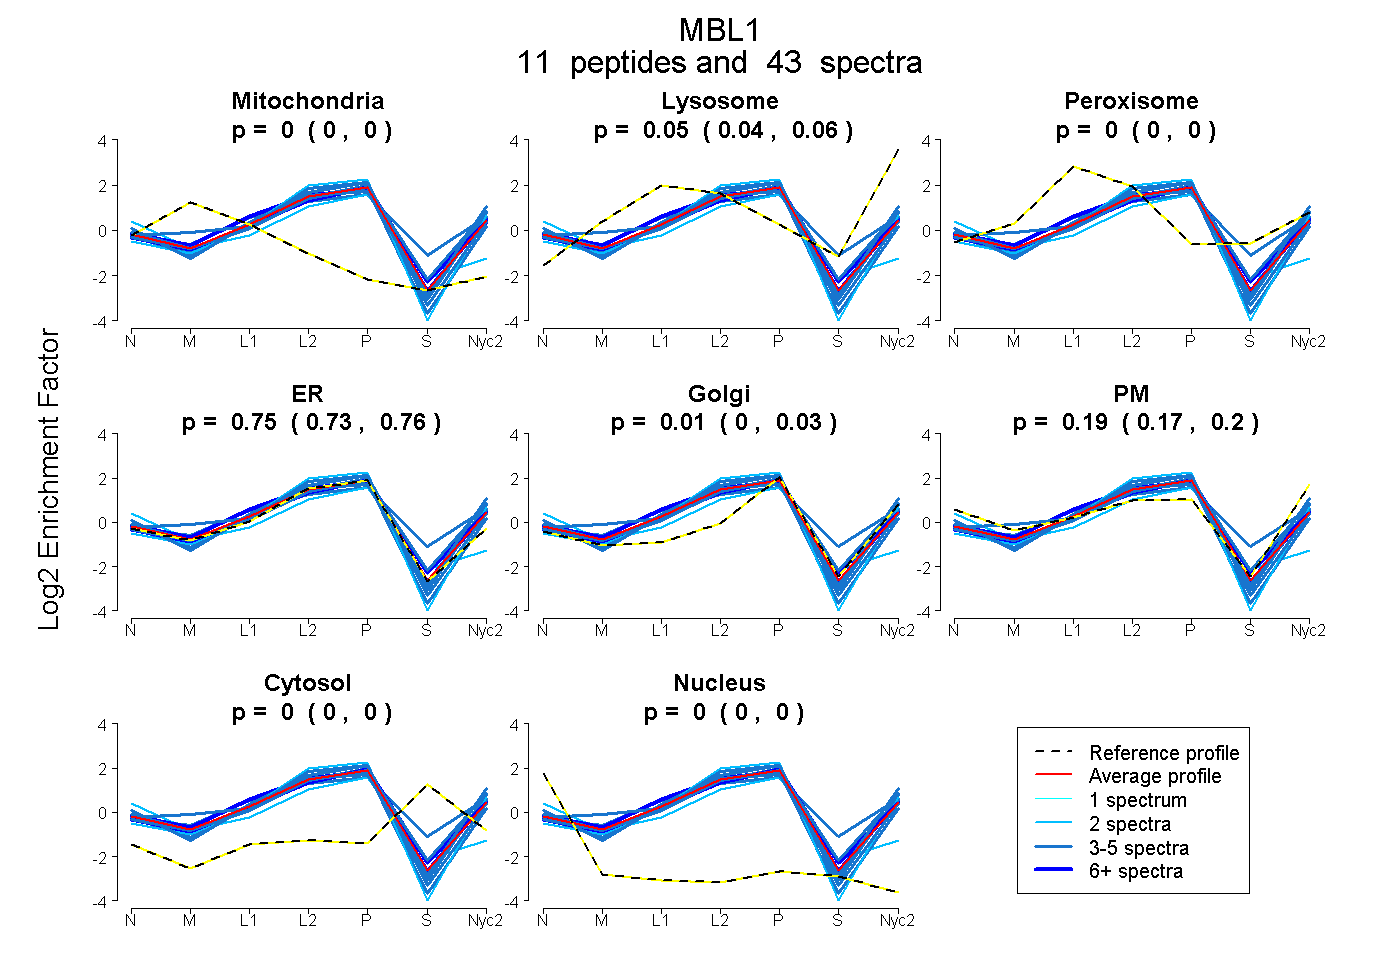
0.000 | 0.000
0.040 | 0.058
0.000 | 0.000
0.727 | 0.762
0.001 | 0.025
0.171 | 0.205
0.000 | 0.000
0.000 | 0.000
6peptides
spectra
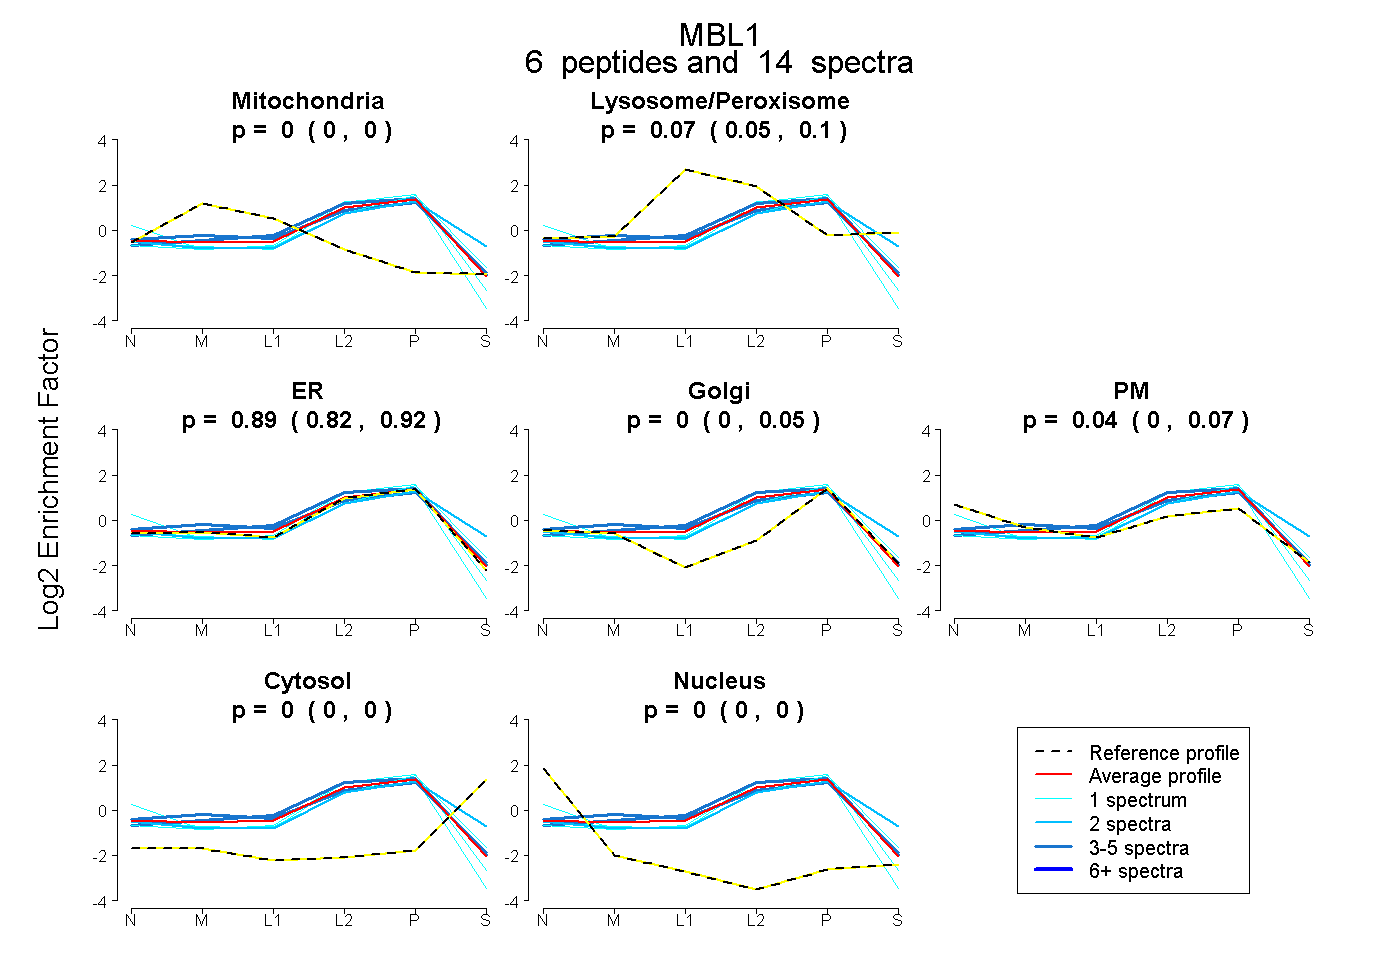
0.000 | 0.000
0.046 | 0.100
0.821 | 0.923
0.000 | 0.047
0.000 | 0.068
0.000 | 0.000
0.000 | 0.000
11peptides
spectra
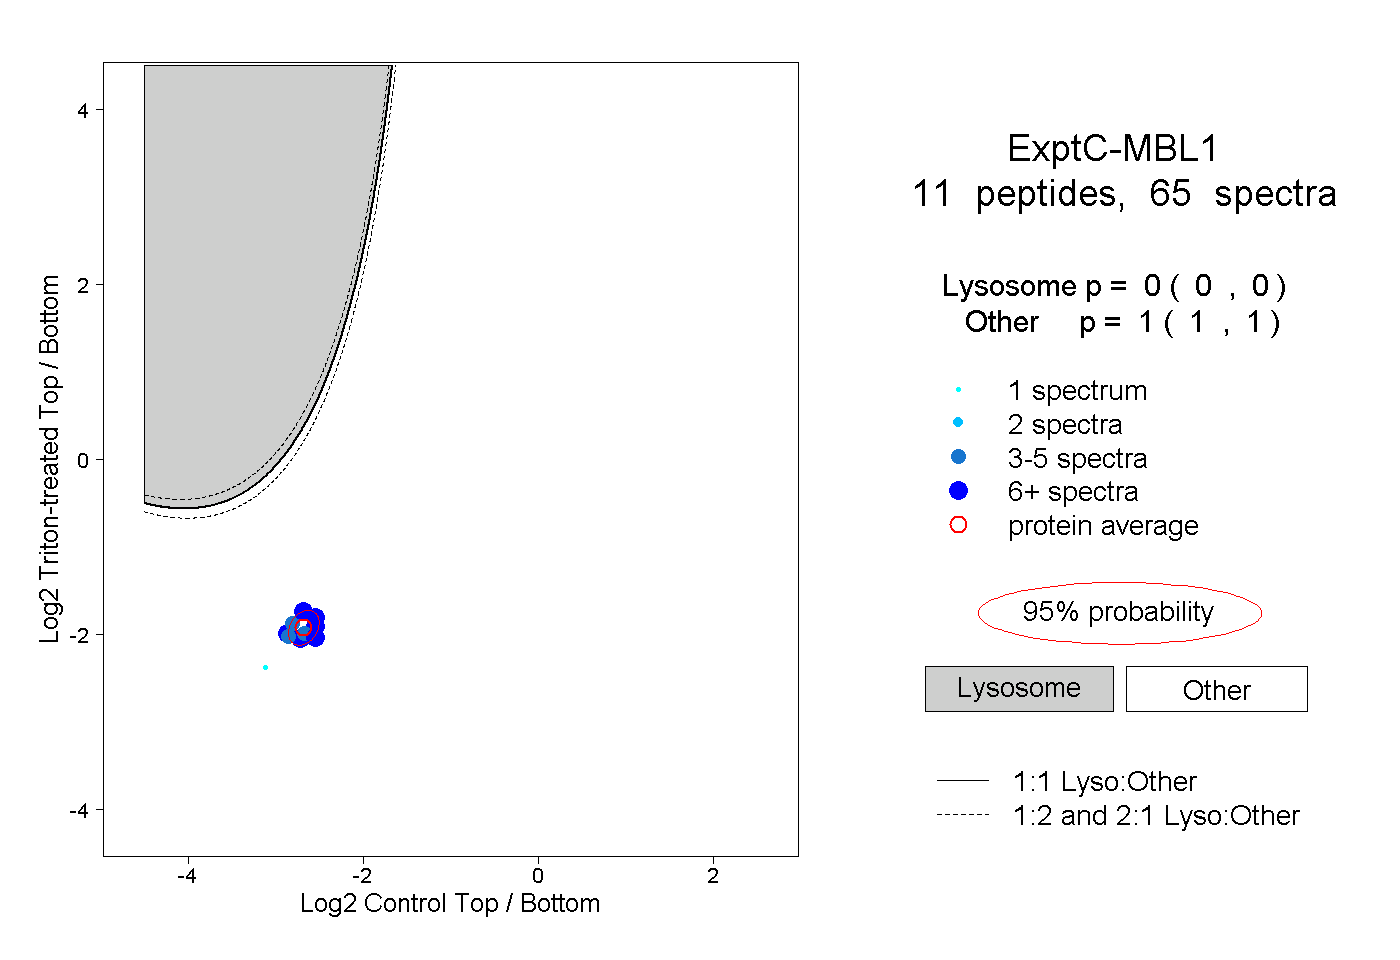
0.000 | 0.000
1.000 | 1.000
4peptides
spectra
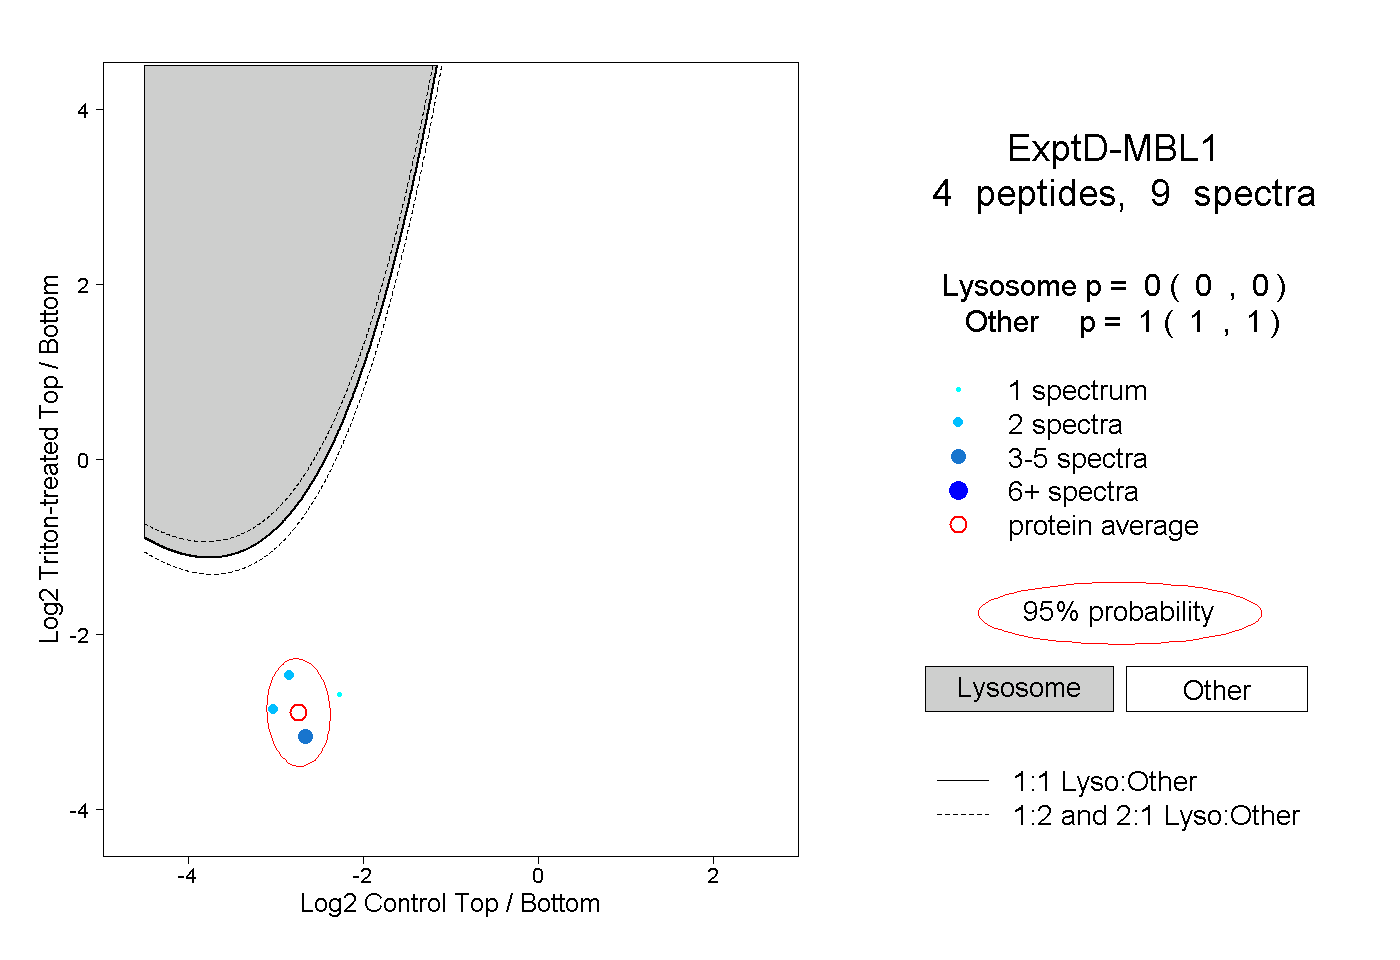
0.000 | 0.000
1.000 | 1.000