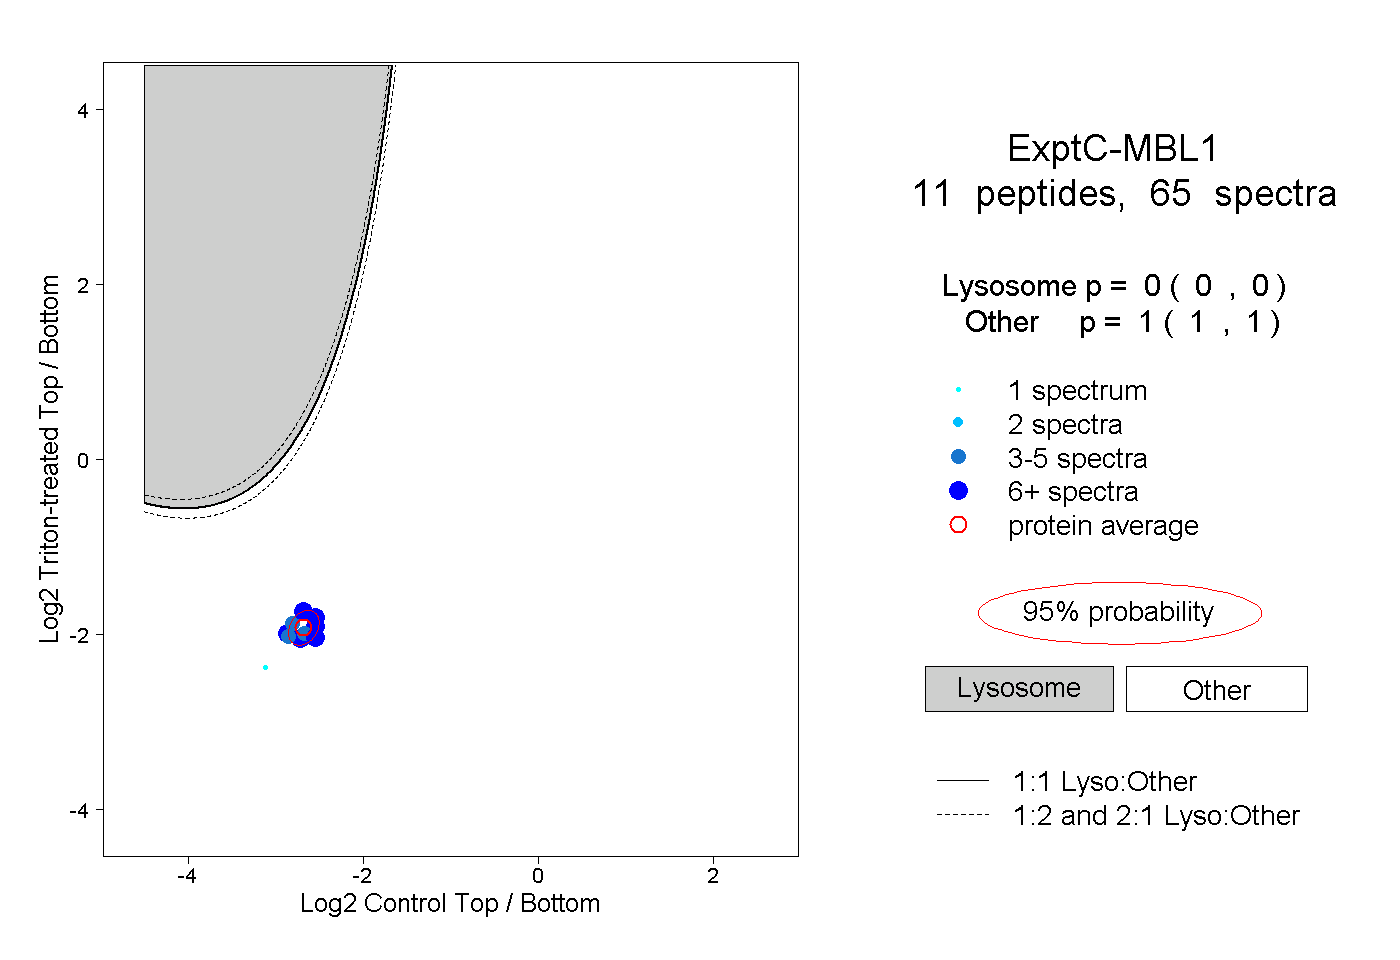
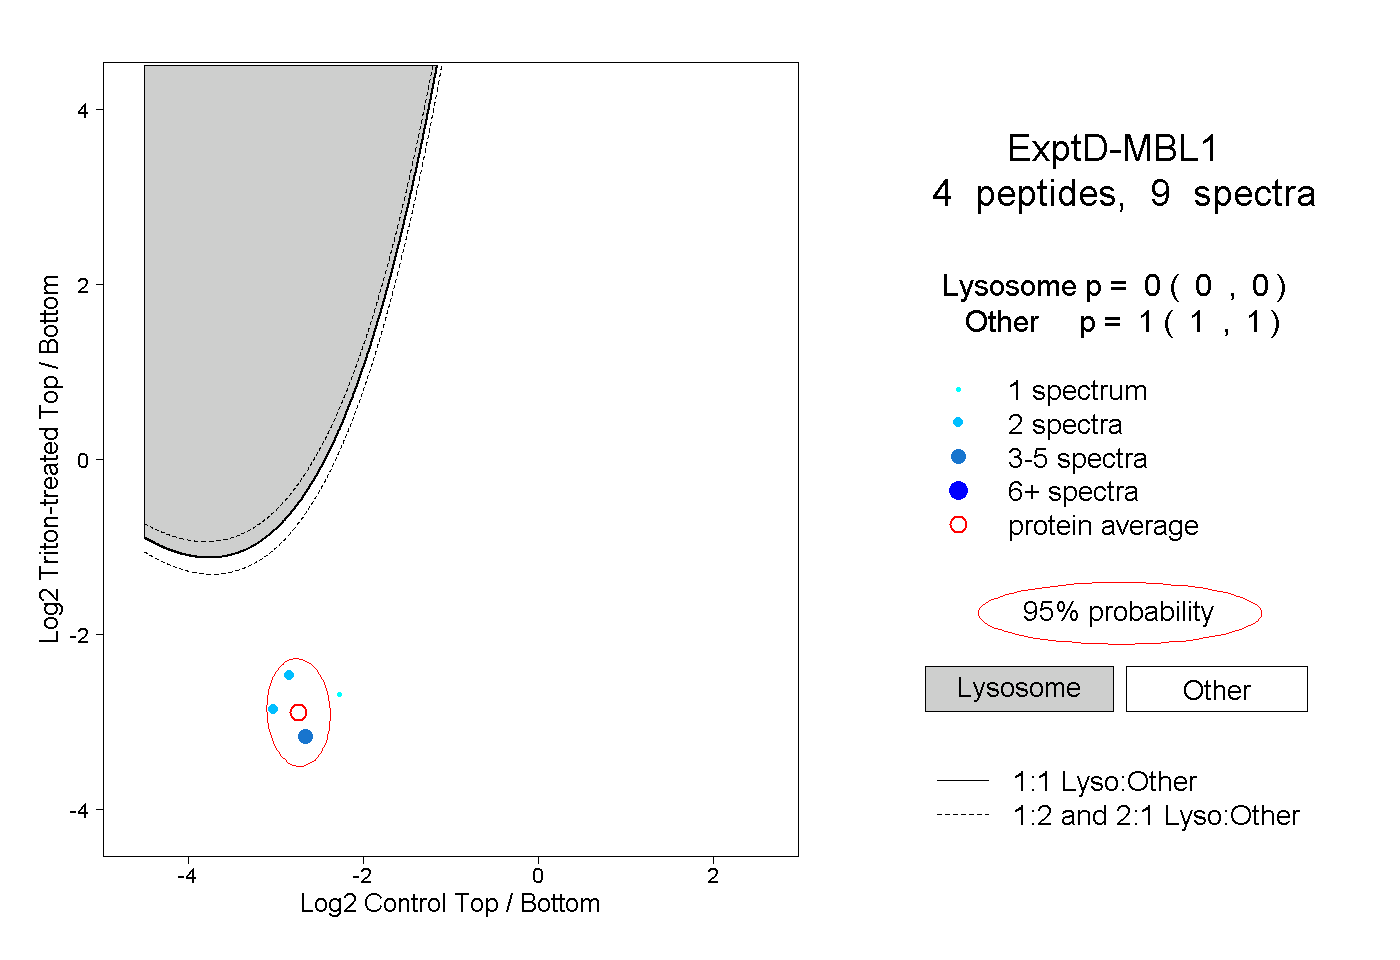
MBL1
[ENSRNOP00000015723]
Main page
| | | Plot |
Mito |
Lyso |
|
Perox |
ER |
Golgi |
PM |
Cytosol |
Nucleus |
|
| Expt A |
 11
11
peptides |
43
spectra |
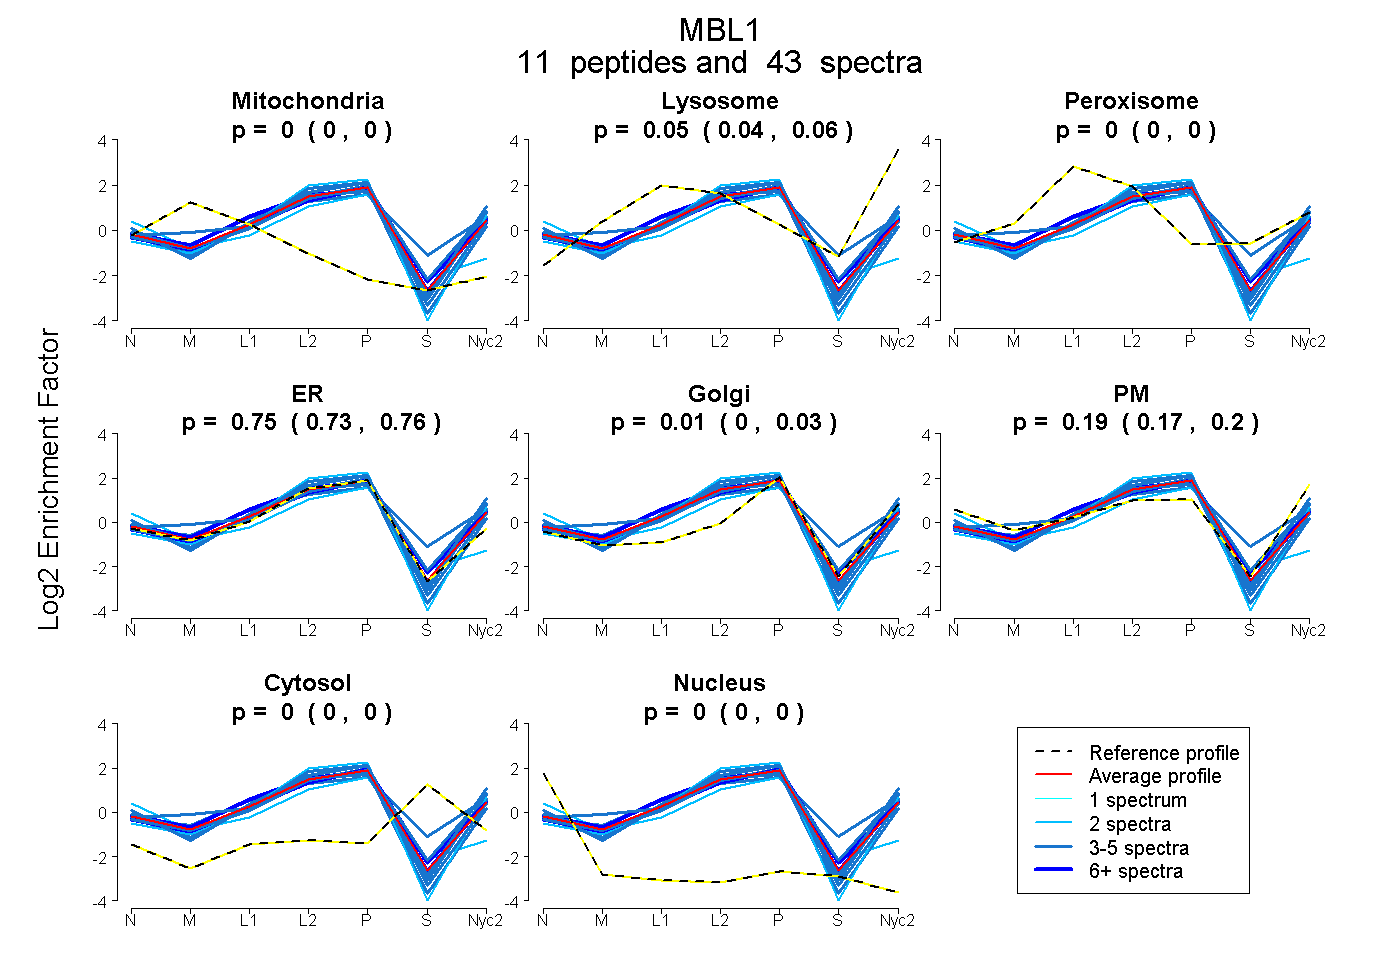 |
0.000
0.000 | 0.000 |
0.050
0.040 | 0.058 |
|
0.000
0.000 | 0.000 |
0.746
0.727 | 0.762 |
0.014
0.001 | 0.025 |
0.190
0.171 | 0.205 |
0.000
0.000 | 0.000 |
0.000
0.000 | 0.000 |
|
| | | Plot |
Mito |
|
Lyso or Perox |
|
ER |
Golgi |
PM |
Cytosol |
Nucleus |
|
| Expt B |
6
peptides |
14
spectra |
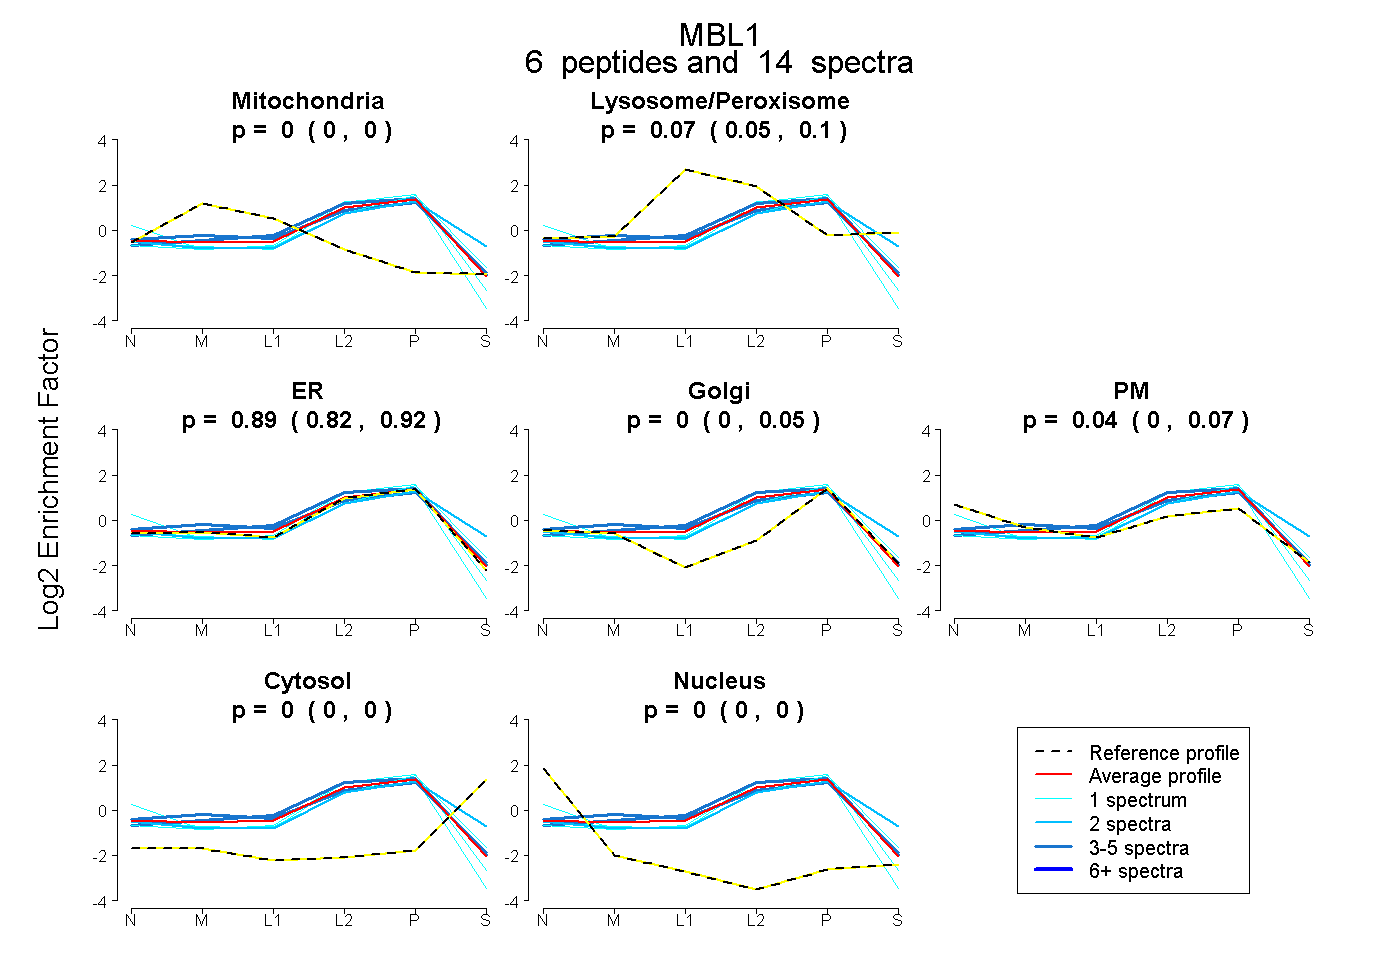 |
0.000
0.000 | 0.000 |
|
0.068
0.046 | 0.100 |
|
0.890
0.821 | 0.923 |
0.000
0.000 | 0.047 |
0.042
0.000 | 0.068 |
0.000
0.000 | 0.000 |
0.000
0.000 | 0.000 |
|
| 5 spectra, GTVAIPR |
0.023 |
|
0.120 |
|
0.732 |
0.060 |
0.064 |
0.000 |
0.000 |
|
| 4 spectra, FFVTNHER |
0.000 |
|
0.123 |
|
0.877 |
0.000 |
0.000 |
0.000 |
0.000 |
|
| 1 spectrum, AIQEVAK |
0.000 |
|
0.000 |
|
1.000 |
0.000 |
0.000 |
0.000 |
0.000 |
|
| 2 spectra, NAEENK |
0.000 |
|
0.153 |
|
0.586 |
0.125 |
0.000 |
0.135 |
0.000 |
|
| 1 spectrum, LANMEAEINTLK |
0.000 |
|
0.061 |
|
0.796 |
0.104 |
0.000 |
0.039 |
0.000 |
|
| 1 spectrum, ALCSELR |
0.000 |
|
0.000 |
|
0.919 |
0.000 |
0.075 |
0.000 |
0.006 |
|
| | | Plot |
|
Lyso |
|
|
|
|
|
|
|
Other |
| Expt C |
11
peptides |
65
spectra |
 |
|
0.000
0.000 | 0.000 |
|
|
|
|
|
|
|
1.000
1.000 | 1.000 |
| | | Plot |
|
Lyso |
|
|
|
|
|
|
|
Other |
| Expt D |
4
peptides |
9
spectra |
 |
|
0.000
0.000 | 0.000 |
|
|
|
|
|
|
|
1.000
1.000 | 1.000 |