 11
11peptides
spectra
0.000 | 0.000
0.040 | 0.058
0.000 | 0.000
0.727 | 0.762
0.001 | 0.025
0.171 | 0.205
0.000 | 0.000
0.000 | 0.000
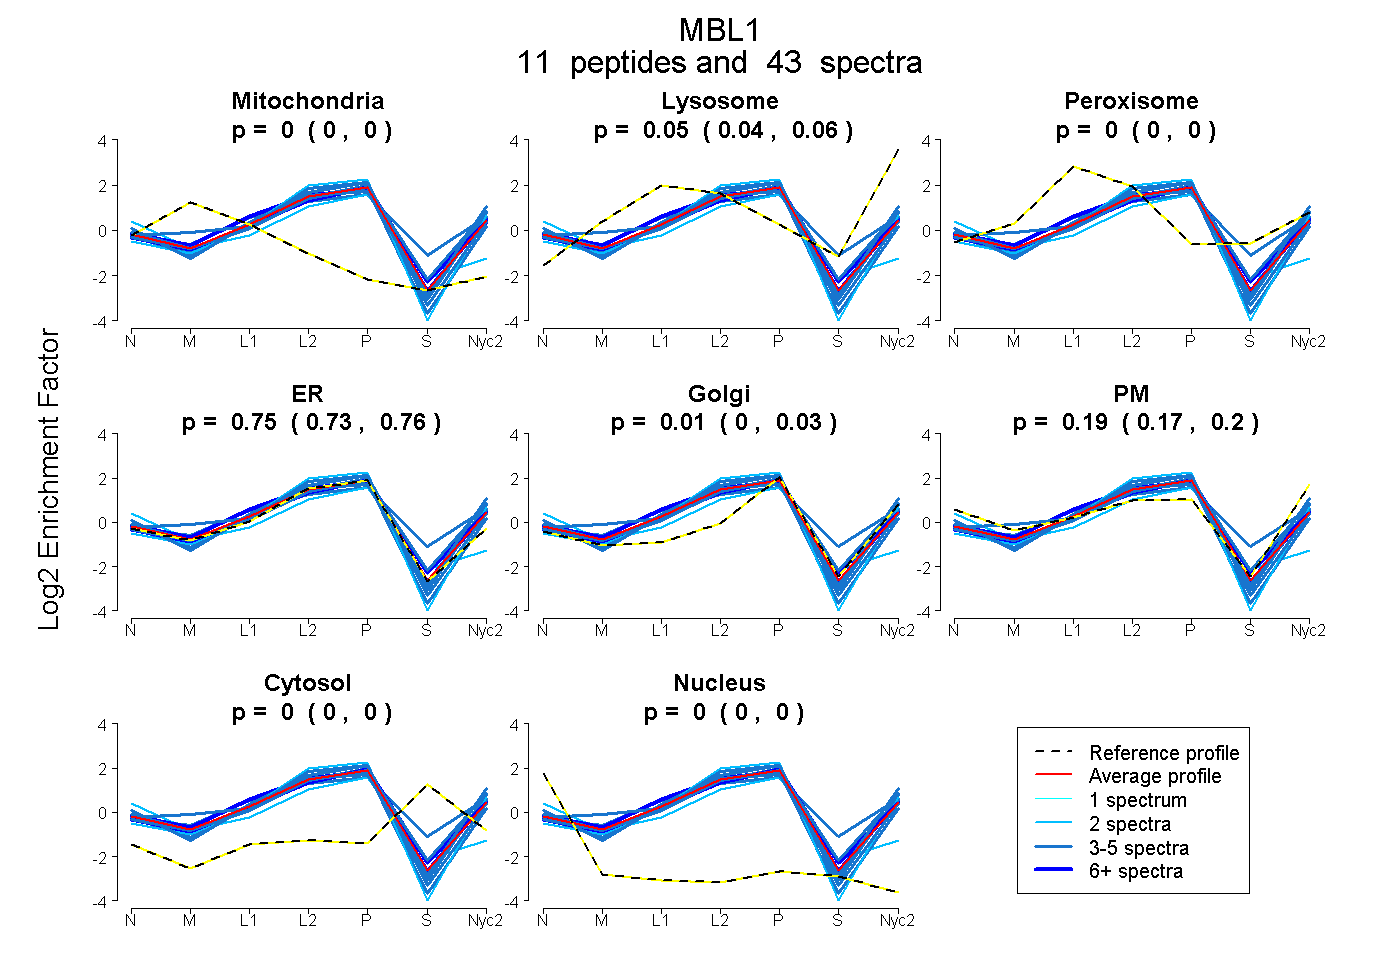
| Plot | Mito | Lyso | Perox | ER | Golgi | PM | Cytosol | Nucleus | |||||
| Expt A |
11 peptides |
43 spectra |
|
0.000 0.000 | 0.000 |
0.050 0.040 | 0.058 |
0.000 0.000 | 0.000 |
0.746 0.727 | 0.762 |
0.014 0.001 | 0.025 |
0.190 0.171 | 0.205 |
0.000 0.000 | 0.000 |
0.000 0.000 | 0.000 |
| 7 spectra, LHAFSMGK | 0.000 | 0.100 | 0.010 | 0.713 | 0.154 | 0.023 | 0.000 | 0.000 | ||
| 4 spectra, GLQGPPGK | 0.022 | 0.000 | 0.000 | 0.800 | 0.000 | 0.178 | 0.000 | 0.000 | ||
| 3 spectra, LTYSNWK | 0.000 | 0.092 | 0.000 | 0.536 | 0.137 | 0.236 | 0.000 | 0.000 | ||
| 2 spectra, LANMEAEINTLK | 0.000 | 0.004 | 0.000 | 0.866 | 0.000 | 0.130 | 0.000 | 0.000 | ||
| 4 spectra, GEPGQGLR | 0.000 | 0.106 | 0.000 | 0.677 | 0.140 | 0.078 | 0.000 | 0.000 | ||
| 2 spectra, ALCSELR | 0.000 | 0.000 | 0.024 | 0.844 | 0.000 | 0.000 | 0.000 | 0.132 | ||
| 4 spectra, AIQEVAK | 0.000 | 0.078 | 0.250 | 0.363 | 0.261 | 0.000 | 0.047 | 0.000 | ||
| 8 spectra, FFVTNHER | 0.000 | 0.098 | 0.000 | 0.726 | 0.000 | 0.175 | 0.000 | 0.000 | ||
| 3 spectra, GTVAIPR | 0.000 | 0.049 | 0.000 | 0.730 | 0.000 | 0.220 | 0.000 | 0.000 | ||
| 3 spectra, TCSVIACGR | 0.000 | 0.017 | 0.000 | 0.874 | 0.000 | 0.109 | 0.000 | 0.000 | ||
| 3 spectra, NAEENK | 0.000 | 0.015 | 0.000 | 0.522 | 0.000 | 0.463 | 0.000 | 0.000 |
| Plot | Mito | Lyso or Perox | ER | Golgi | PM | Cytosol | Nucleus | ||||||
| Expt B |
6 peptides |
14 spectra |
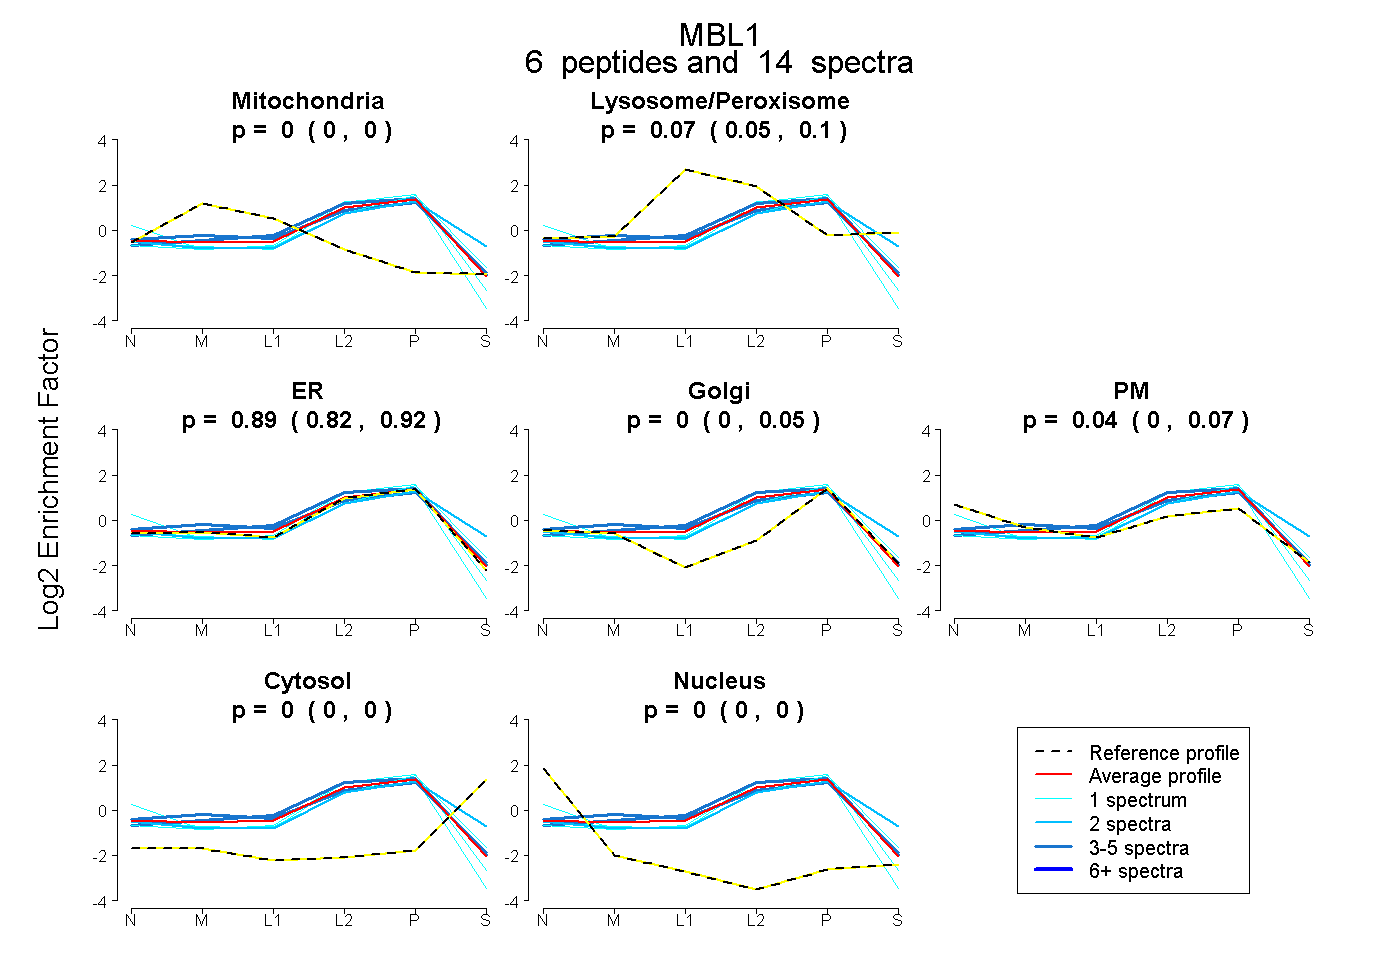 |
0.000 0.000 | 0.000 |
0.068 0.046 | 0.100 |
0.890 0.821 | 0.923 |
0.000 0.000 | 0.047 |
0.042 0.000 | 0.068 |
0.000 0.000 | 0.000 |
0.000 0.000 | 0.000 |
|||
| Plot | Lyso | Other | |||||||||||
| Expt C |
11 peptides |
65 spectra |
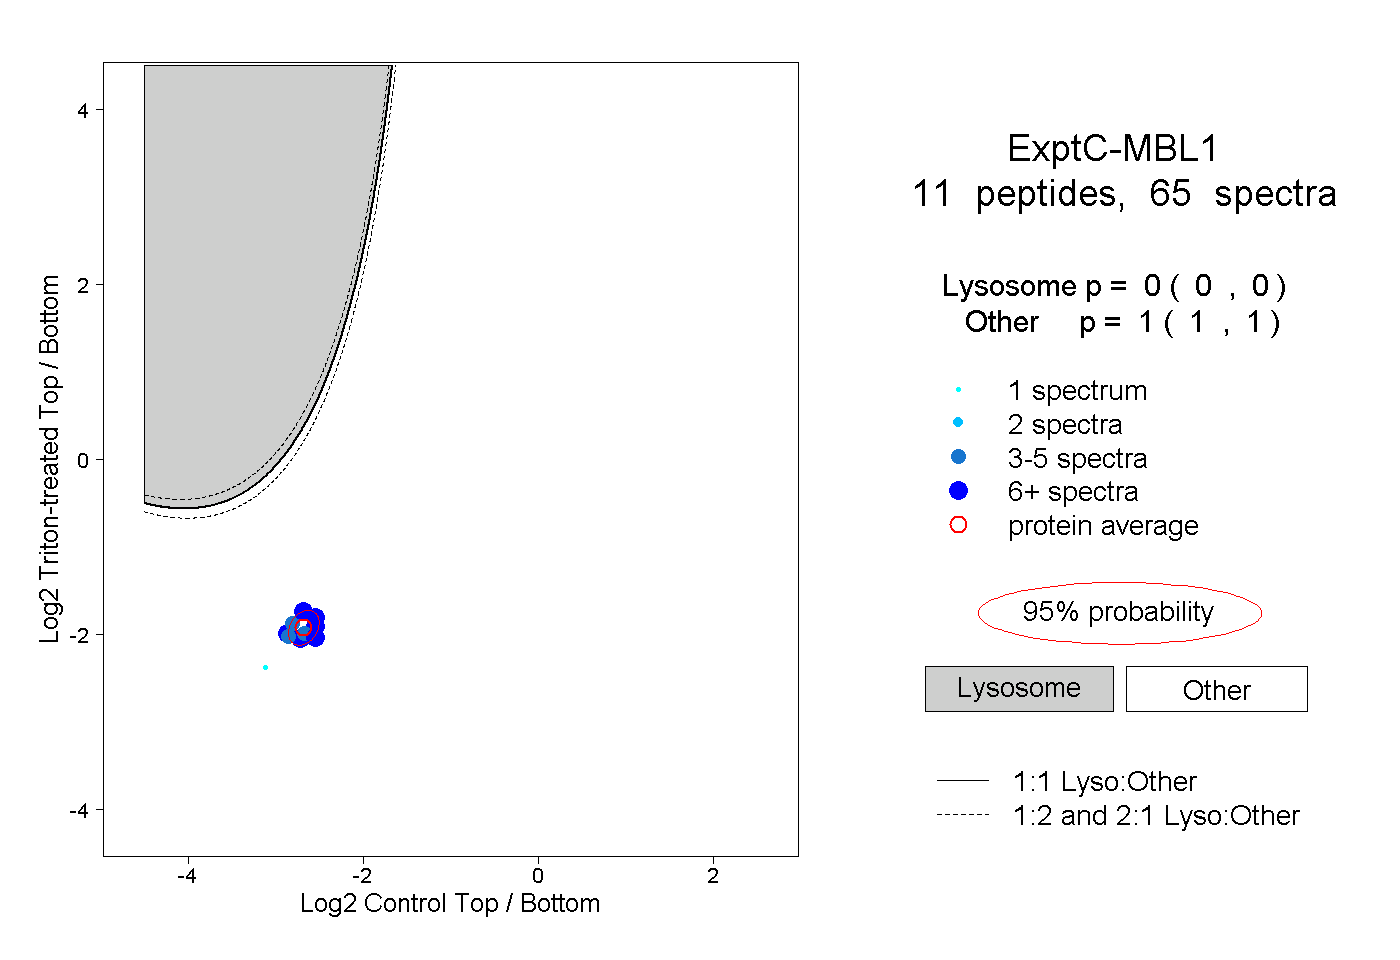 |
0.000 0.000 | 0.000 |
1.000 1.000 | 1.000 |
||||||||
| Plot | Lyso | Other | |||||||||||
| Expt D |
4 peptides |
9 spectra |
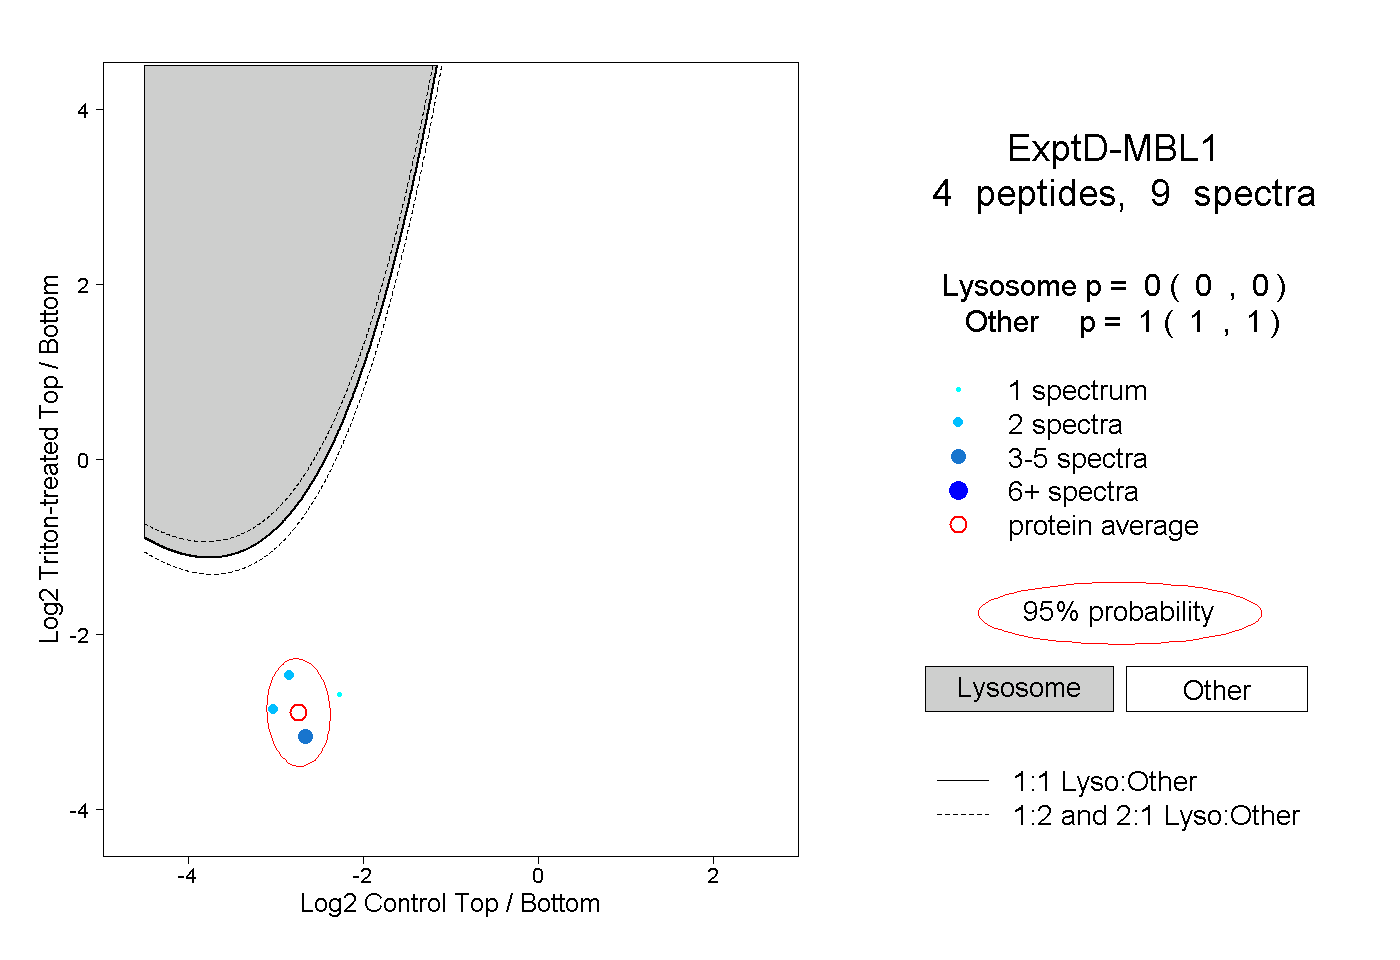 |
0.000 0.000 | 0.000 |
1.000 1.000 | 1.000 |