 10
10peptides
spectra
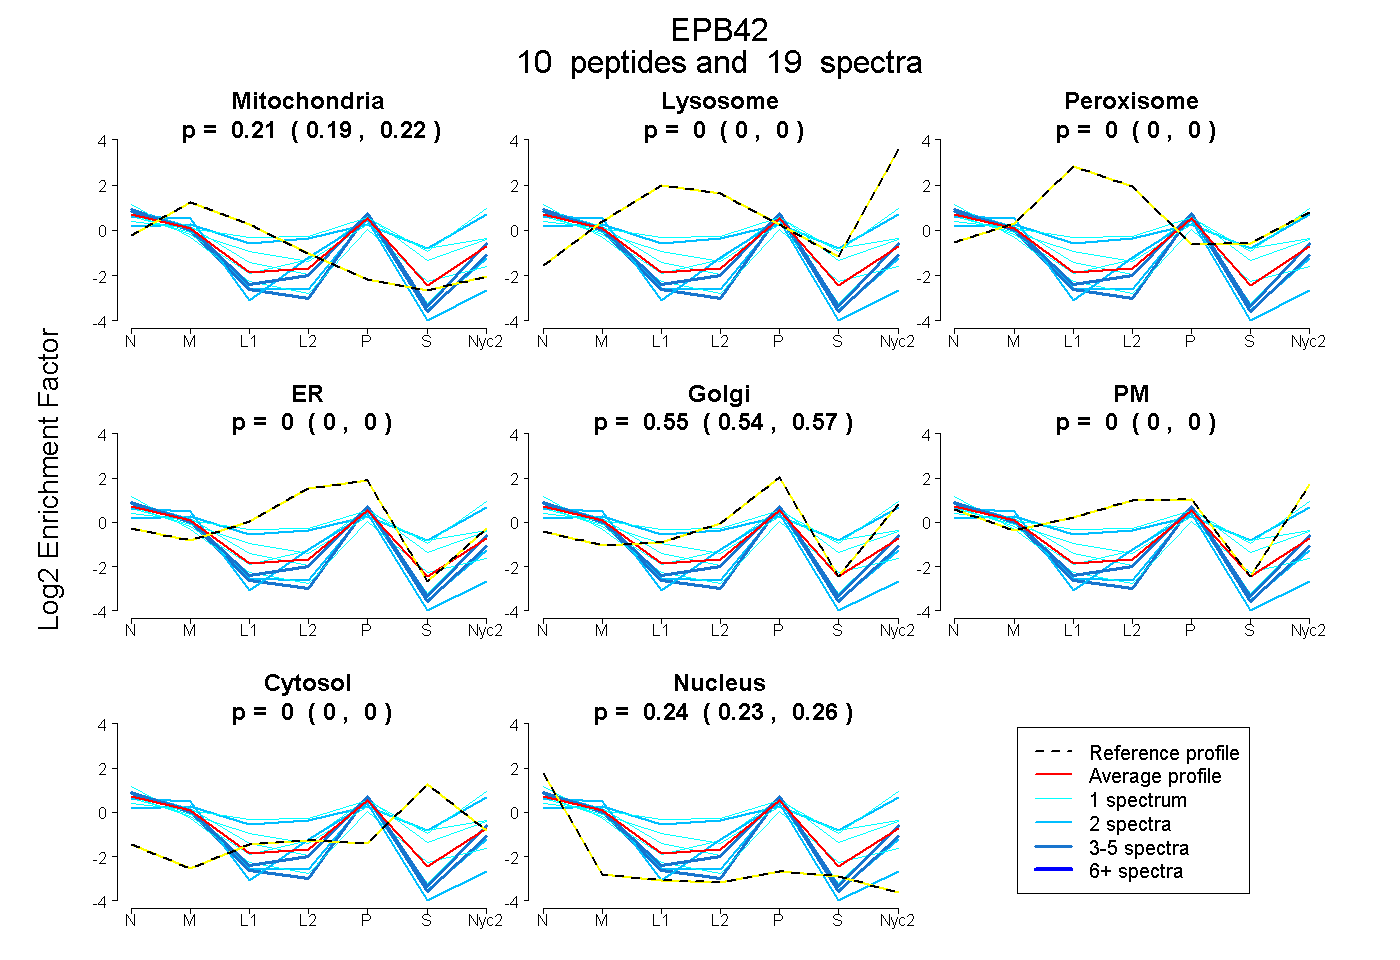
0.188 | 0.219
0.000 | 0.000
0.000 | 0.000
0.000 | 0.000
0.538 | 0.567
0.000 | 0.000
0.000 | 0.000
0.226 | 0.256
3peptides
spectra
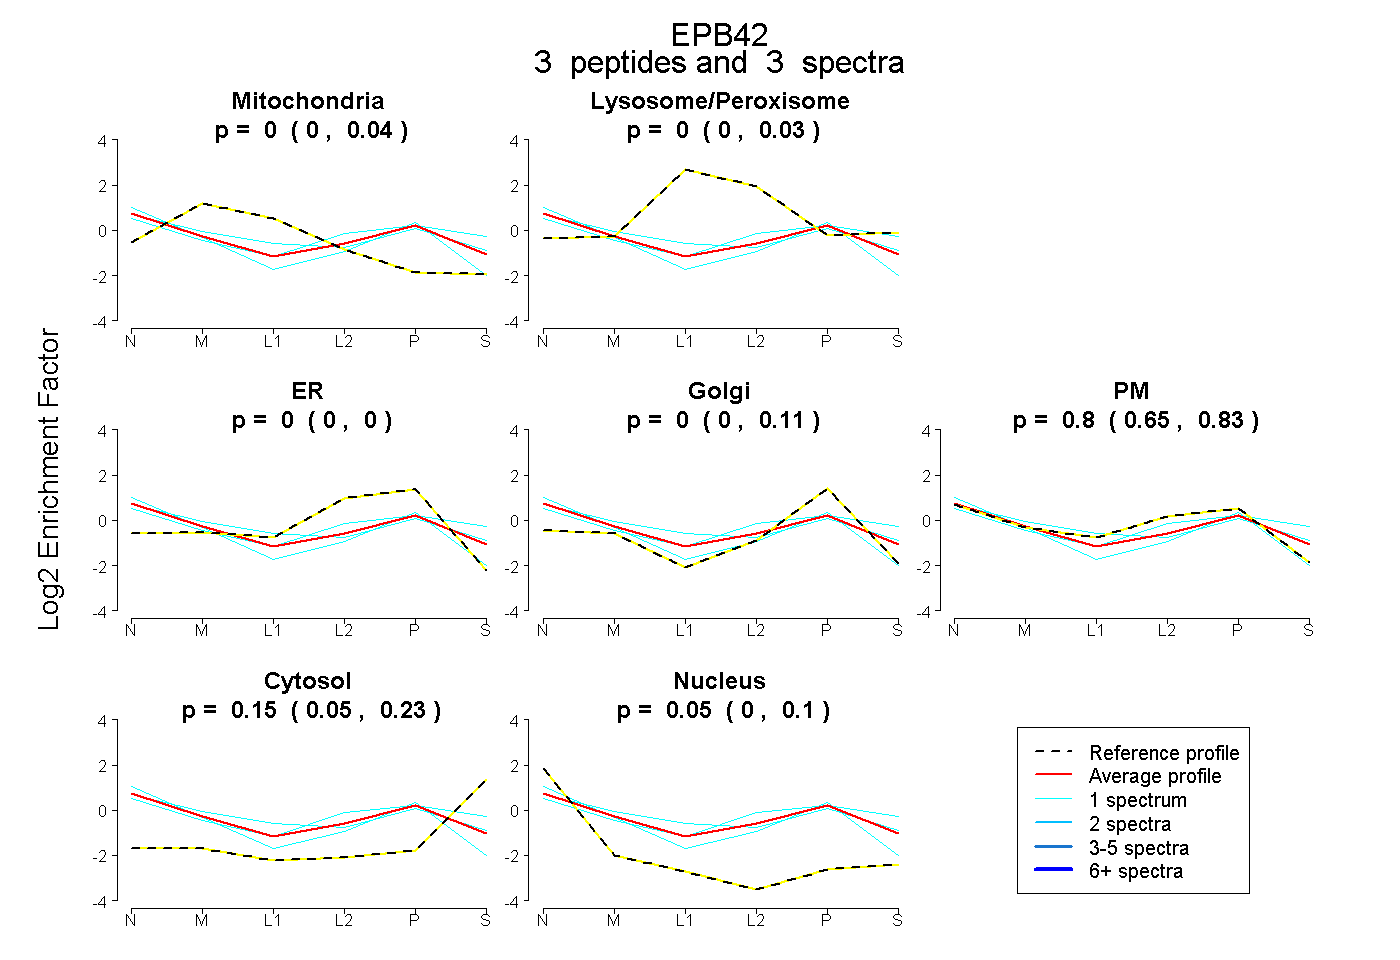
0.000 | 0.042
0.000 | 0.035
0.000 | 0.000
0.000 | 0.115
0.645 | 0.827
0.048 | 0.228
0.000 | 0.105
2peptides
spectra
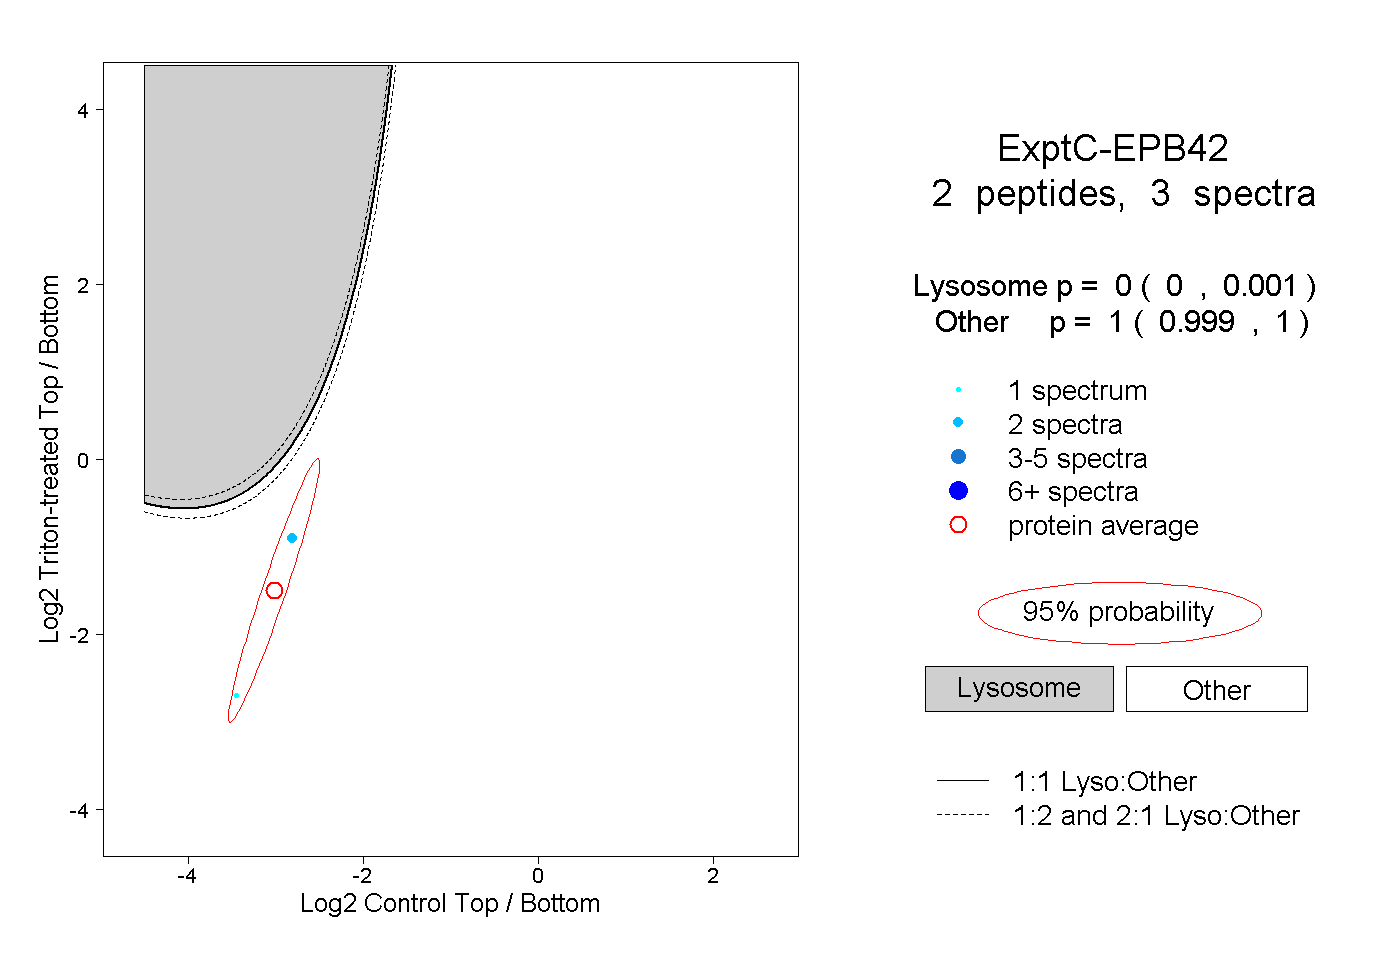
0.000 | 0.001
0.999 | 1.000