EPB42
[ENSRNOP00000015556]
Main page
| | | Plot |
Mito |
Lyso |
|
Perox |
ER |
Golgi |
PM |
Cytosol |
Nucleus |
|
| Expt A |
 10
10
peptides |
19
spectra |
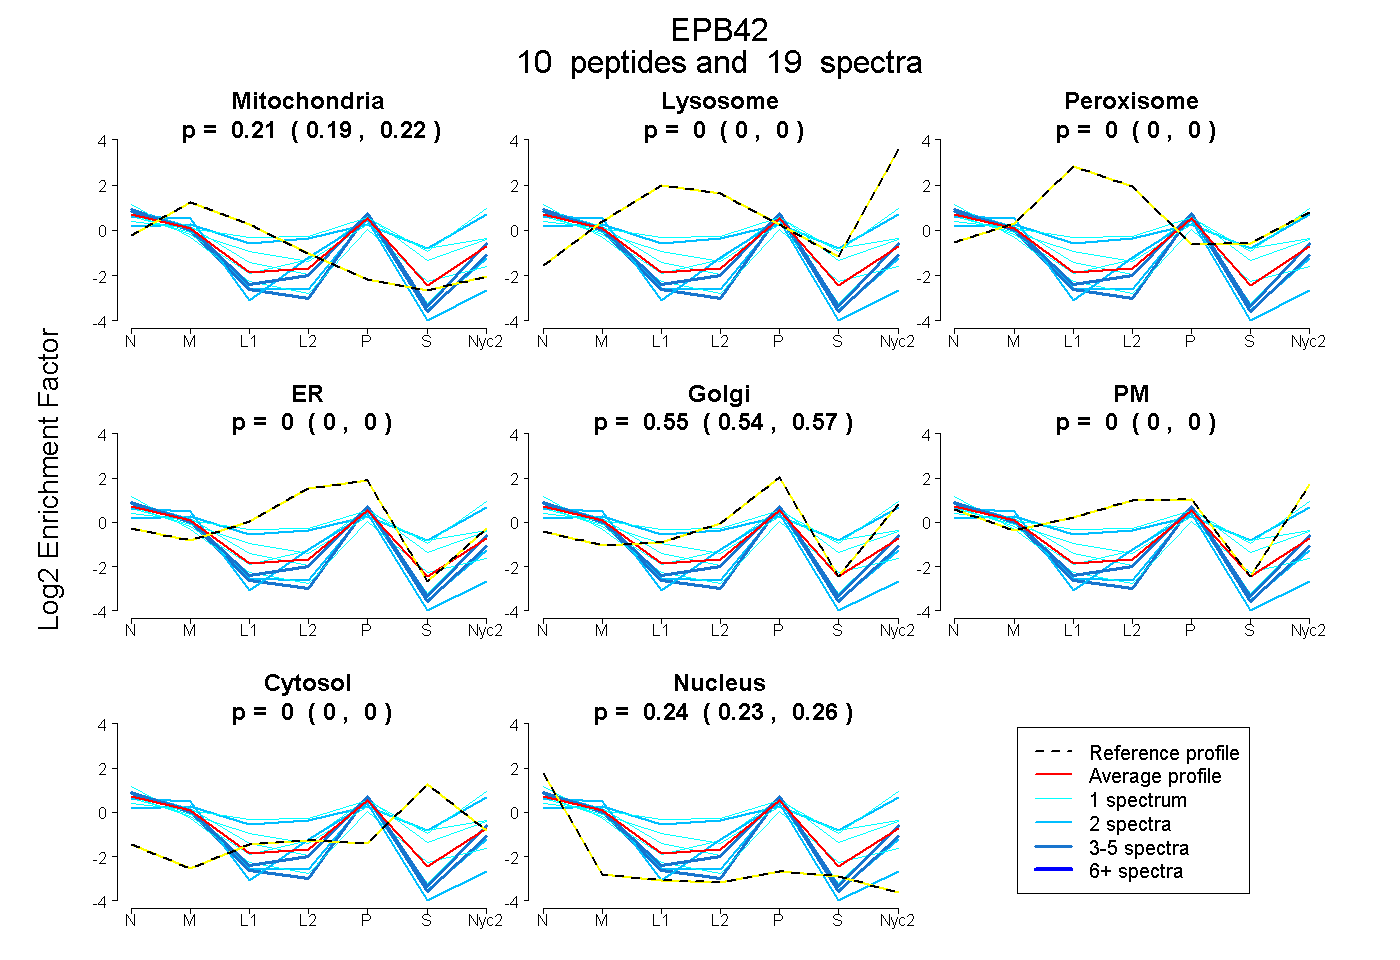 |
0.205
0.188 | 0.219 |
0.000
0.000 | 0.000 |
|
0.000
0.000 | 0.000 |
0.000
0.000 | 0.000 |
0.553
0.538 | 0.567 |
0.000
0.000 | 0.000 |
0.000
0.000 | 0.000 |
0.242
0.226 | 0.256 |
|
| | | Plot |
Mito |
|
Lyso or Perox |
|
ER |
Golgi |
PM |
Cytosol |
Nucleus |
|
| Expt B |
3
peptides |
3
spectra |
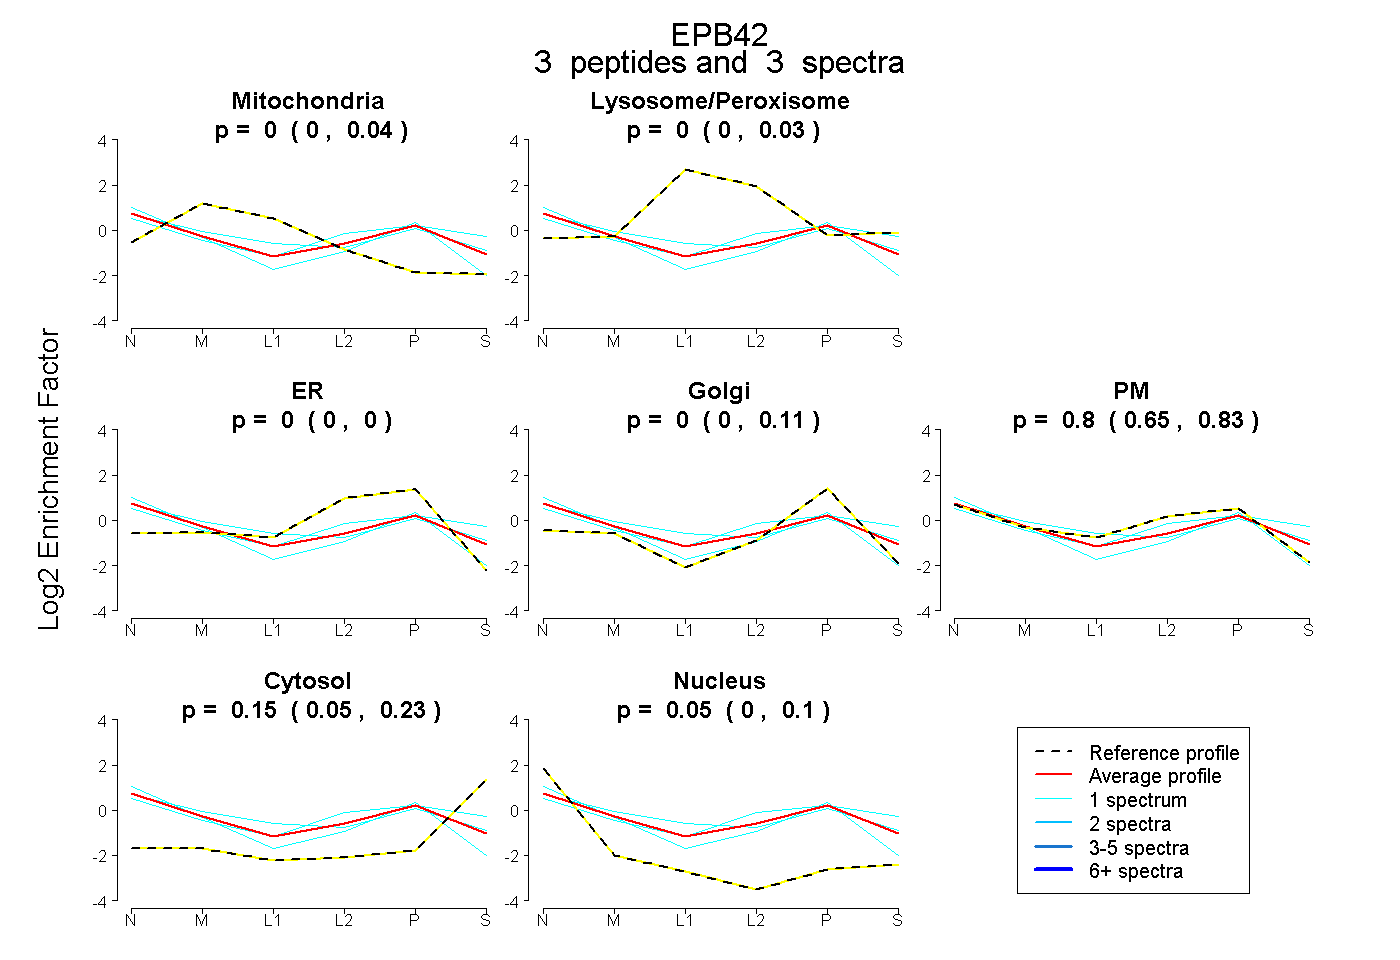 |
0.000
0.000 | 0.042 |
|
0.000
0.000 | 0.035 |
|
0.000
0.000 | 0.000 |
0.000
0.000 | 0.115 |
0.797
0.645 | 0.827 |
0.153
0.048 | 0.228 |
0.050
0.000 | 0.105 |
|
| 1 spectrum, APAHIFLSALK |
0.090 |
|
0.062 |
|
0.000 |
0.000 |
0.659 |
0.139 |
0.050 |
|
| 1 spectrum, DDAVFLQNEVQR |
0.000 |
|
0.060 |
|
0.000 |
0.000 |
0.689 |
0.251 |
0.000 |
|
| 1 spectrum, GSVPILR |
0.000 |
|
0.000 |
|
0.000 |
0.252 |
0.552 |
0.000 |
0.196 |
|
| | | Plot |
|
Lyso |
|
|
|
|
|
|
|
Other |
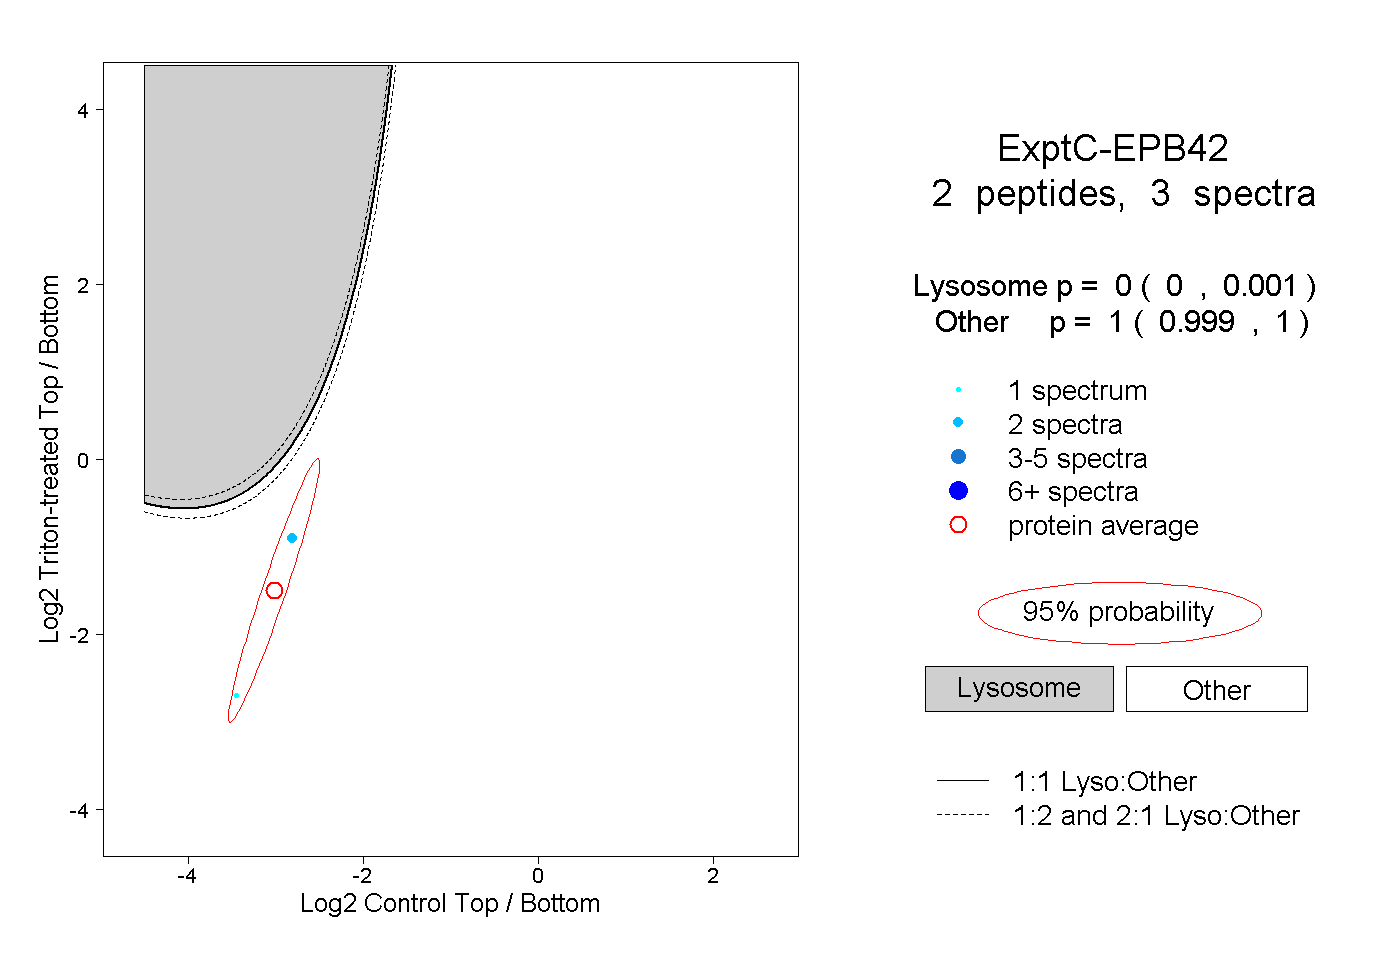
| Expt C |
2
peptides |
3
spectra |
 |
|
0.000
0.000 | 0.001 |
|
|
|
|
|
|
|
1.000
0.999 | 1.000 |