 10
10peptides
spectra
0.188 | 0.219
0.000 | 0.000
0.000 | 0.000
0.000 | 0.000
0.538 | 0.567
0.000 | 0.000
0.000 | 0.000
0.226 | 0.256
| Plot | Mito | Lyso | Perox | ER | Golgi | PM | Cytosol | Nucleus | |||||
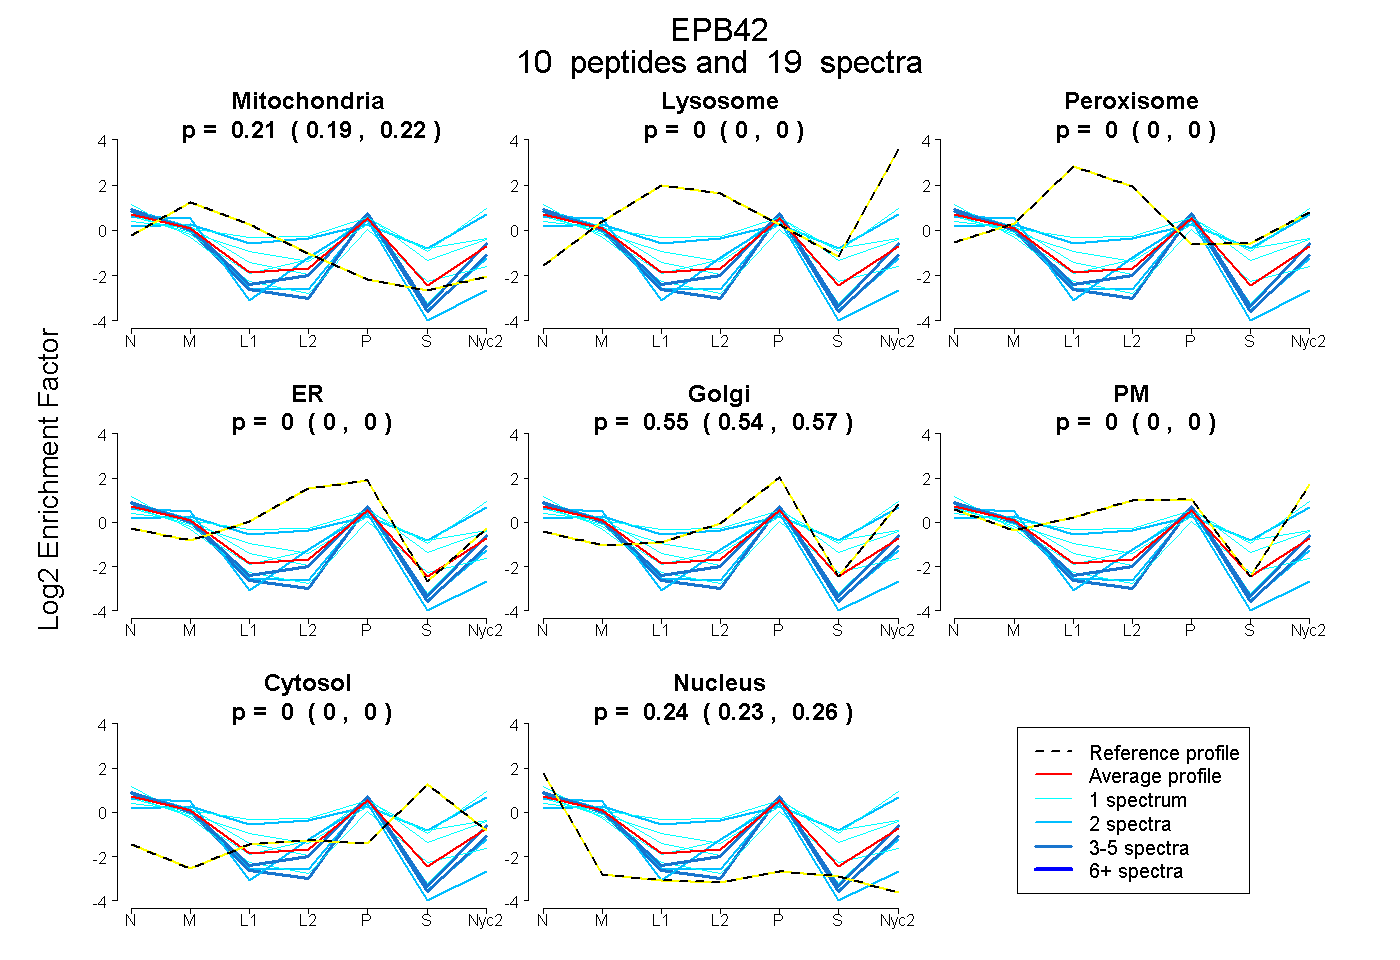
| Expt A |
10 peptides |
19 spectra |
|
0.205 0.188 | 0.219 |
0.000 0.000 | 0.000 |
0.000 0.000 | 0.000 |
0.000 0.000 | 0.000 |
0.553 0.538 | 0.567 |
0.000 0.000 | 0.000 |
0.000 0.000 | 0.000 |
0.242 0.226 | 0.256 |
| 2 spectra, APAHIFLSALK | 0.124 | 0.000 | 0.000 | 0.000 | 0.483 | 0.000 | 0.000 | 0.393 | ||
| 1 spectrum, VALIAQTGEQPSK | 0.102 | 0.026 | 0.000 | 0.000 | 0.024 | 0.623 | 0.225 | 0.000 | ||
| 1 spectrum, DVMDLSLNLLSVDK | 0.128 | 0.000 | 0.000 | 0.000 | 0.568 | 0.013 | 0.105 | 0.186 | ||
| 4 spectra, ATQYQPLTASVR | 0.071 | 0.000 | 0.000 | 0.000 | 0.506 | 0.000 | 0.000 | 0.422 | ||
| 1 spectrum, NVGNSISTK | 0.247 | 0.000 | 0.000 | 0.000 | 0.541 | 0.000 | 0.000 | 0.212 | ||
| 1 spectrum, LELTNSNR | 0.222 | 0.000 | 0.000 | 0.000 | 0.298 | 0.161 | 0.236 | 0.083 | ||
| 2 spectra, QFLMLGPNQVLR | 0.210 | 0.000 | 0.000 | 0.157 | 0.231 | 0.000 | 0.000 | 0.402 | ||
| 1 spectrum, GWSAAVVER | 0.145 | 0.000 | 0.000 | 0.000 | 0.397 | 0.000 | 0.000 | 0.458 | ||
| 2 spectra, DDAVFLQNEVQR | 0.164 | 0.044 | 0.000 | 0.000 | 0.065 | 0.476 | 0.250 | 0.000 | ||
| 4 spectra, QWLTGR | 0.110 | 0.000 | 0.000 | 0.000 | 0.585 | 0.000 | 0.000 | 0.305 |
| Plot | Mito | Lyso or Perox | ER | Golgi | PM | Cytosol | Nucleus | ||||||
| Expt B |
3 peptides |
3 spectra |
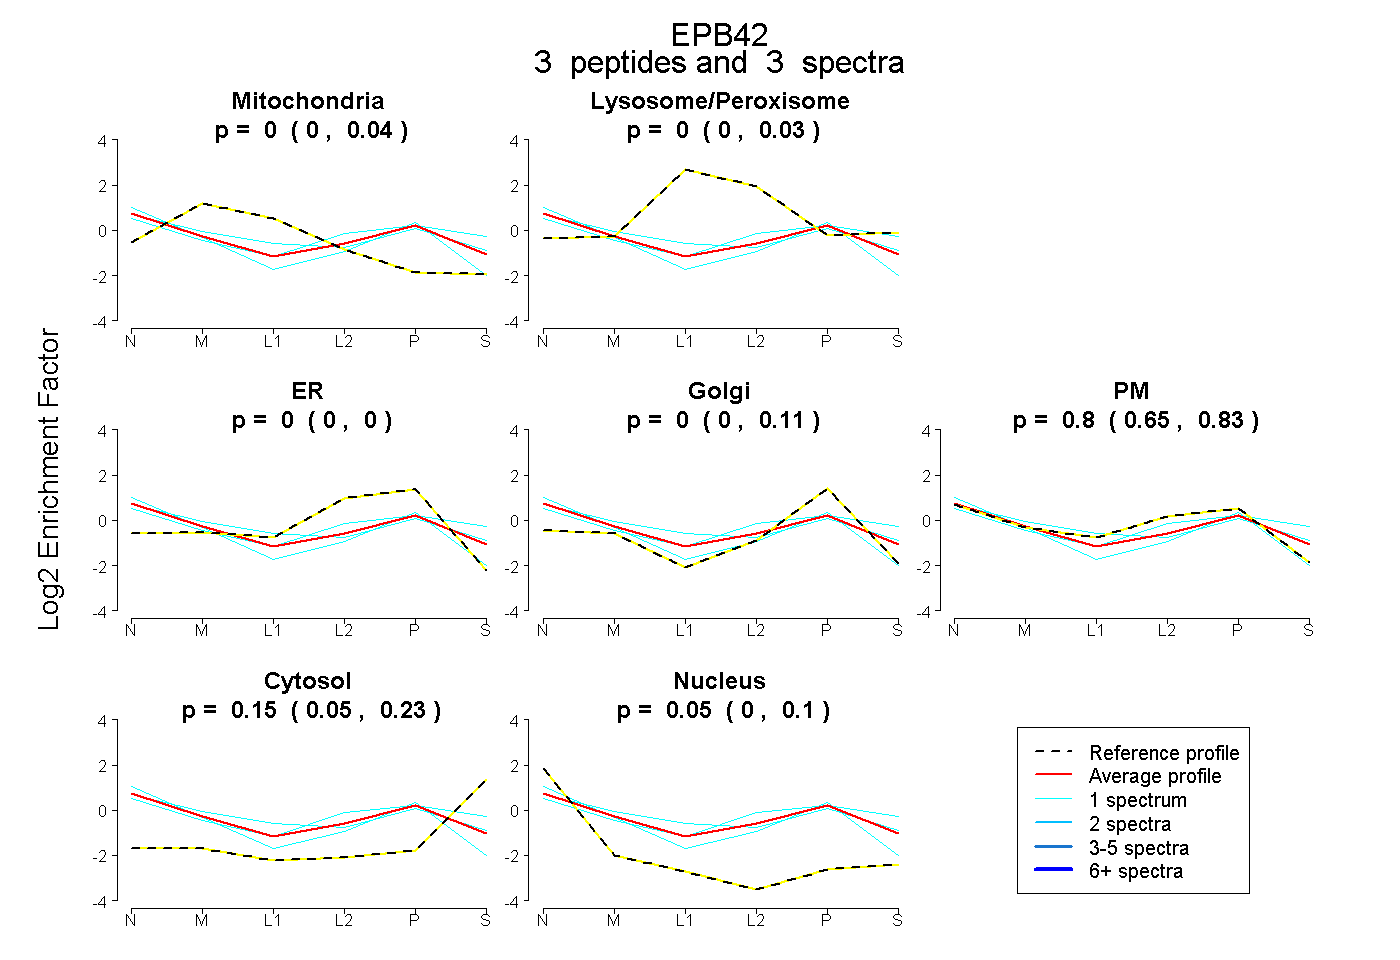 |
0.000 0.000 | 0.042 |
0.000 0.000 | 0.035 |
0.000 0.000 | 0.000 |
0.000 0.000 | 0.115 |
0.797 0.645 | 0.827 |
0.153 0.048 | 0.228 |
0.050 0.000 | 0.105 |
|||
| Plot | Lyso | Other | |||||||||||
| Expt C |
2 peptides |
3 spectra |
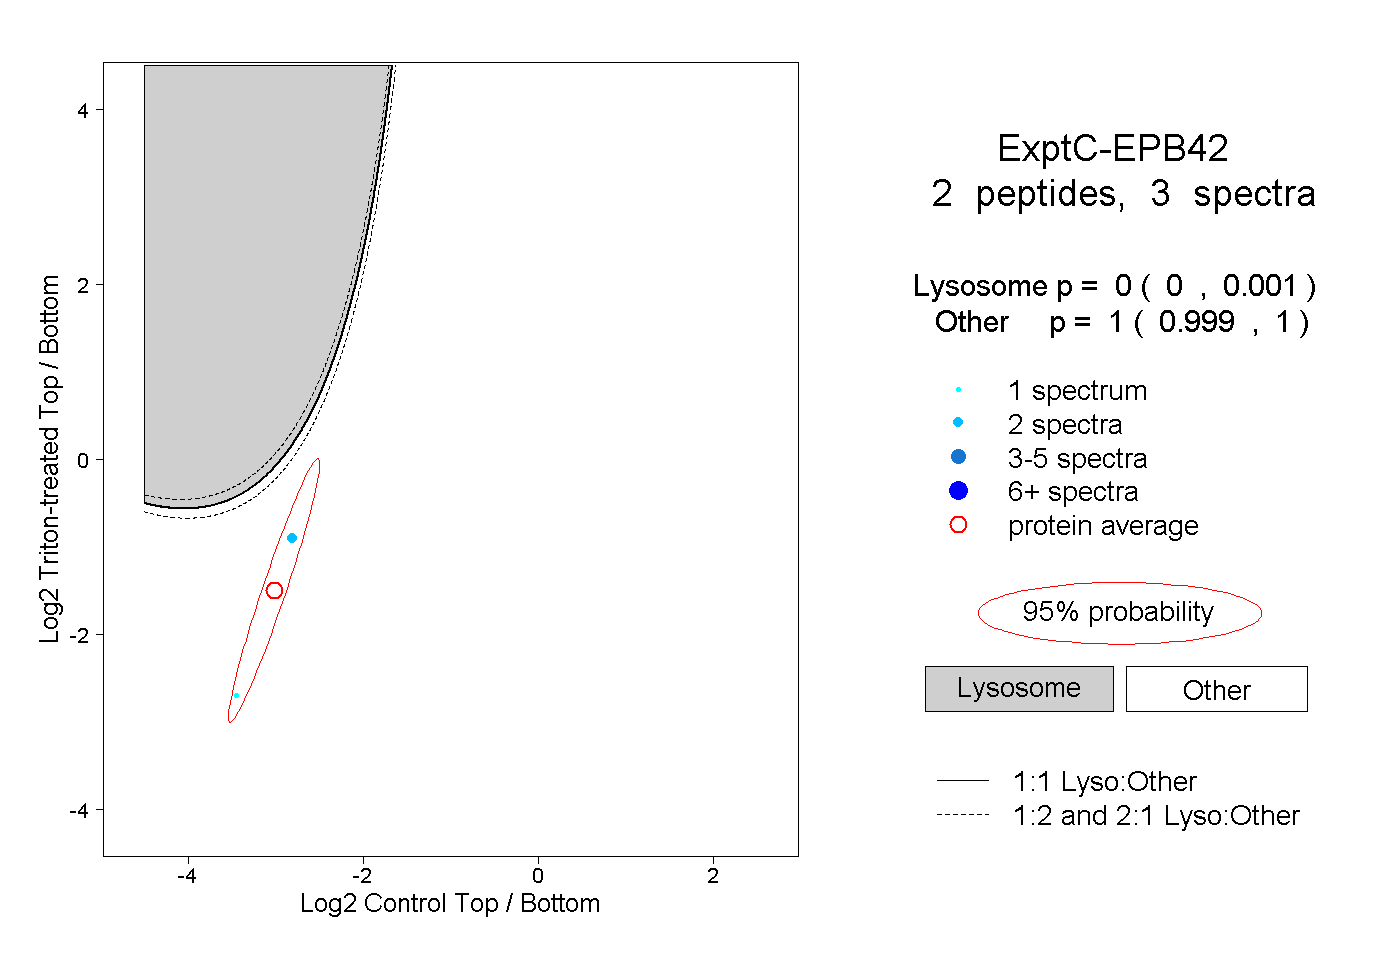 |
0.000 0.000 | 0.001 |
1.000 0.999 | 1.000 |