 26
26peptides
spectra
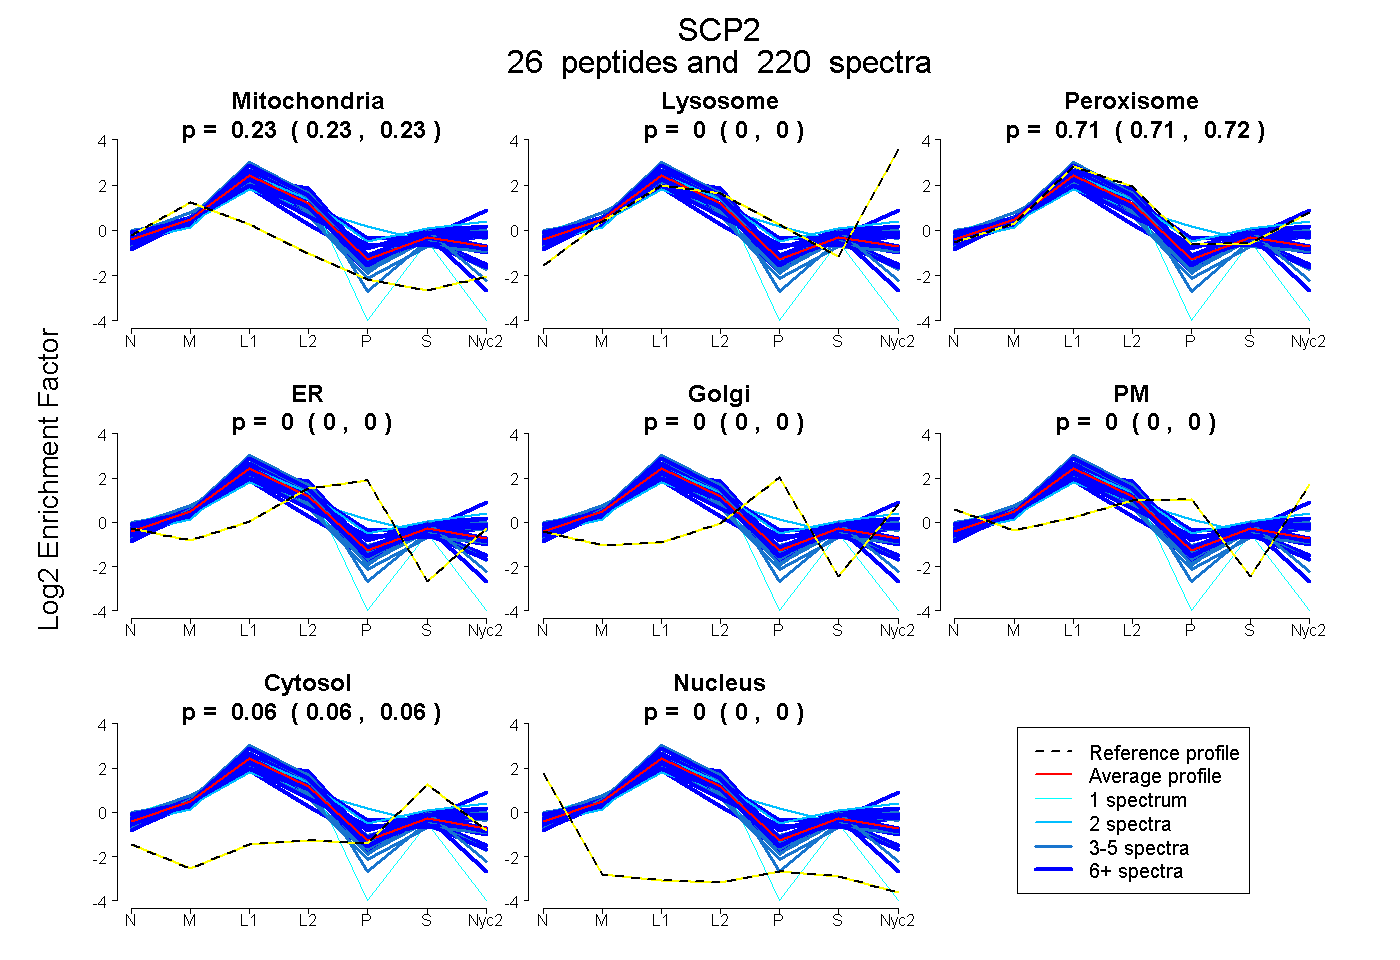
0.226 | 0.230
0.000 | 0.000
0.711 | 0.716
0.000 | 0.000
0.000 | 0.000
0.000 | 0.000
0.057 | 0.059
0.000 | 0.000
25peptides
spectra
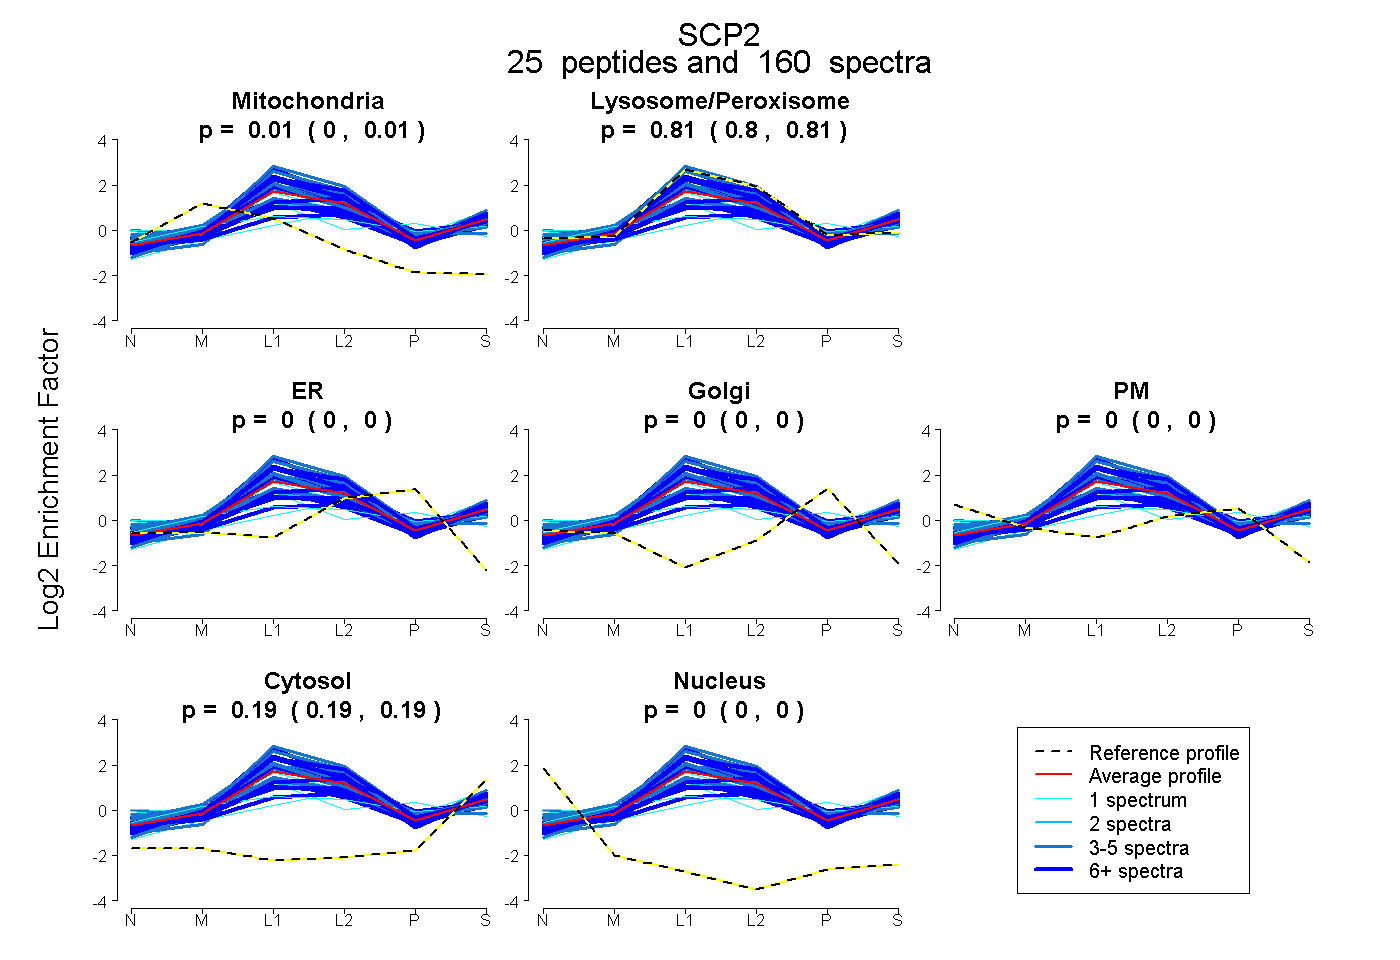
0.003 | 0.007
0.802 | 0.808
0.000 | 0.000
0.000 | 0.000
0.000 | 0.000
0.187 | 0.192
0.000 | 0.000
32peptides
spectra
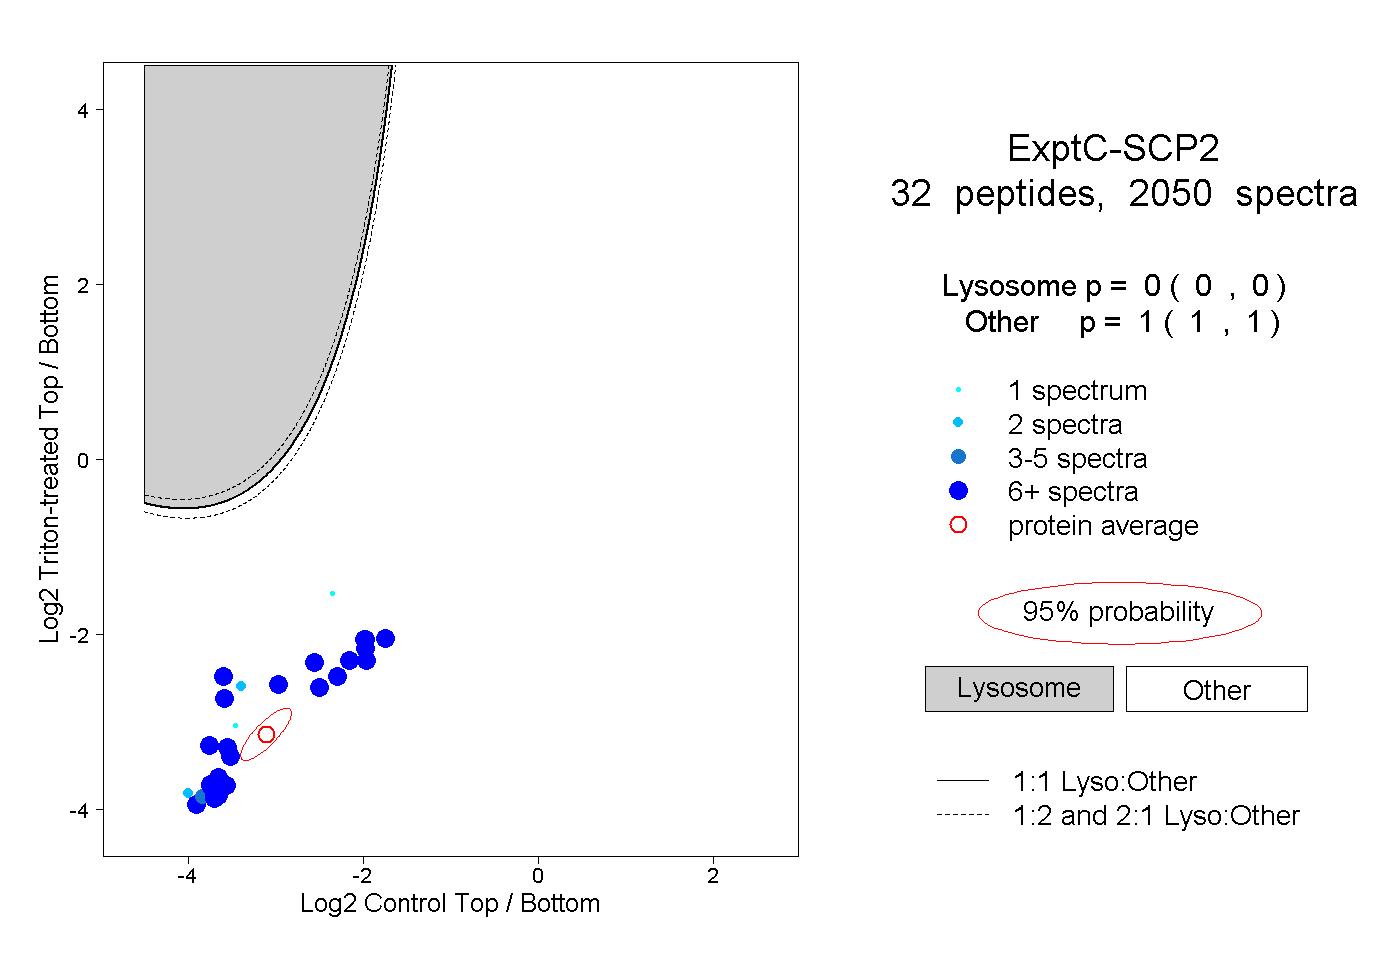
0.000 | 0.000
1.000 | 1.000
26peptides
spectra
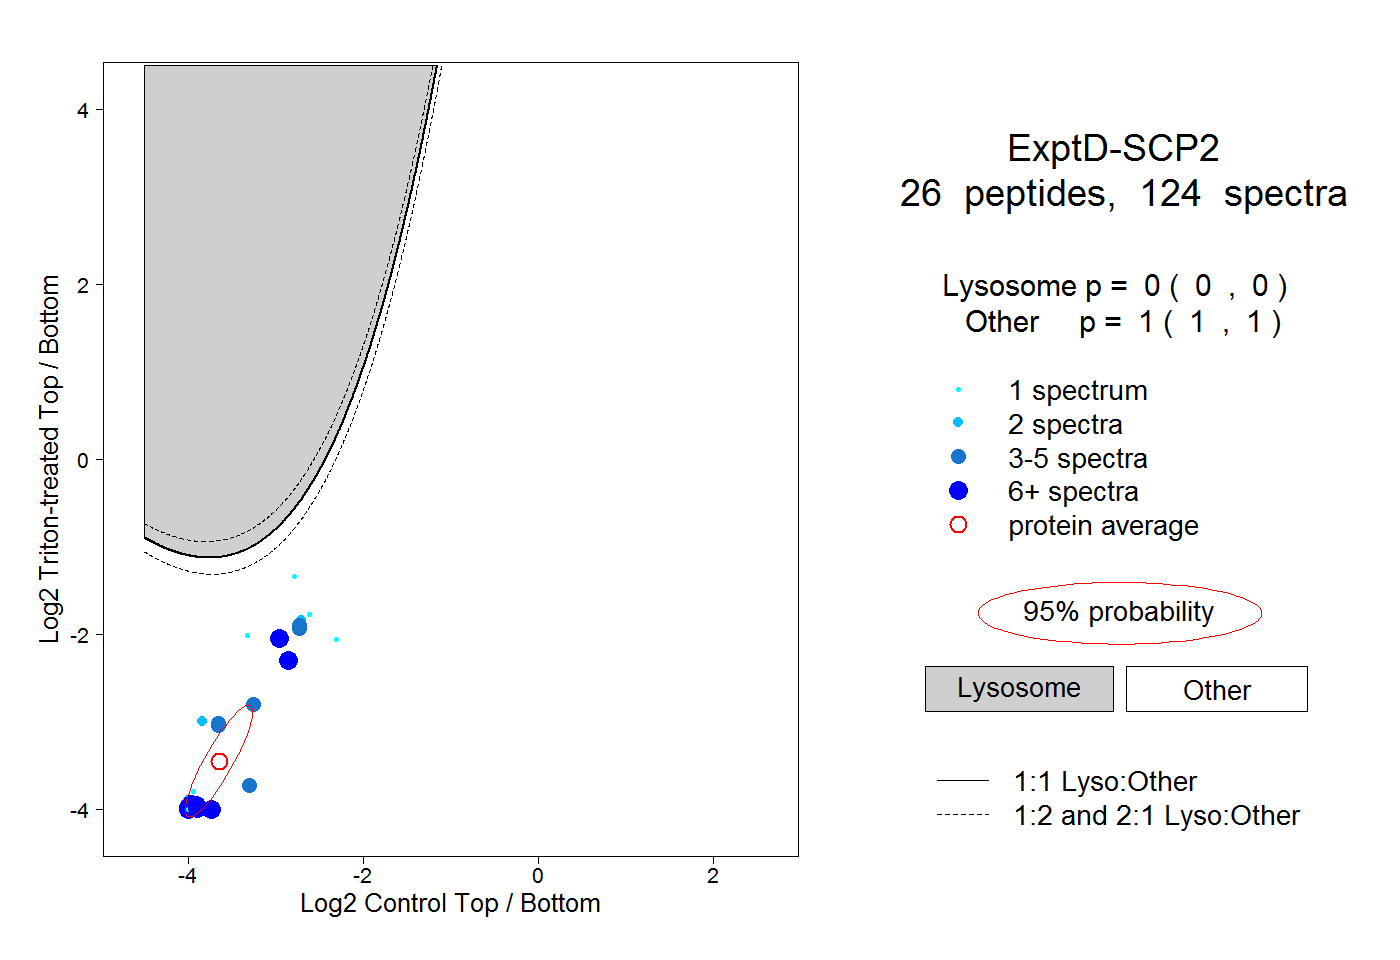
0.000 | 0.000
1.000 | 1.000