 14
14peptides
spectra
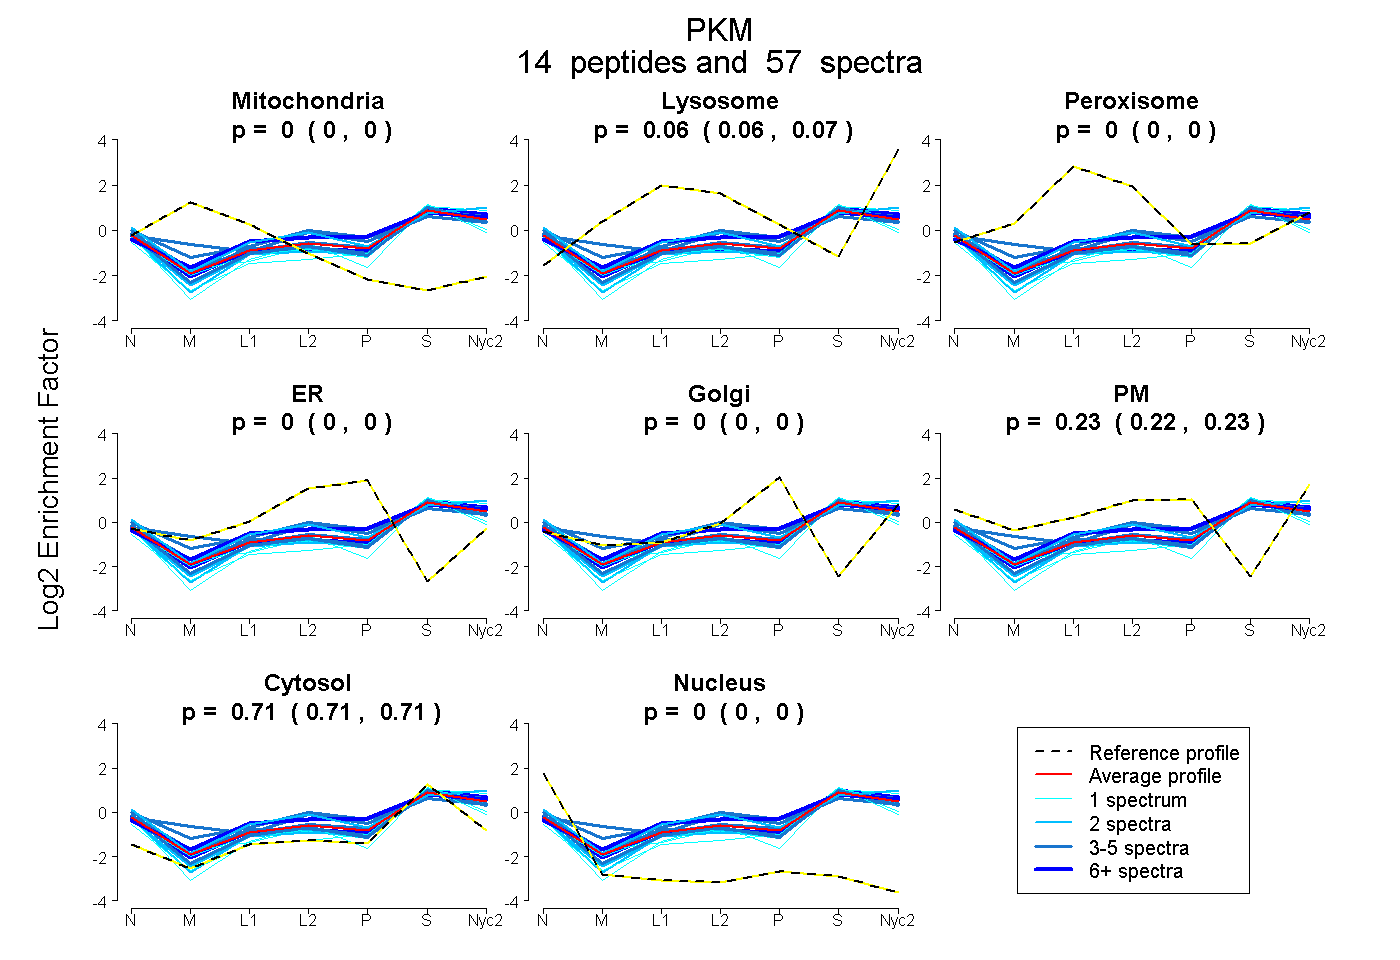
0.000 | 0.000
0.058 | 0.067
0.000 | 0.000
0.000 | 0.000
0.000 | 0.000
0.222 | 0.230
0.707 | 0.714
0.000 | 0.000
5peptides
spectra
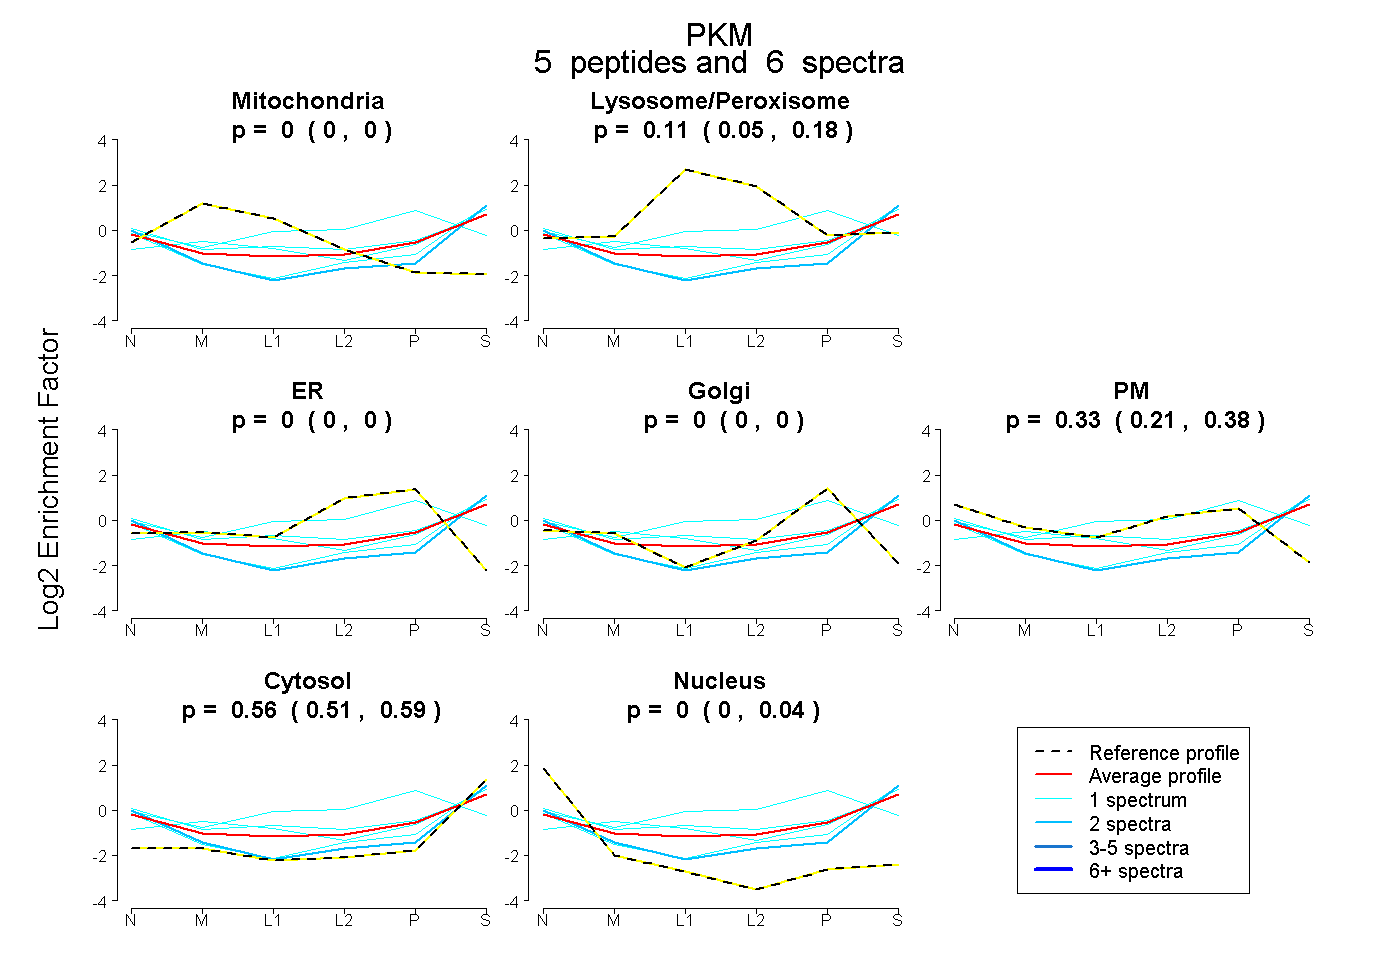
0.000 | 0.000
0.047 | 0.185
0.000 | 0.000
0.000 | 0.000
0.213 | 0.381
0.512 | 0.591
0.000 | 0.044
16peptides
spectra
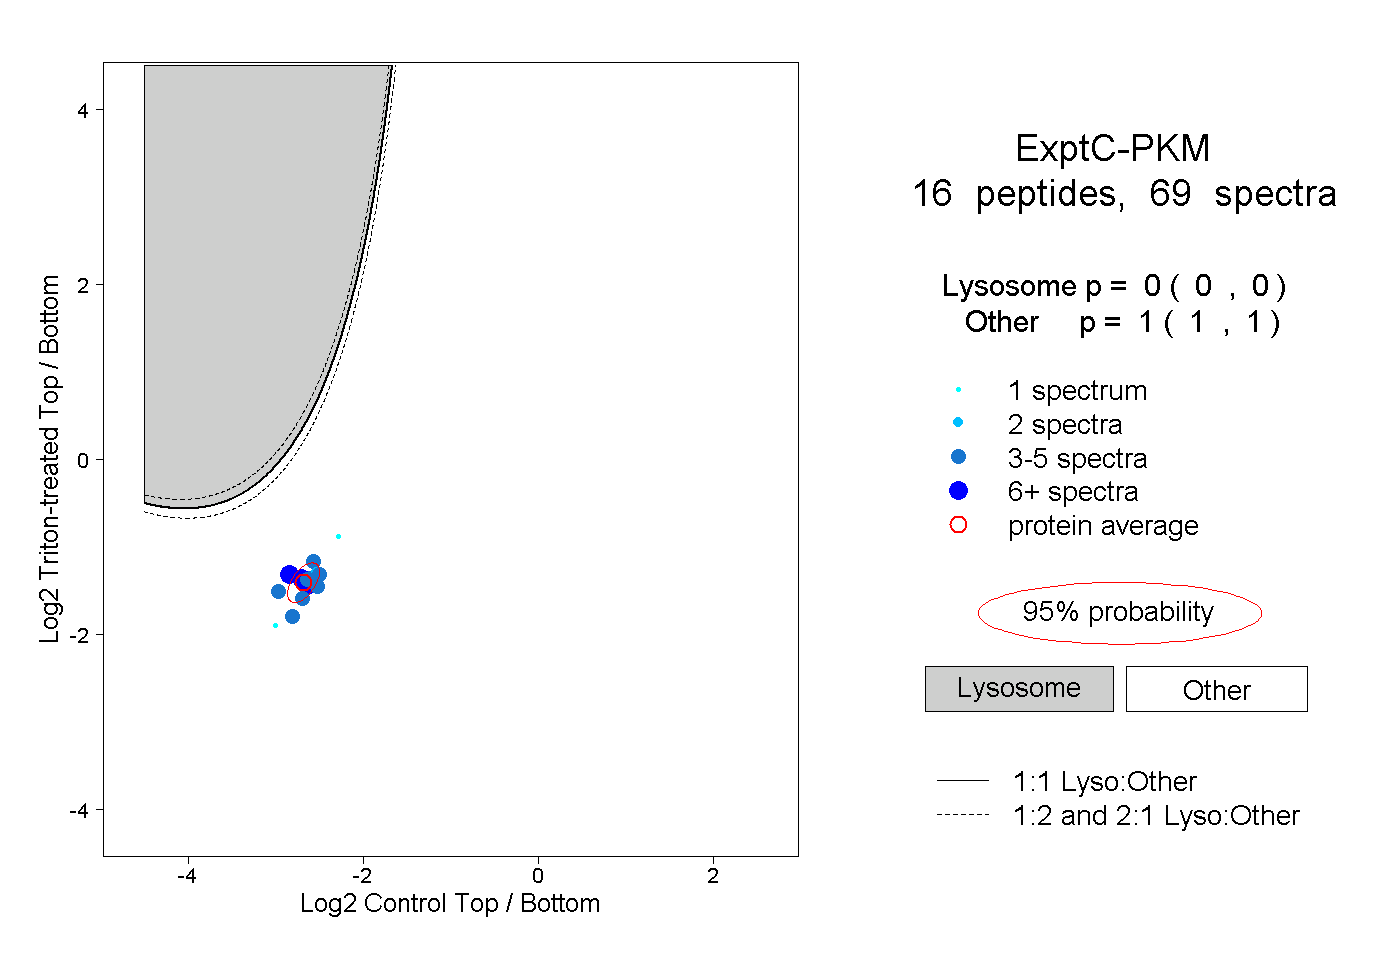
0.000 | 0.000
1.000 | 1.000
3peptides
spectra
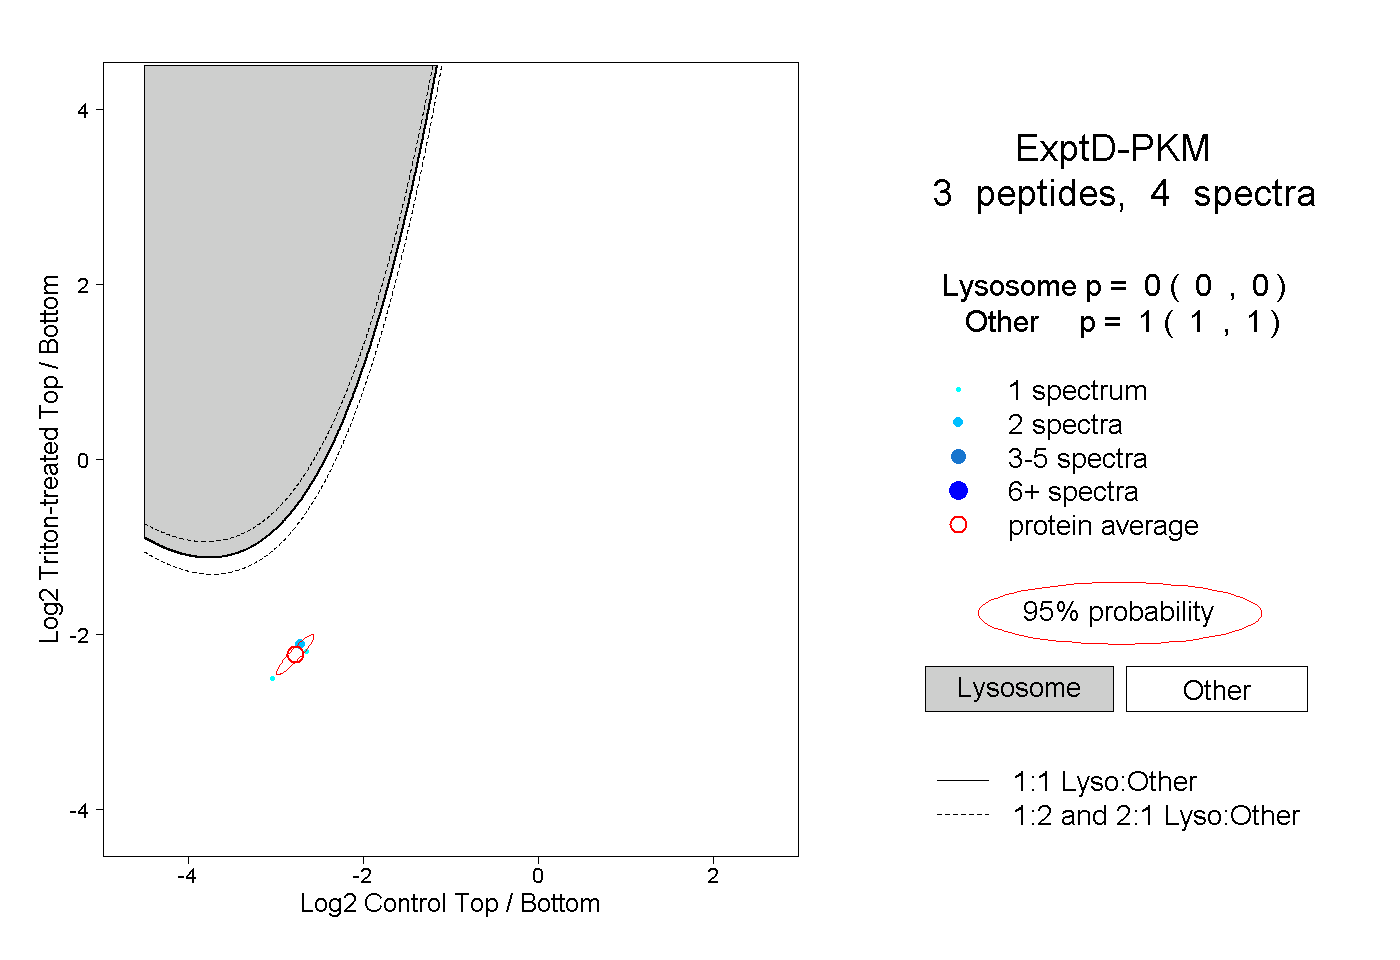
0.000 | 0.000
1.000 | 1.000