 14
14peptides
spectra
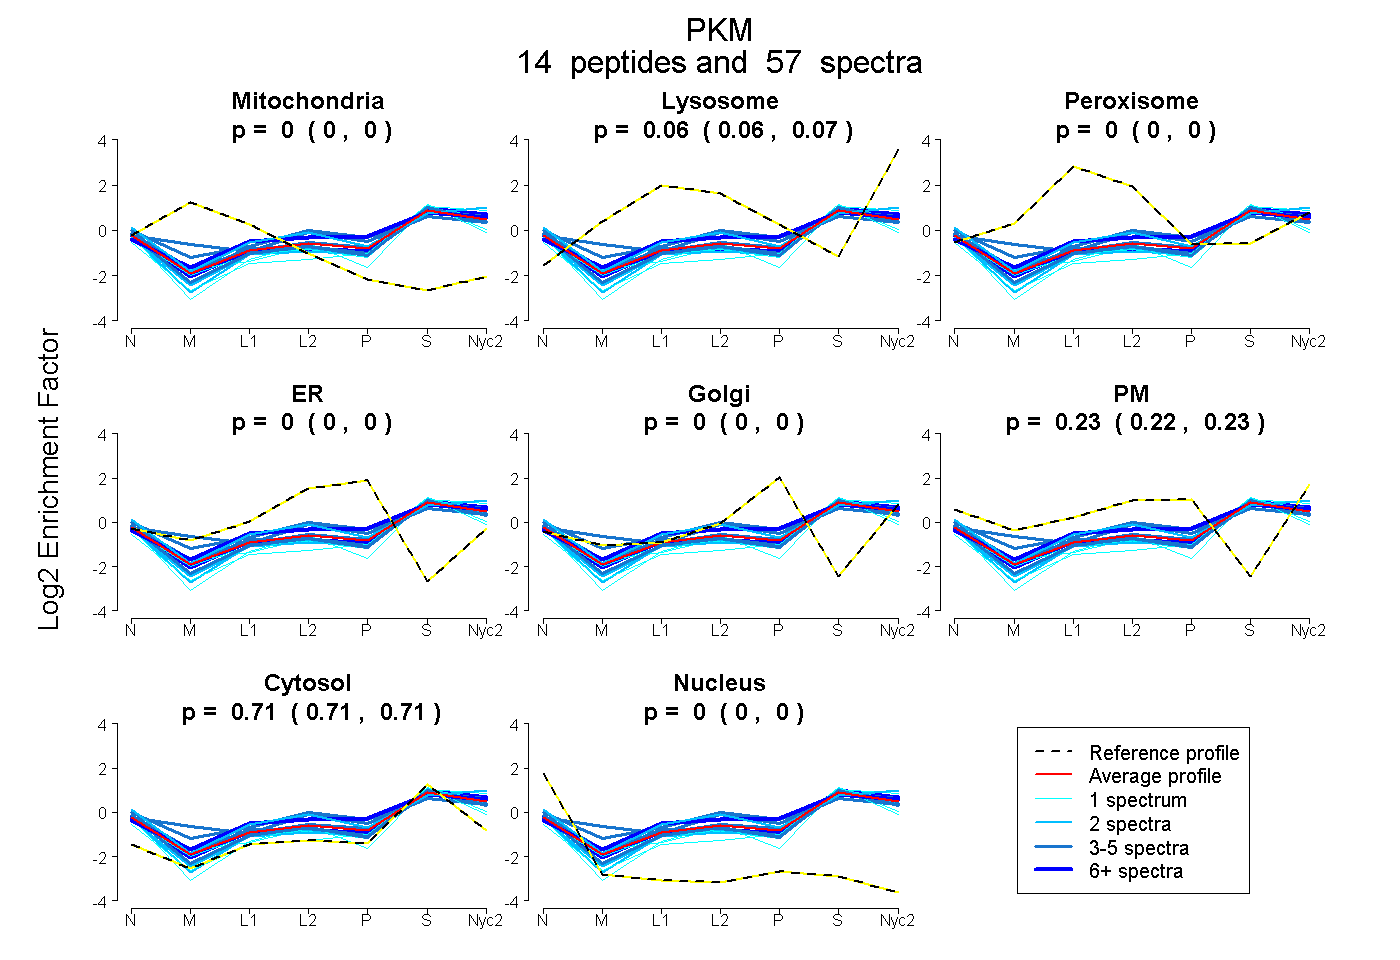
0.000 | 0.000
0.058 | 0.067
0.000 | 0.000
0.000 | 0.000
0.000 | 0.000
0.222 | 0.230
0.707 | 0.714
0.000 | 0.000
| Plot | Mito | Lyso | Perox | ER | Golgi | PM | Cytosol | Nucleus | |||||
| Expt A |
14 peptides |
57 spectra |
|
0.000 0.000 | 0.000 |
0.063 0.058 | 0.067 |
0.000 0.000 | 0.000 |
0.000 0.000 | 0.000 |
0.000 0.000 | 0.000 |
0.226 0.222 | 0.230 |
0.711 0.707 | 0.714 |
0.000 0.000 | 0.000 |
| 1 spectrum, DIQDLK | 0.000 | 0.087 | 0.000 | 0.000 | 0.000 | 0.145 | 0.767 | 0.000 | ||
| 3 spectra, EAEAAIYHLQLFEELR | 0.000 | 0.023 | 0.101 | 0.000 | 0.000 | 0.306 | 0.570 | 0.000 | ||
| 5 spectra, ITLDNAYMEK | 0.000 | 0.089 | 0.000 | 0.000 | 0.000 | 0.201 | 0.710 | 0.000 | ||
| 2 spectra, GDYPLEAVR | 0.000 | 0.022 | 0.000 | 0.000 | 0.000 | 0.176 | 0.802 | 0.000 | ||
| 1 spectrum, FDEILEASDGIMVAR | 0.000 | 0.130 | 0.000 | 0.000 | 0.000 | 0.120 | 0.749 | 0.000 | ||
| 1 spectrum, GIFPVLCK | 0.000 | 0.000 | 0.000 | 0.000 | 0.000 | 0.119 | 0.873 | 0.008 | ||
| 2 spectra, DAVLDAWAEDVDLR | 0.000 | 0.011 | 0.000 | 0.000 | 0.000 | 0.174 | 0.815 | 0.000 | ||
| 8 spectra, APIIAVTR | 0.000 | 0.090 | 0.000 | 0.000 | 0.000 | 0.182 | 0.728 | 0.000 | ||
| 1 spectrum, IYVDDGLISLQVK | 0.000 | 0.000 | 0.000 | 0.000 | 0.000 | 0.113 | 0.878 | 0.009 | ||
| 2 spectra, VNLAMNVGK | 0.000 | 0.118 | 0.024 | 0.000 | 0.000 | 0.263 | 0.595 | 0.000 | ||
| 4 spectra, LDIDSAPITAR | 0.000 | 0.017 | 0.000 | 0.000 | 0.000 | 0.208 | 0.776 | 0.000 | ||
| 4 spectra, AADVHEVR | 0.000 | 0.040 | 0.011 | 0.000 | 0.000 | 0.256 | 0.693 | 0.000 | ||
| 19 spectra, MQHLIAR | 0.000 | 0.120 | 0.028 | 0.000 | 0.000 | 0.226 | 0.626 | 0.000 | ||
| 4 spectra, IENHEGVR | 0.000 | 0.000 | 0.109 | 0.000 | 0.000 | 0.329 | 0.562 | 0.000 |
| Plot | Mito | Lyso or Perox | ER | Golgi | PM | Cytosol | Nucleus | ||||||
| Expt B |
5 peptides |
6 spectra |
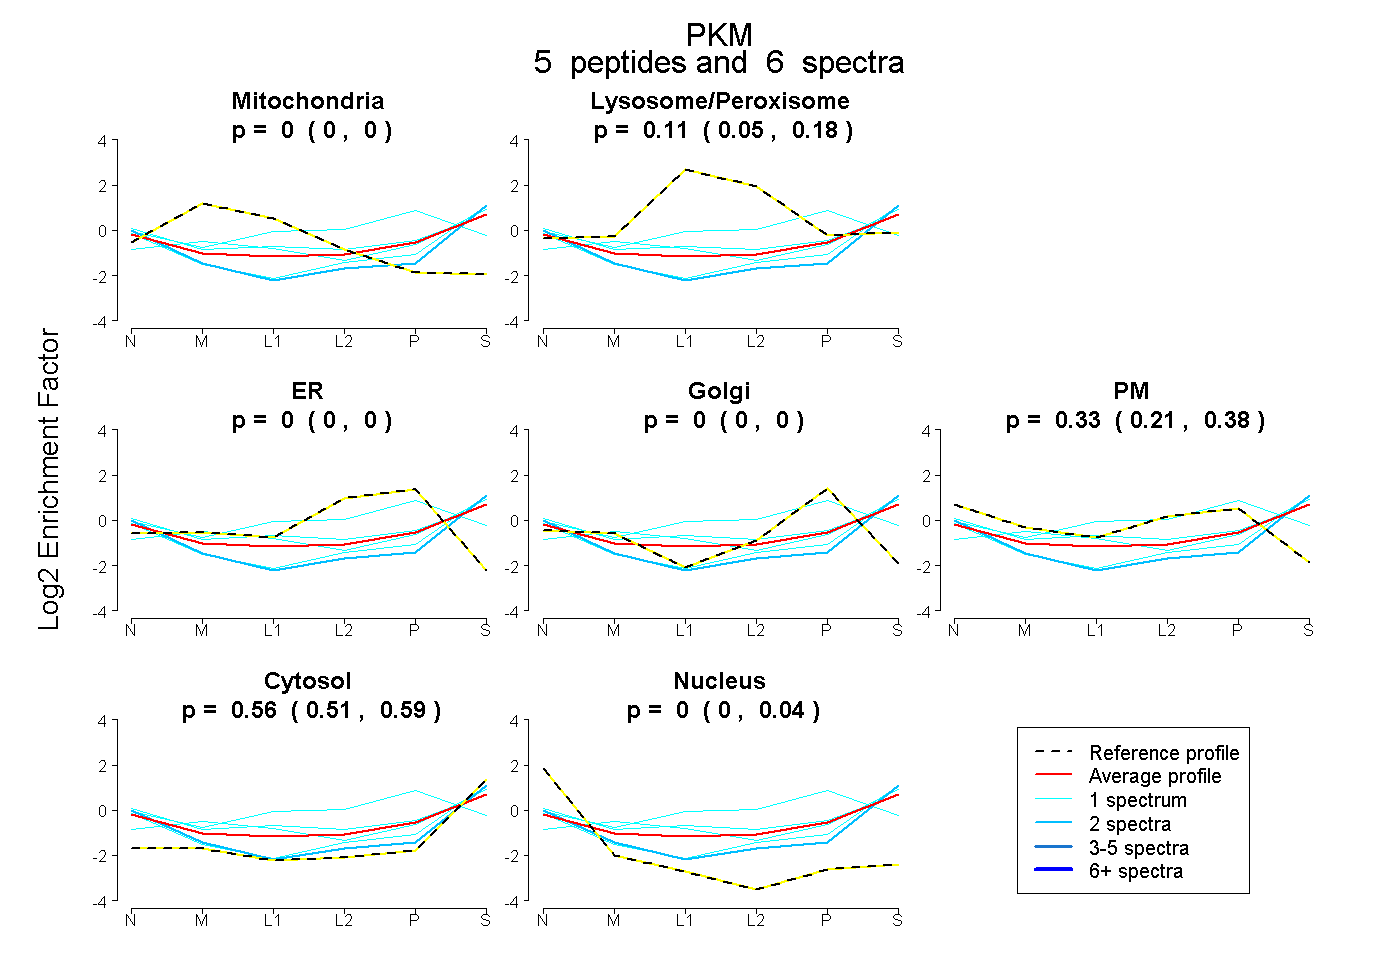 |
0.000 0.000 | 0.000 |
0.112 0.047 | 0.185 |
0.000 0.000 | 0.000 |
0.000 0.000 | 0.000 |
0.327 0.213 | 0.381 |
0.561 0.512 | 0.591 |
0.000 0.000 | 0.044 |
|||
| Plot | Lyso | Other | |||||||||||
| Expt C |
16 peptides |
69 spectra |
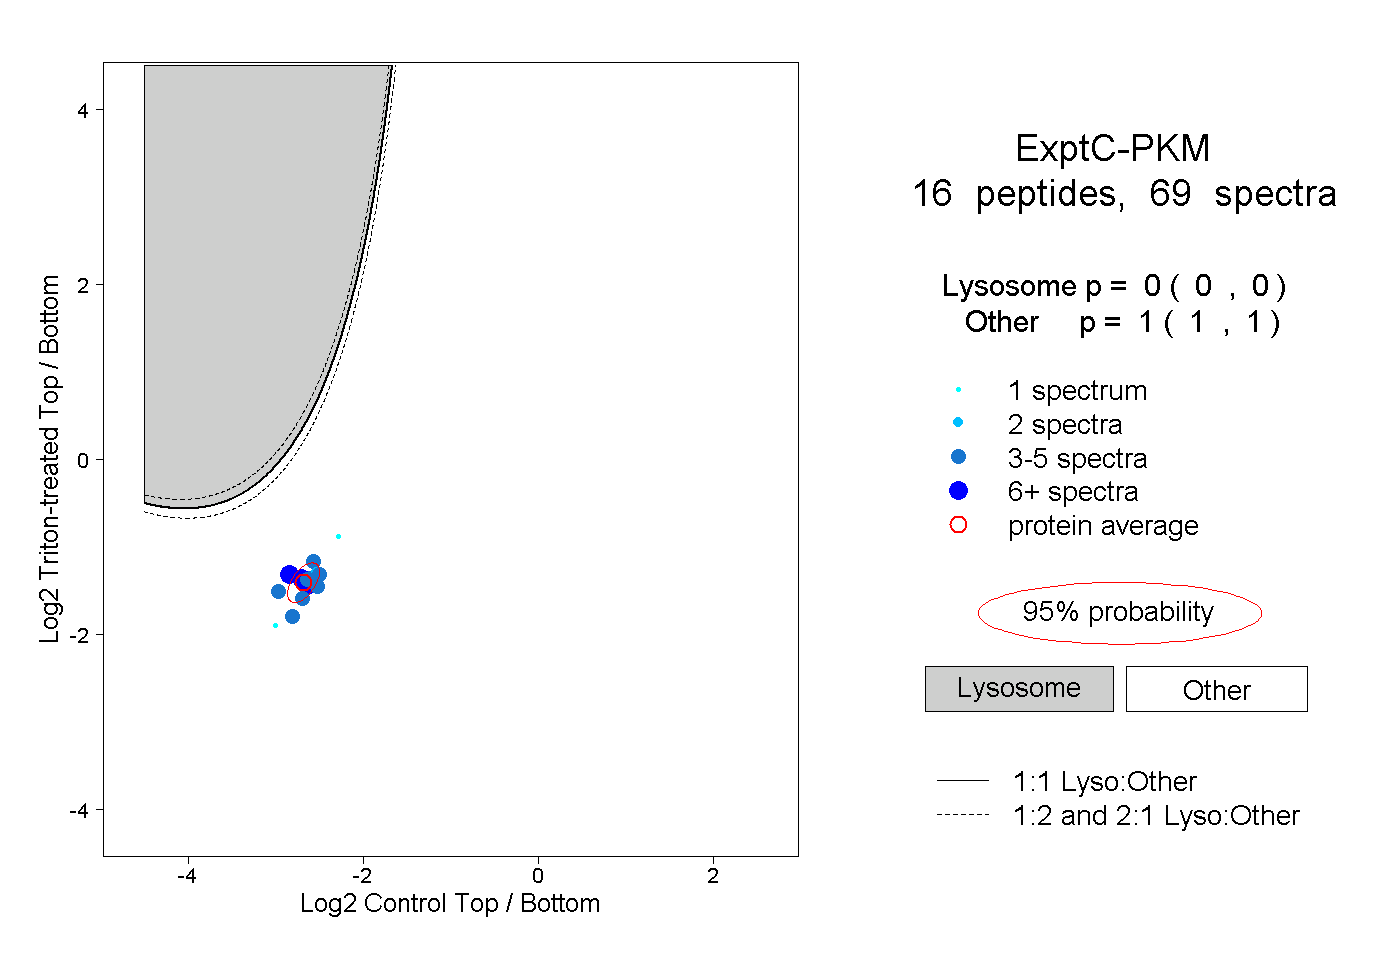 |
0.000 0.000 | 0.000 |
1.000 1.000 | 1.000 |
||||||||
| Plot | Lyso | Other | |||||||||||
| Expt D |
3 peptides |
4 spectra |
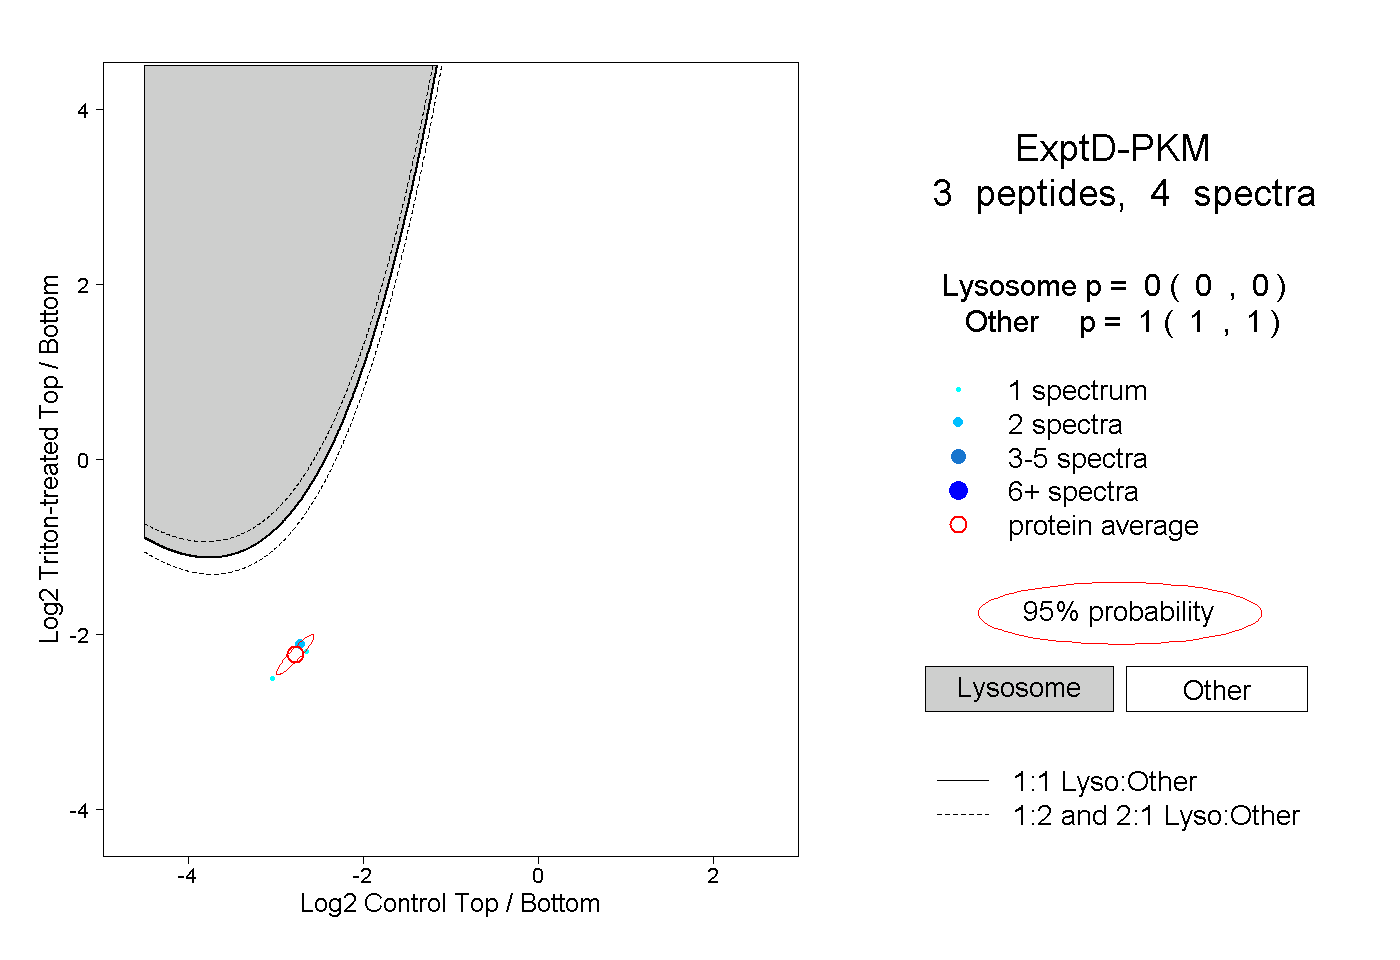 |
0.000 0.000 | 0.000 |
1.000 1.000 | 1.000 |