PKM
[ENSRNOP00000015331]
Main page
| | | Plot |
Mito |
Lyso |
|
Perox |
ER |
Golgi |
PM |
Cytosol |
Nucleus |
|
| Expt A |
 14
14
peptides |
57
spectra |
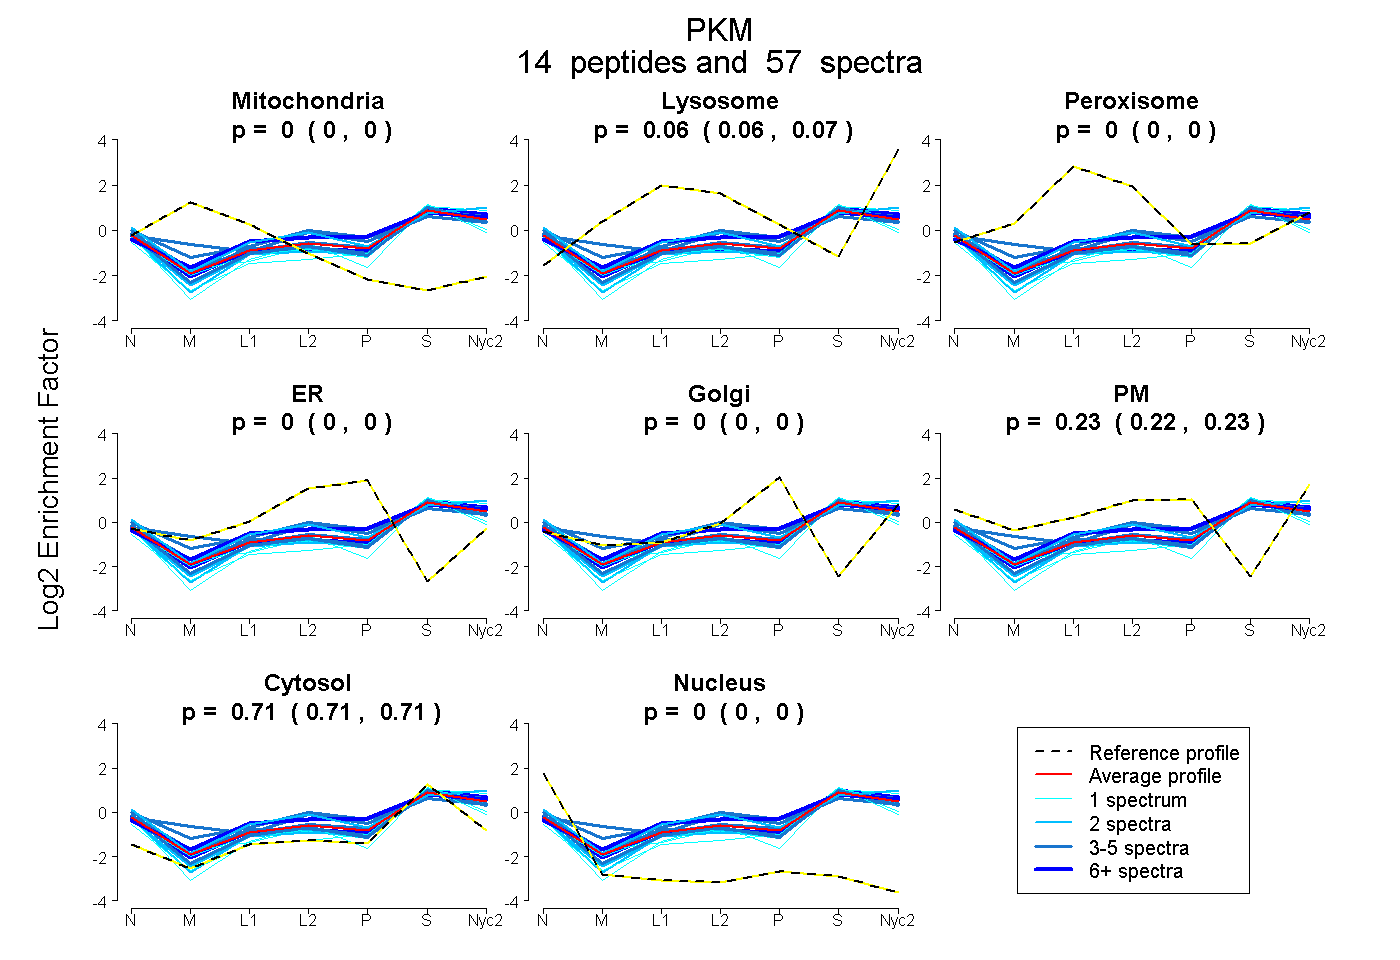 |
0.000
0.000 | 0.000 |
0.063
0.058 | 0.067 |
|
0.000
0.000 | 0.000 |
0.000
0.000 | 0.000 |
0.000
0.000 | 0.000 |
0.226
0.222 | 0.230 |
0.711
0.707 | 0.714 |
0.000
0.000 | 0.000 |
|
| | | Plot |
Mito |
|
Lyso or Perox |
|
ER |
Golgi |
PM |
Cytosol |
Nucleus |
|
| Expt B |
5
peptides |
6
spectra |
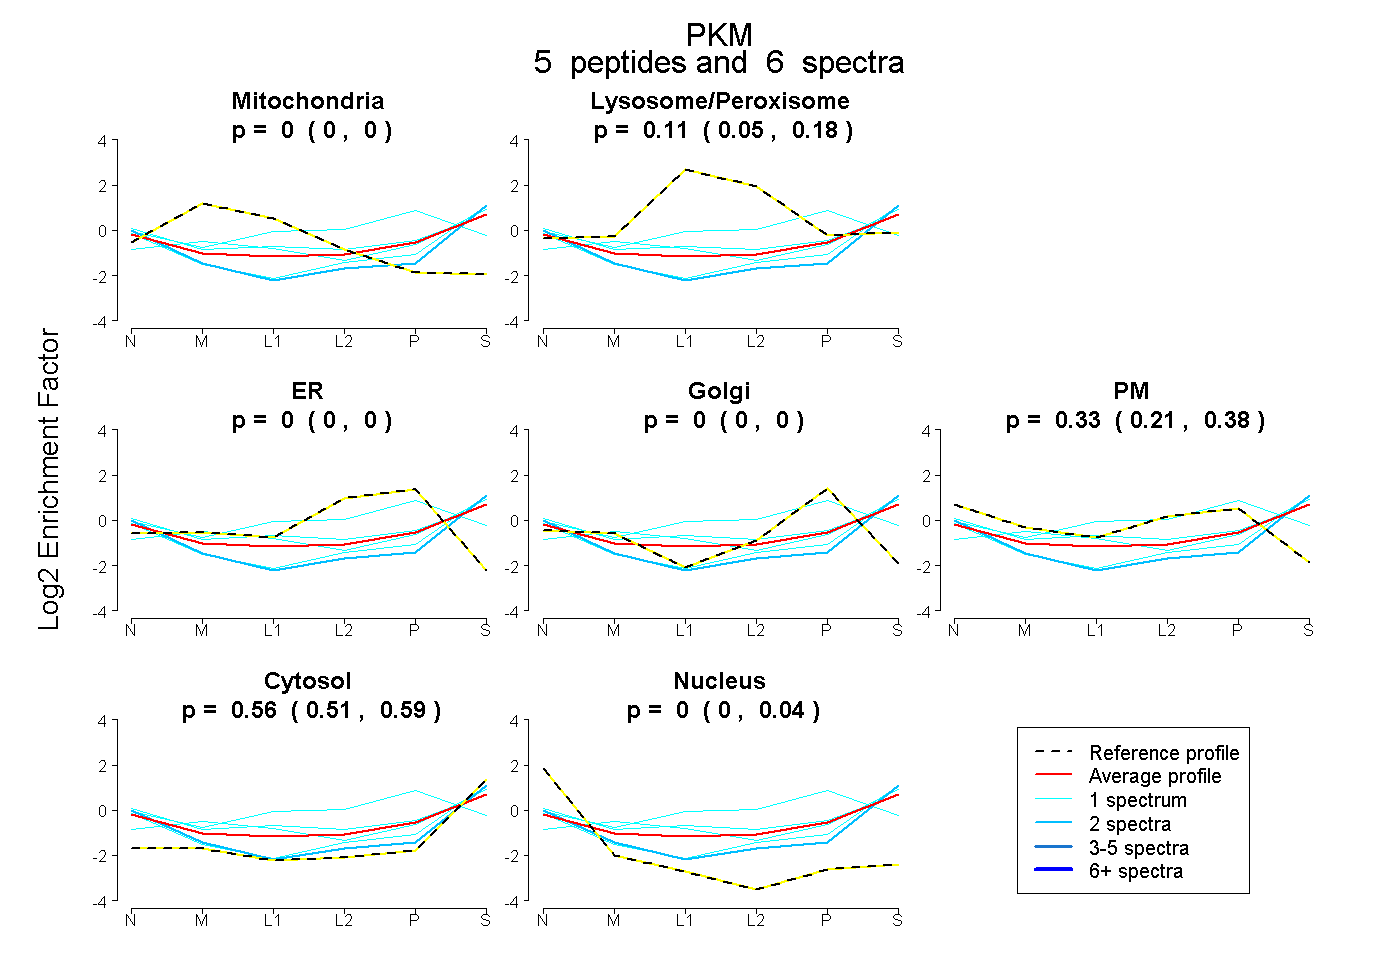 |
0.000
0.000 | 0.000 |
|
0.112
0.047 | 0.185 |
|
0.000
0.000 | 0.000 |
0.000
0.000 | 0.000 |
0.327
0.213 | 0.381 |
0.561
0.512 | 0.591 |
0.000
0.000 | 0.044 |
|
| 1 spectrum, CDENILWLDYK |
0.000 |
|
0.000 |
|
0.000 |
0.000 |
0.242 |
0.707 |
0.051 |
|
| 2 spectra, LDIDSAPITAR |
0.000 |
|
0.016 |
|
0.000 |
0.000 |
0.146 |
0.703 |
0.136 |
|
| 1 spectrum, ITLDNAYMEK |
0.061 |
|
0.229 |
|
0.000 |
0.133 |
0.000 |
0.578 |
0.000 |
|
| 1 spectrum, AADVHEVR |
0.000 |
|
0.415 |
|
0.000 |
0.455 |
0.020 |
0.110 |
0.000 |
|
| 1 spectrum, IENHEGVR |
0.000 |
|
0.211 |
|
0.000 |
0.000 |
0.295 |
0.474 |
0.020 |
|
| | | Plot |
|
Lyso |
|
|
|
|
|
|
|
Other |
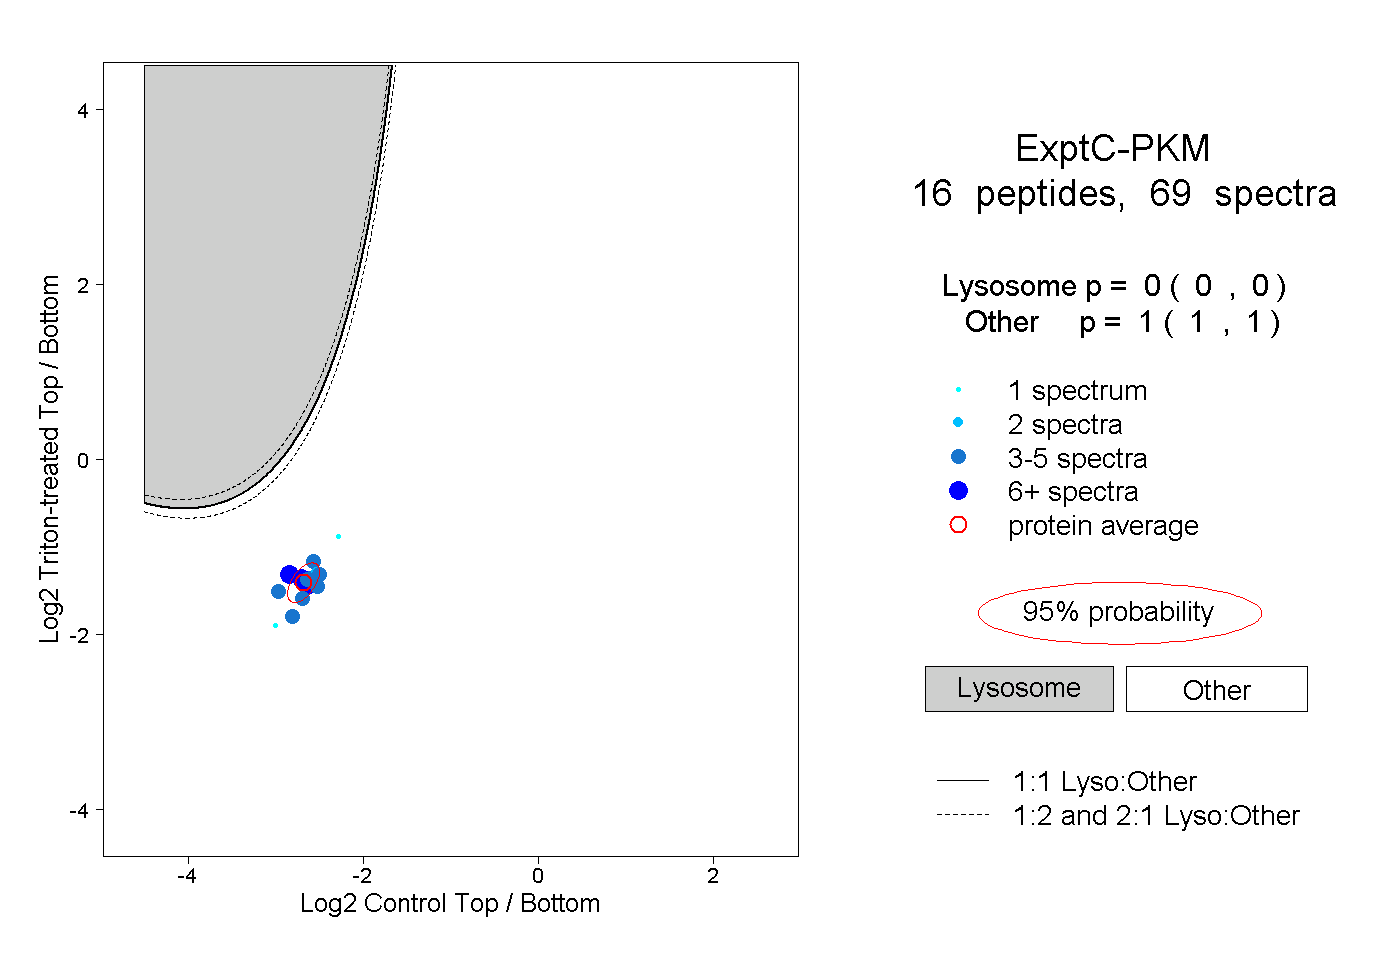
| Expt C |
16
peptides |
69
spectra |
 |
|
0.000
0.000 | 0.000 |
|
|
|
|
|
|
|
1.000
1.000 | 1.000 |
| | | Plot |
|
Lyso |
|
|
|
|
|
|
|
Other |
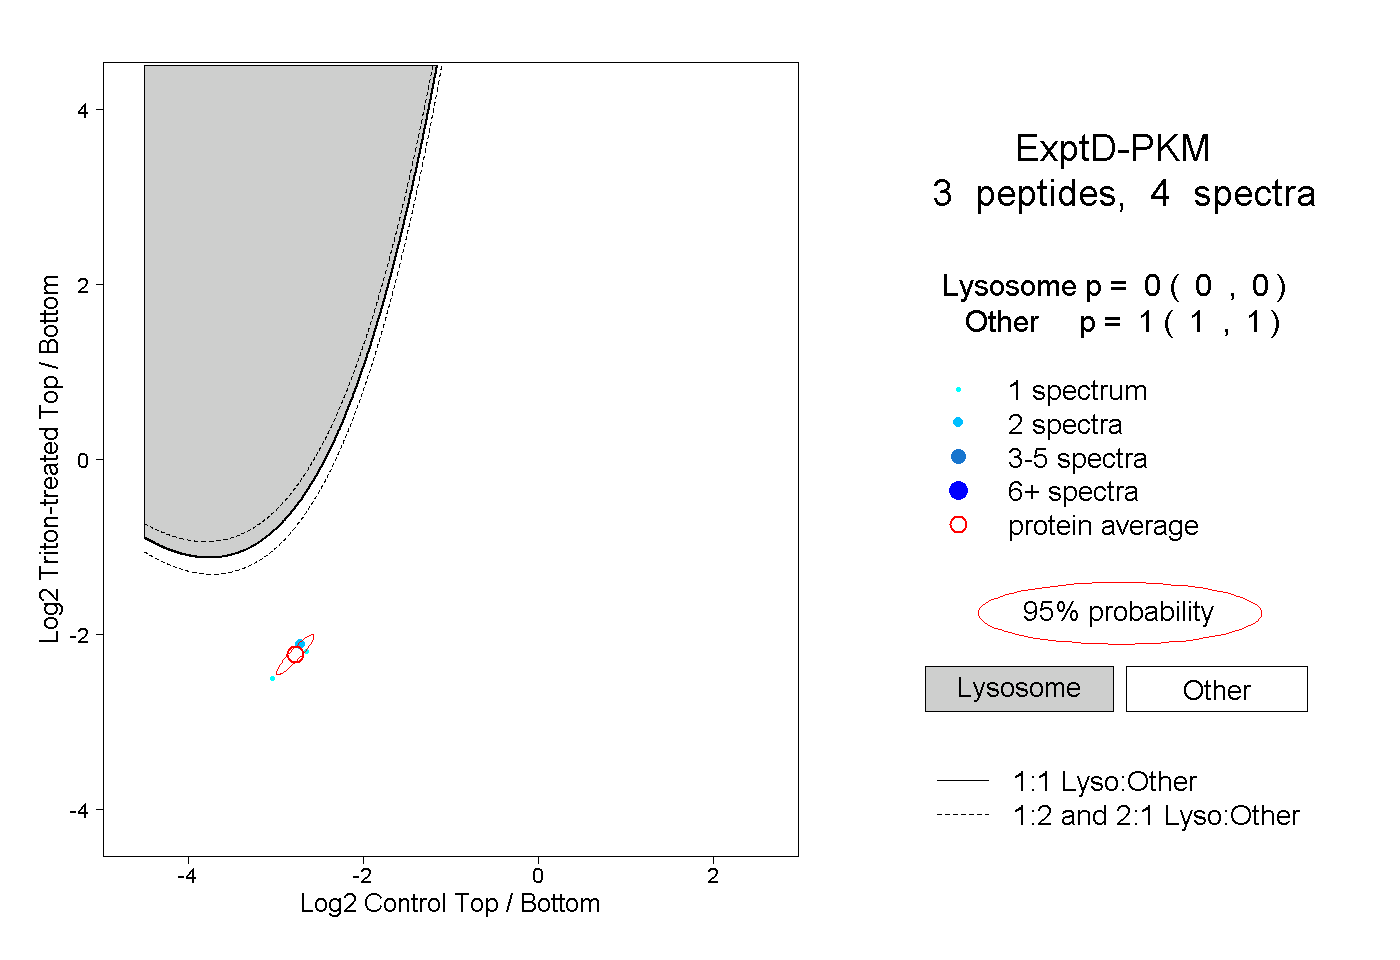
| Expt D |
3
peptides |
4
spectra |
 |
|
0.000
0.000 | 0.000 |
|
|
|
|
|
|
|
1.000
1.000 | 1.000 |