 5
5peptides
spectra
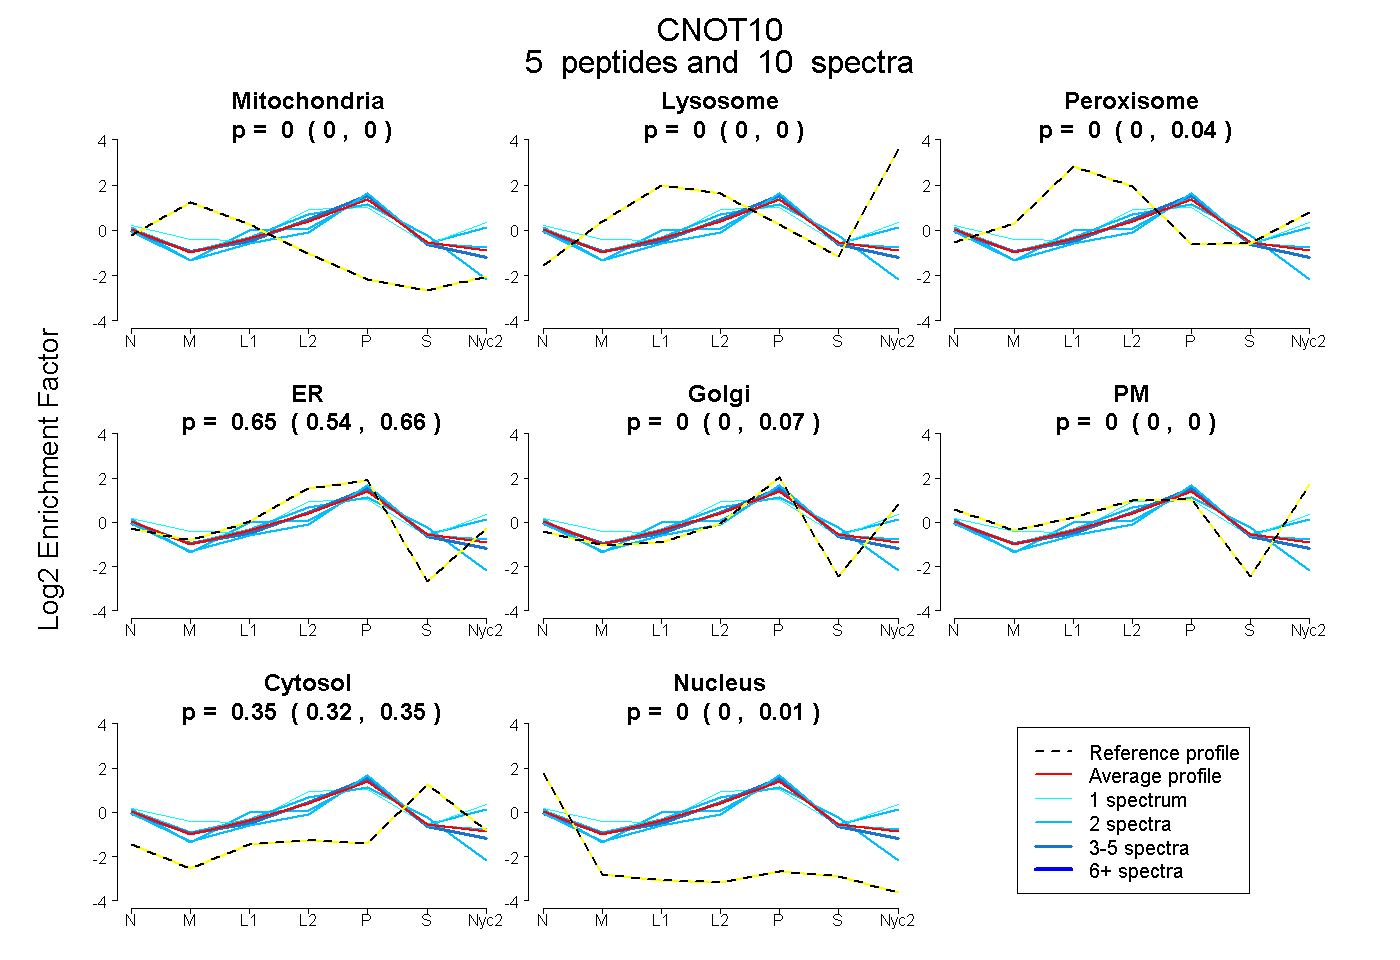
0.000 | 0.000
0.000 | 0.000
0.000 | 0.037
0.542 | 0.658
0.000 | 0.069
0.000 | 0.000
0.318 | 0.355
0.000 | 0.010
6peptides
spectra
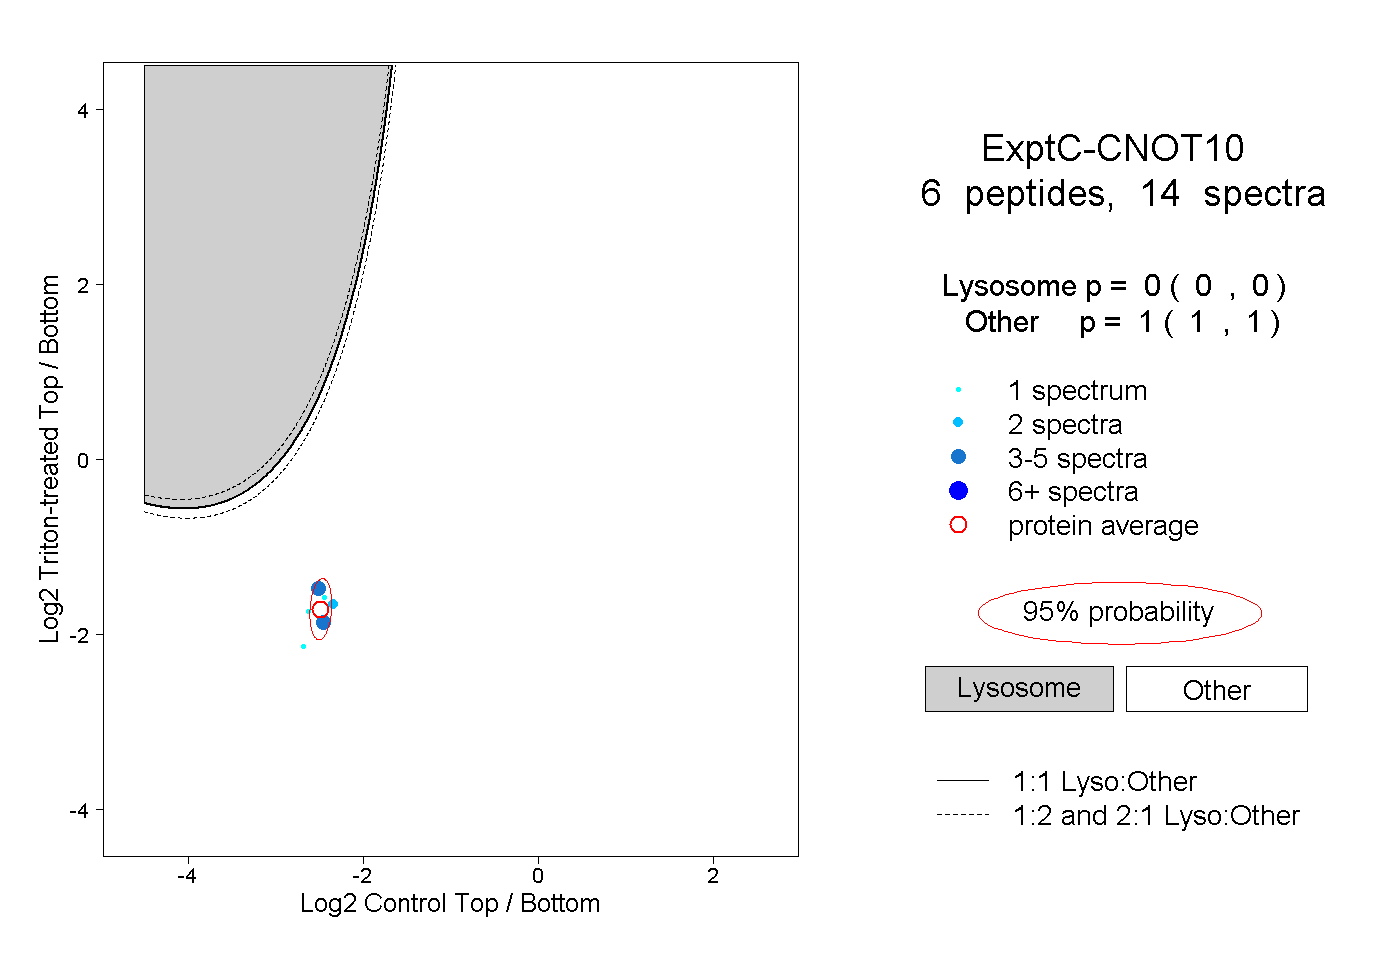
0.000 | 0.000
1.000 | 1.000
1peptide
spectrum
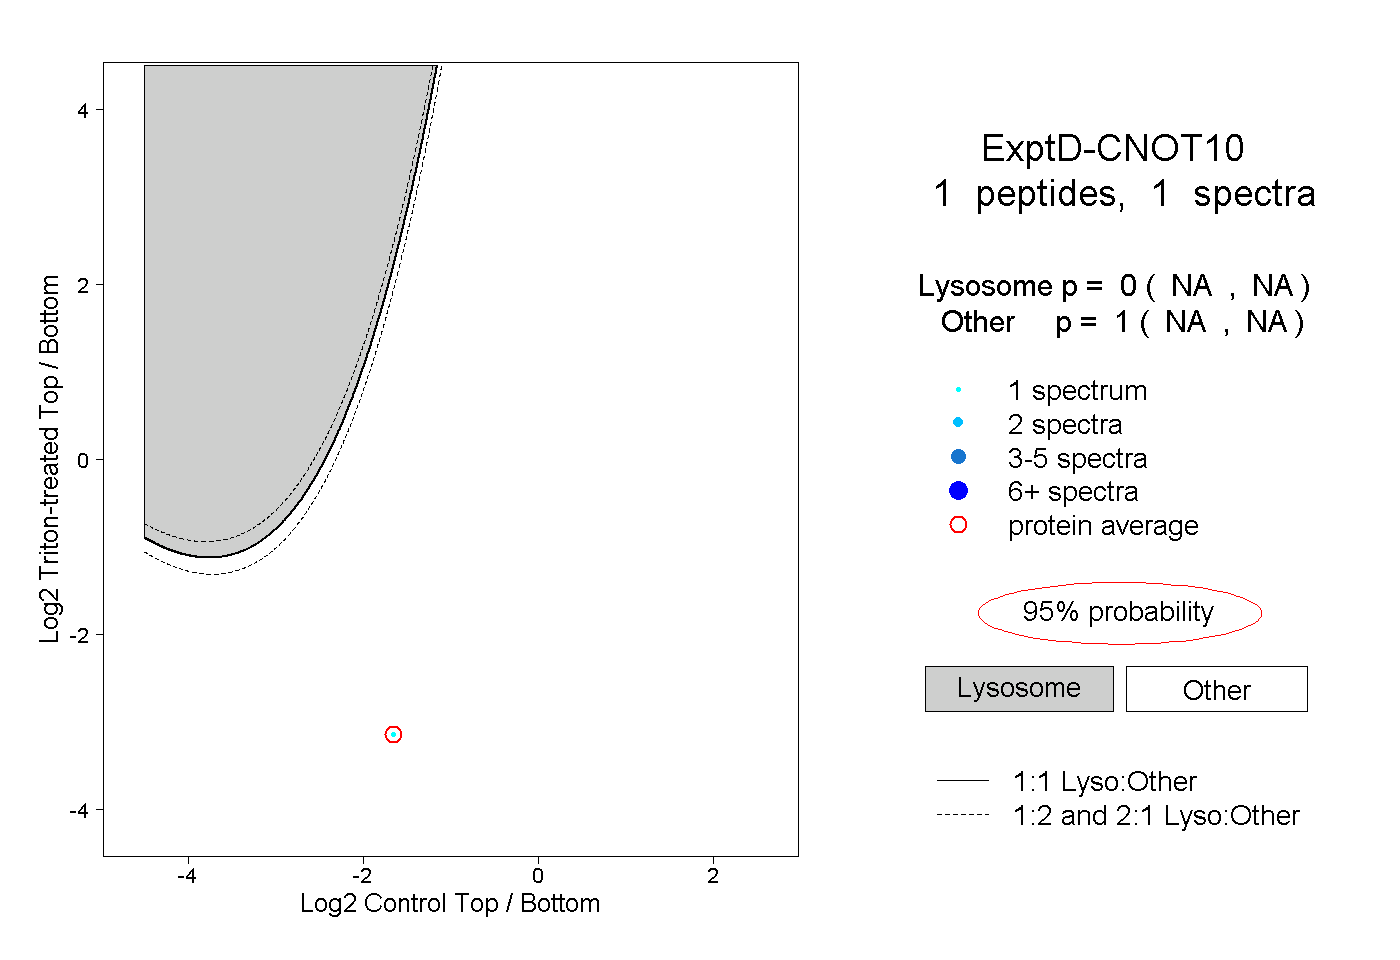
NA | NA
NA | NA