 5
5peptides
spectra
0.000 | 0.000
0.000 | 0.000
0.000 | 0.037
0.542 | 0.658
0.000 | 0.069
0.000 | 0.000
0.318 | 0.355
0.000 | 0.010
6peptides
spectra
0.000 | 0.000
1.000 | 1.000
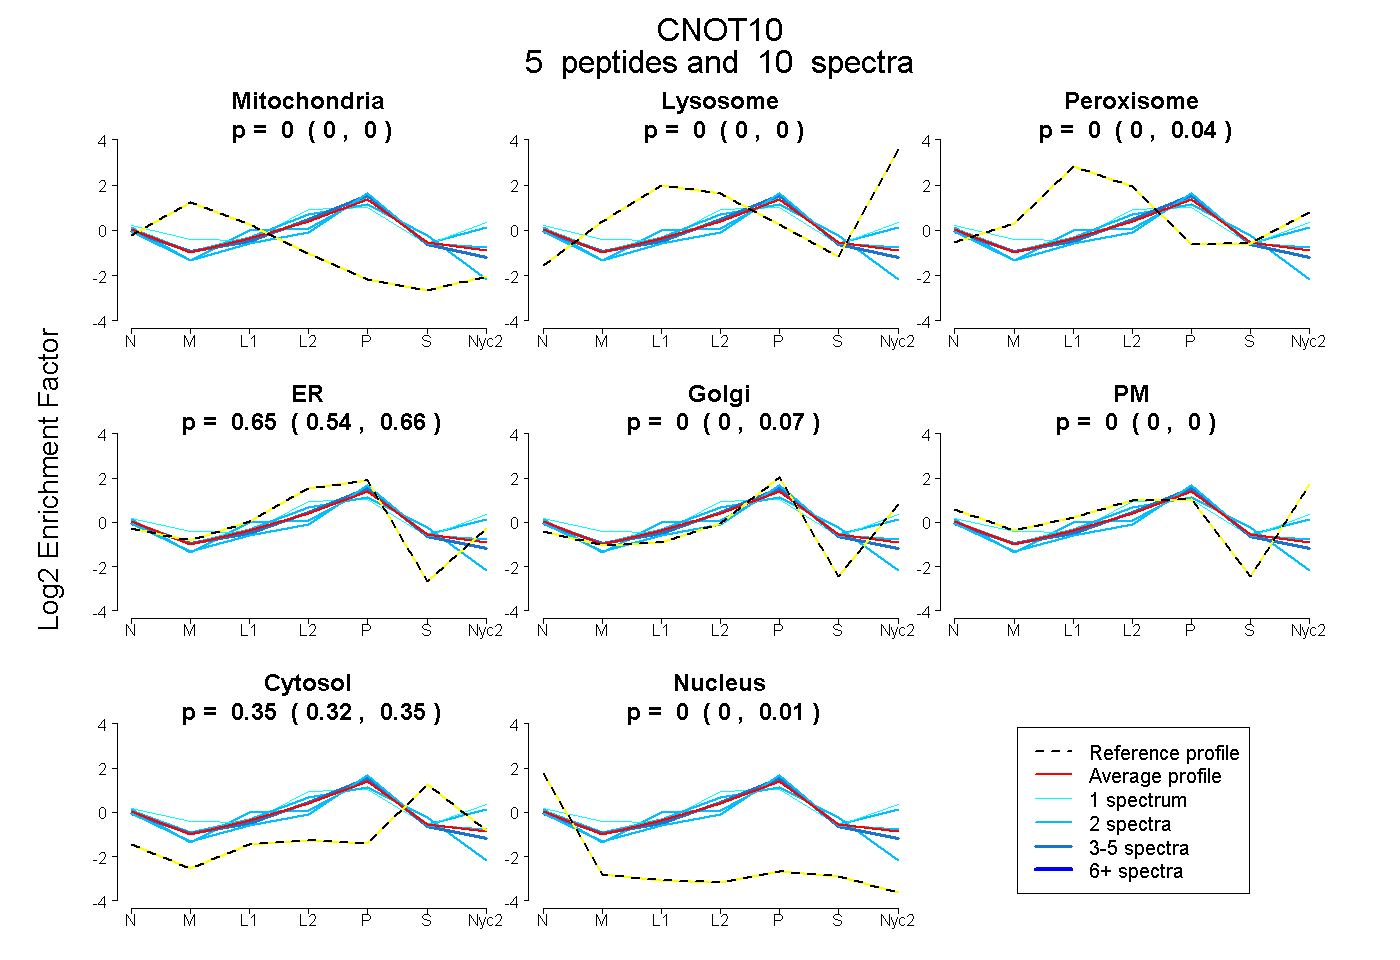
| Plot | Mito | Lyso | Perox | ER | Golgi | PM | Cytosol | Nucleus | |||||
| Expt A |
5 peptides |
10 spectra |
|
0.000 0.000 | 0.000 |
0.000 0.000 | 0.000 |
0.005 0.000 | 0.037 |
0.649 0.542 | 0.658 |
0.000 0.000 | 0.069 |
0.000 0.000 | 0.000 |
0.346 0.318 | 0.355 |
0.000 0.000 | 0.010 |
||
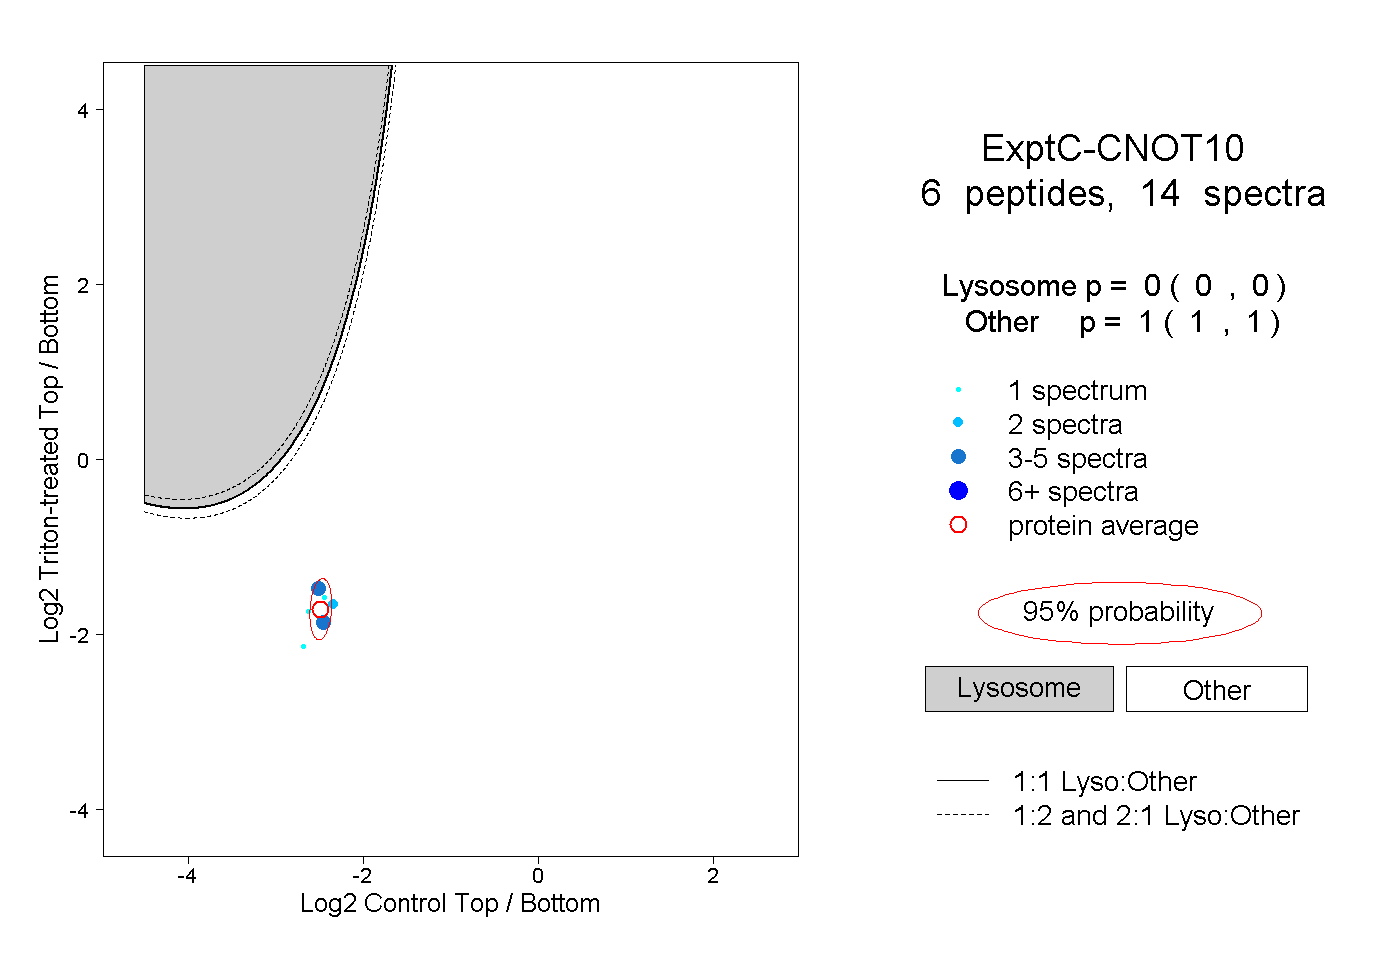
| Plot | Lyso | Other | |||||||||||
| Expt C |
6 peptides |
14 spectra |
|
0.000 0.000 | 0.000 |
1.000 1.000 | 1.000 |
| 1 spectrum, SHDGDK | 0.000 | 1.000 | ||||||||
| 2 spectra, NNQTTTDNLR | 0.000 | 1.000 | ||||||||
| 5 spectra, SETGNNSSK | 0.000 | 1.000 | ||||||||
| 4 spectra, GTSEQETK | 0.000 | 1.000 | ||||||||
| 1 spectrum, ALHLLAVLEK | 0.000 | 1.000 | ||||||||
| 1 spectrum, QTLNQLK | 0.000 | 1.000 |
| Plot | Lyso | Other | |||||||||||
| Expt D |
1 peptide |
1 spectrum |
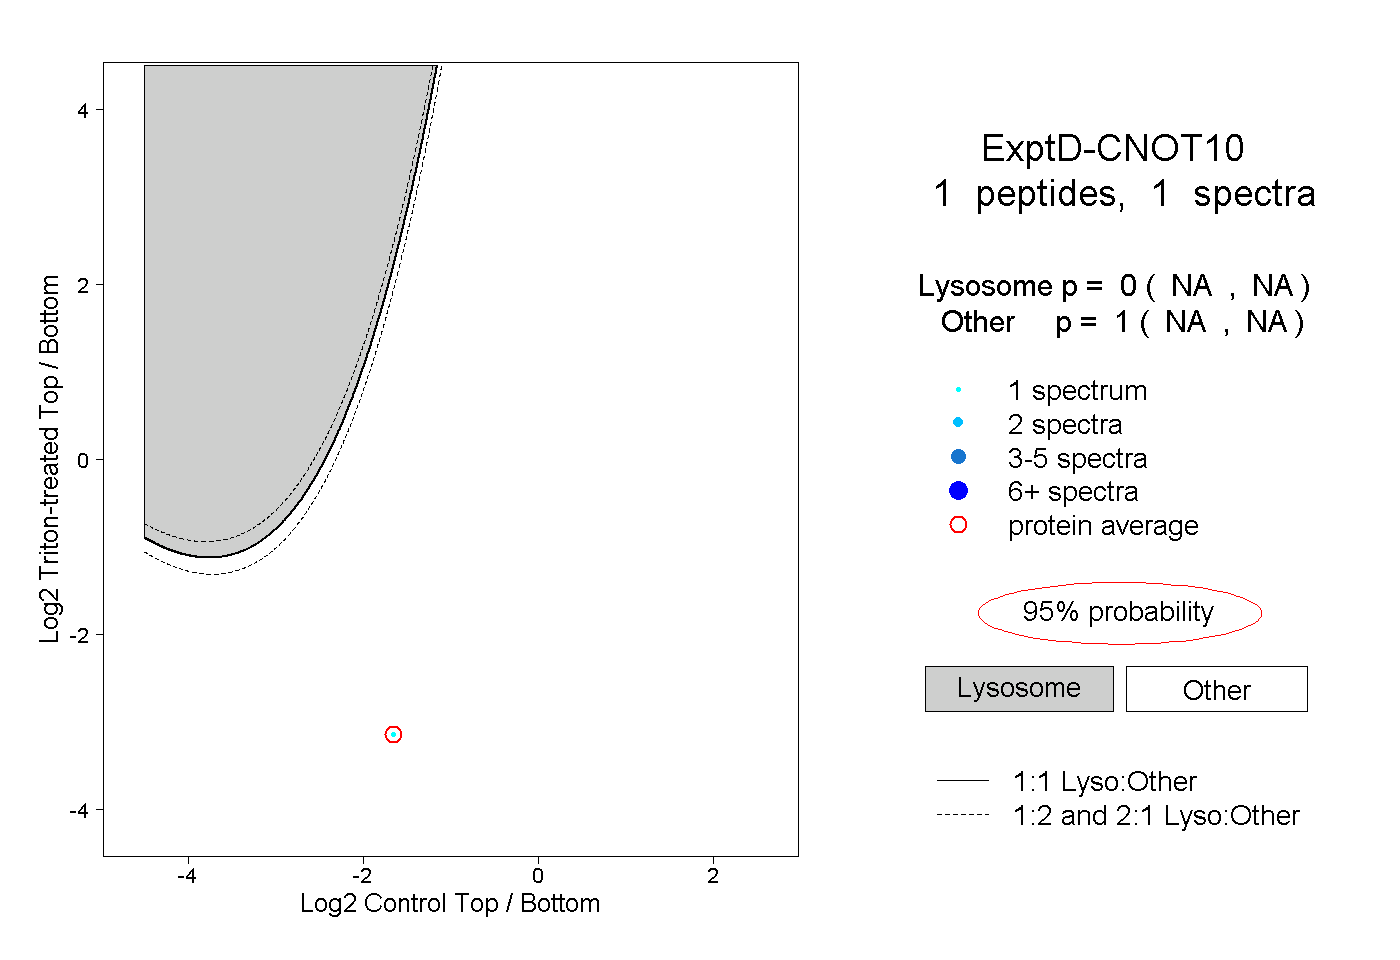 |
0.000 NA | NA |
1.000 NA | NA |