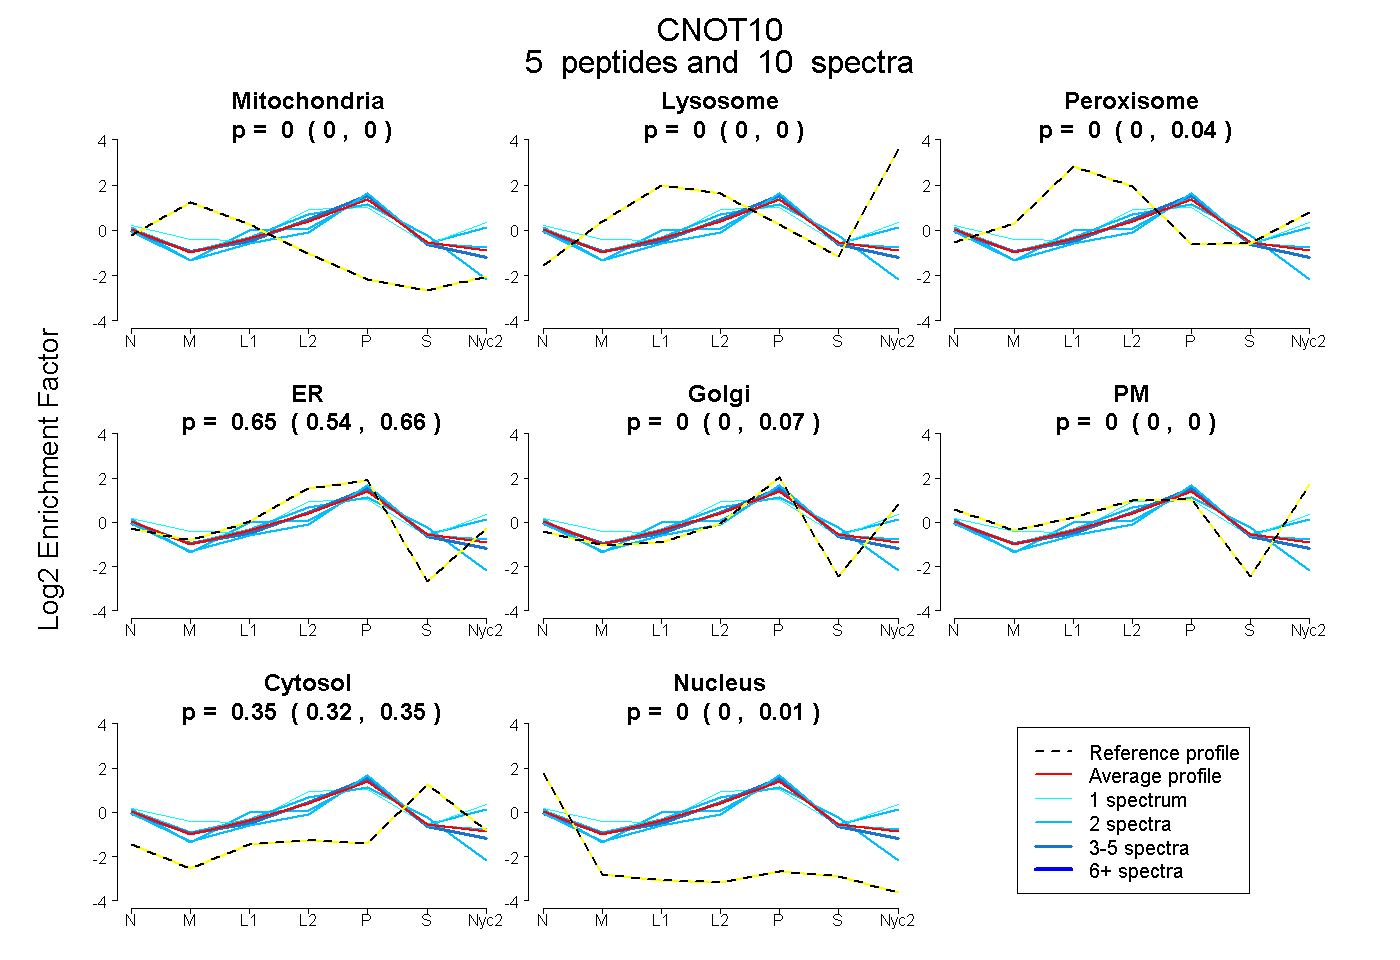
 5
5peptides
spectra
0.000 | 0.000
0.000 | 0.000
0.000 | 0.037
0.542 | 0.658
0.000 | 0.069
0.000 | 0.000
0.318 | 0.355
0.000 | 0.010
| Plot | Mito | Lyso | Perox | ER | Golgi | PM | Cytosol | Nucleus | |||||
| Expt A |
5 peptides |
10 spectra |
|
0.000 0.000 | 0.000 |
0.000 0.000 | 0.000 |
0.005 0.000 | 0.037 |
0.649 0.542 | 0.658 |
0.000 0.000 | 0.069 |
0.000 0.000 | 0.000 |
0.346 0.318 | 0.355 |
0.000 0.000 | 0.010 |
| 1 spectrum, APQCYPSSVNSAR | 0.000 | 0.000 | 0.071 | 0.286 | 0.000 | 0.390 | 0.253 | 0.000 | ||
| 2 spectra, AESAALIEAAK | 0.000 | 0.000 | 0.148 | 0.161 | 0.435 | 0.014 | 0.242 | 0.000 | ||
| 3 spectra, HNLGIFYFK | 0.000 | 0.000 | 0.000 | 0.669 | 0.000 | 0.000 | 0.324 | 0.007 | ||
| 2 spectra, LIPAPPSSPLR | 0.000 | 0.000 | 0.000 | 0.437 | 0.221 | 0.000 | 0.336 | 0.006 | ||
| 2 spectra, GIVQSIVGQGYHR | 0.048 | 0.000 | 0.000 | 0.582 | 0.000 | 0.000 | 0.343 | 0.027 |
| Plot | Lyso | Other | |||||||||||
| Expt C |
6 peptides |
14 spectra |
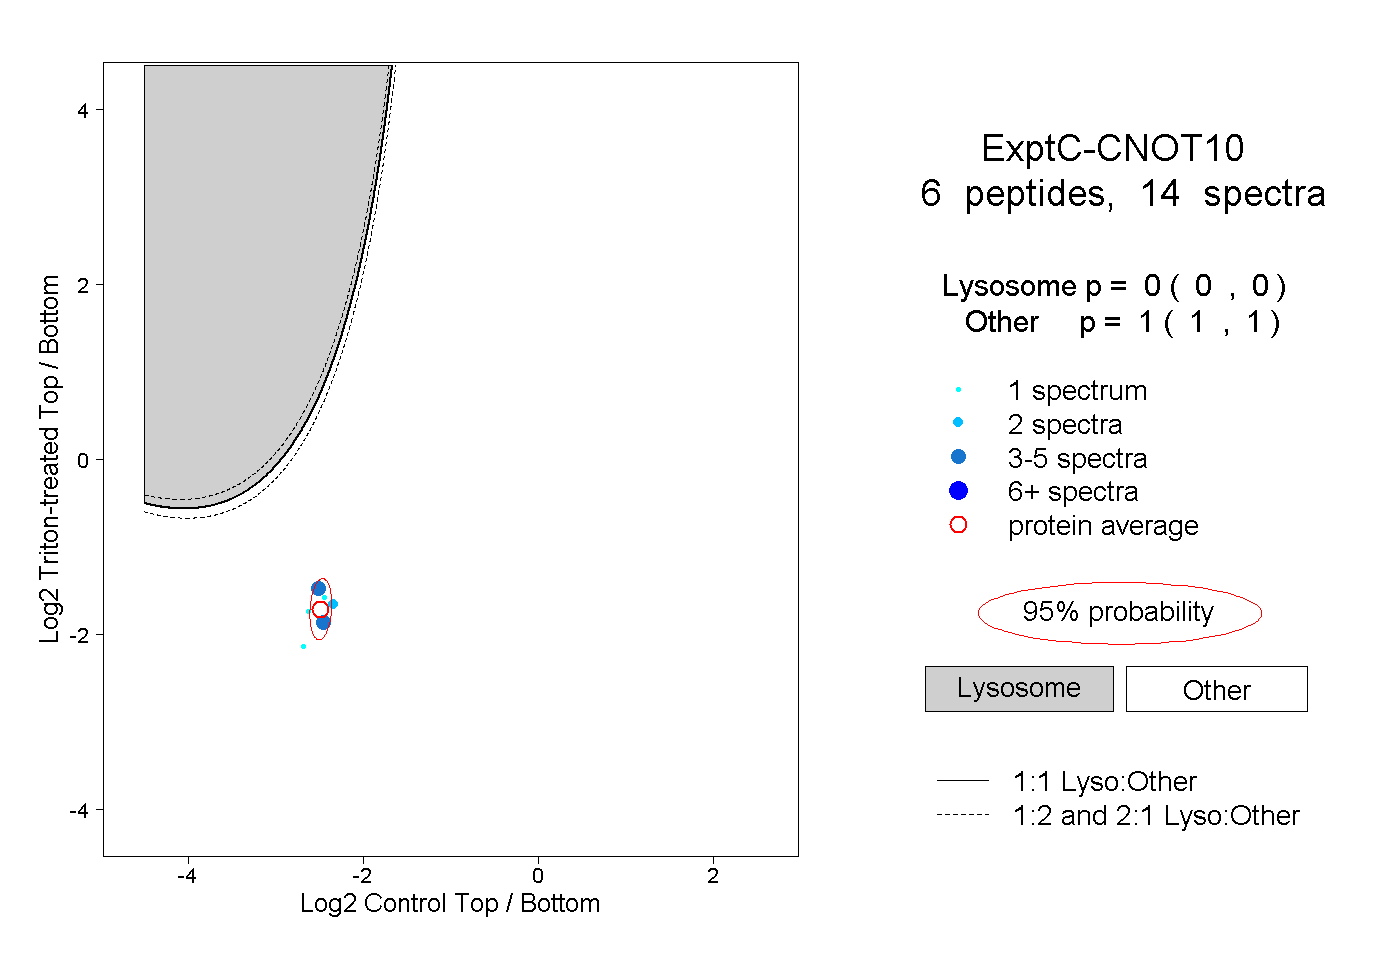 |
0.000 0.000 | 0.000 |
1.000 1.000 | 1.000 |
||||||||
| Plot | Lyso | Other | |||||||||||
| Expt D |
1 peptide |
1 spectrum |
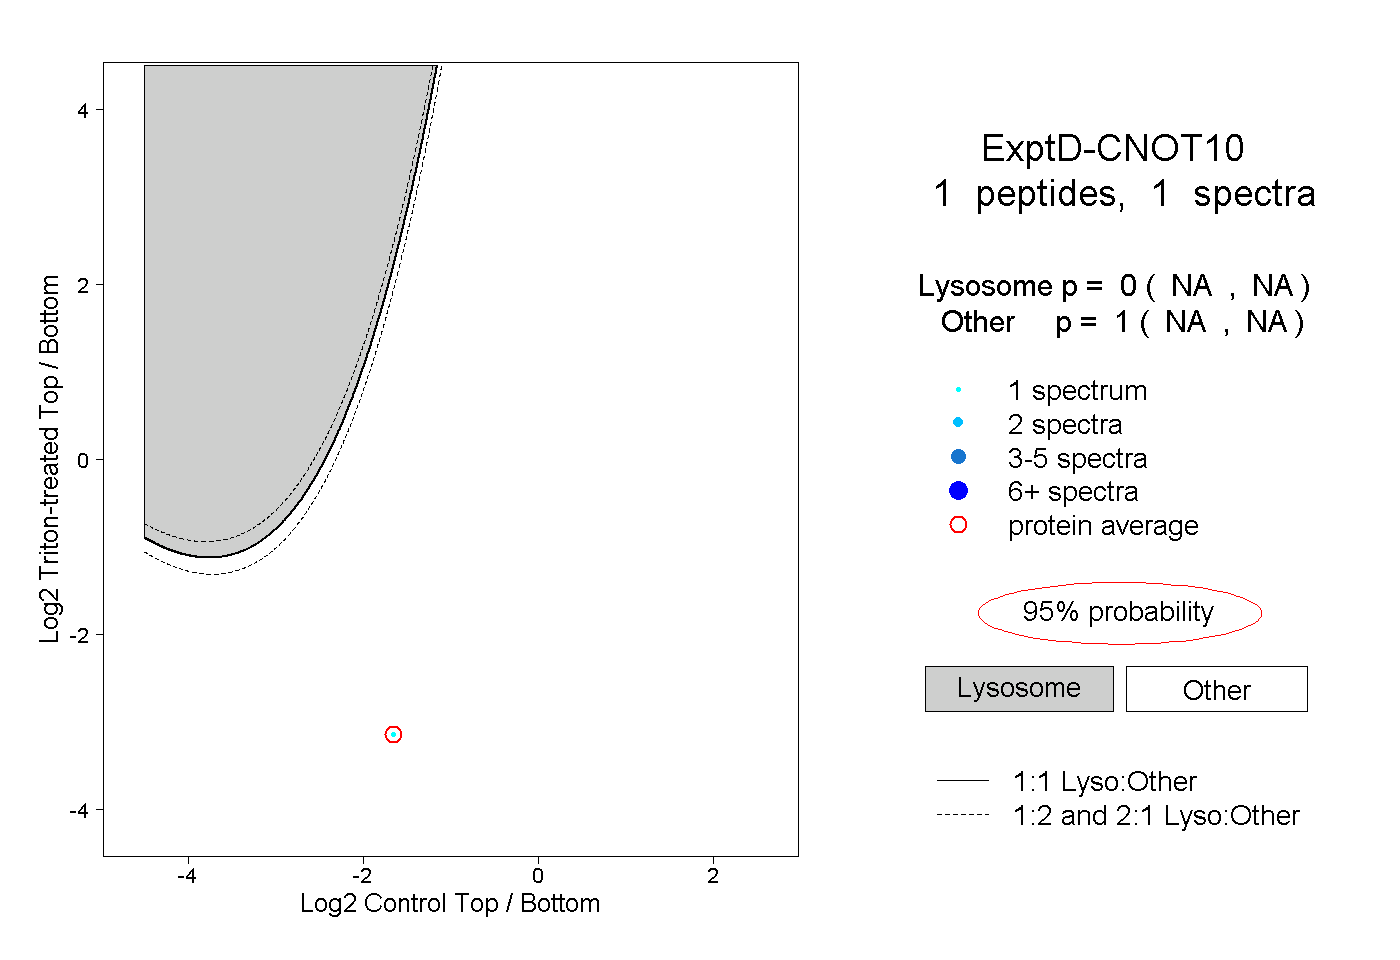 |
0.000 NA | NA |
1.000 NA | NA |