 27
27peptides
spectra
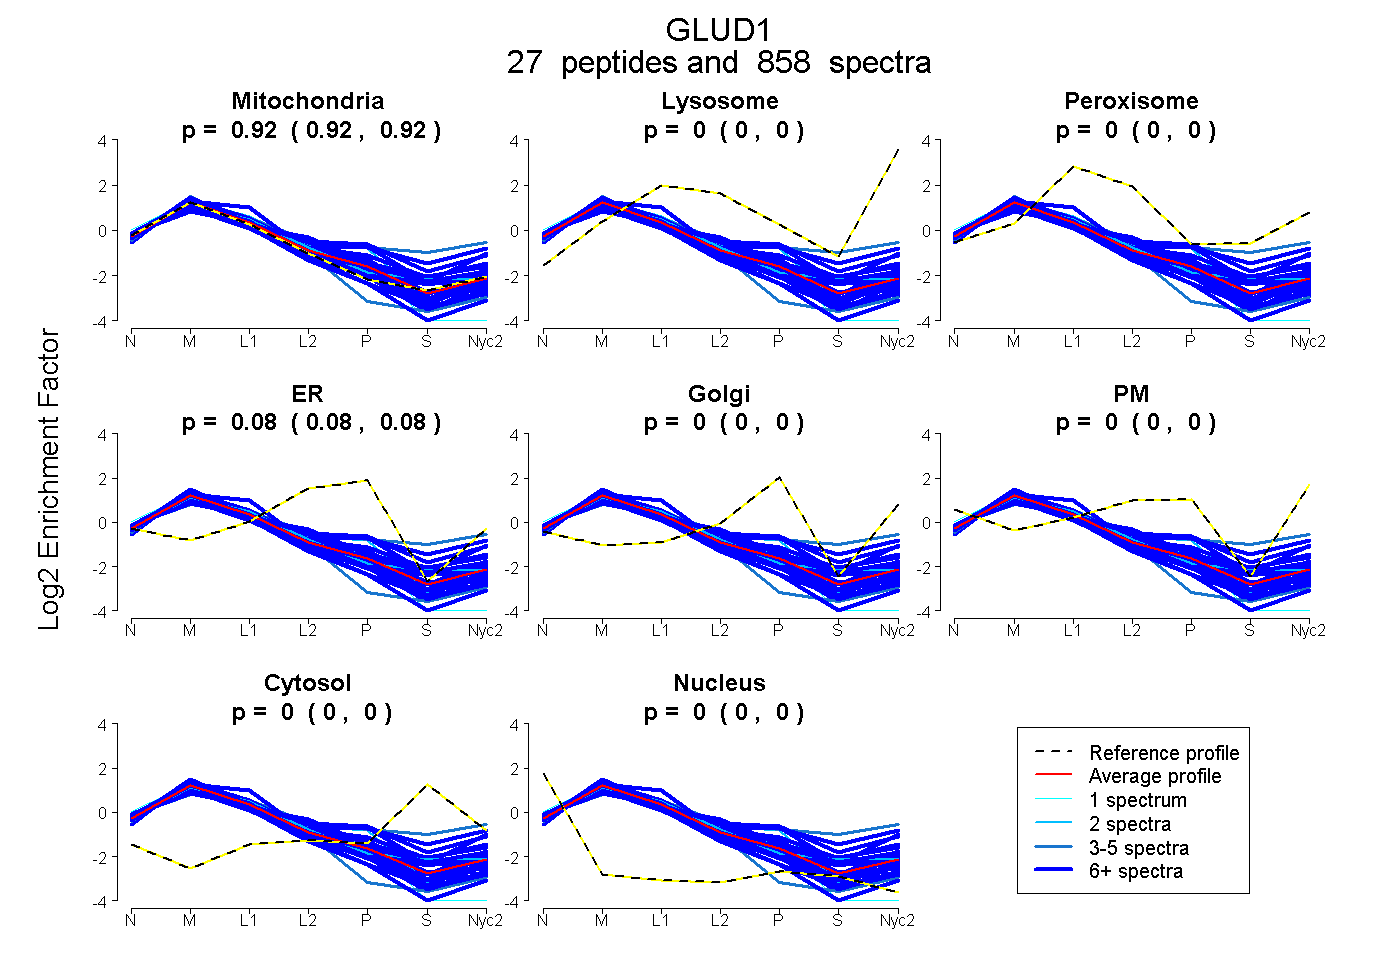
0.917 | 0.919
0.000 | 0.000
0.000 | 0.000
0.081 | 0.083
0.000 | 0.000
0.000 | 0.000
0.000 | 0.000
0.000 | 0.000
22peptides
spectra
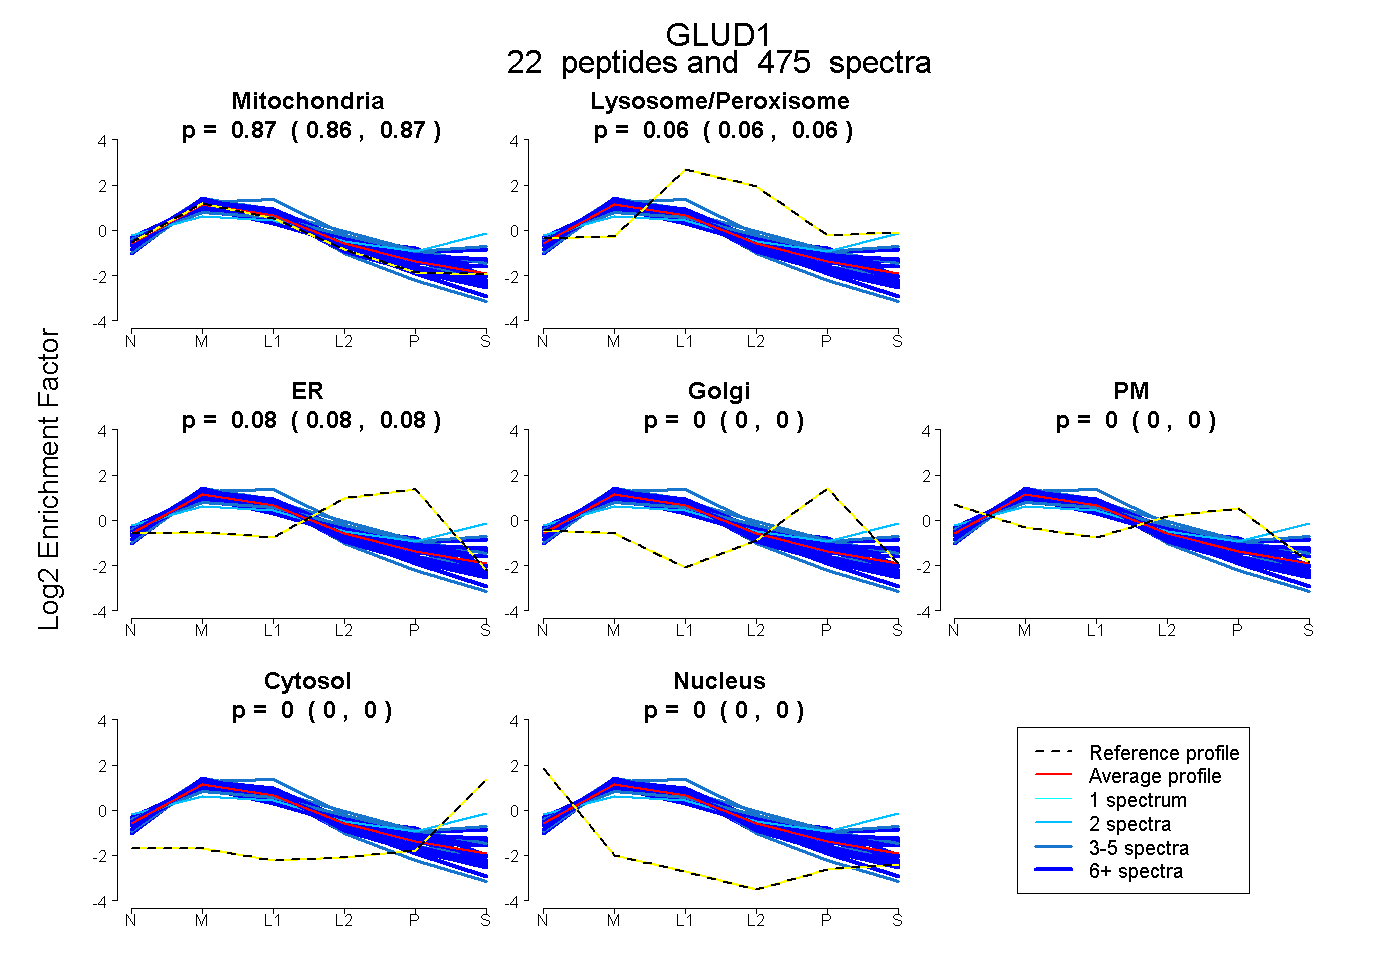
0.864 | 0.867
0.056 | 0.059
0.075 | 0.078
0.000 | 0.000
0.000 | 0.000
0.000 | 0.000
0.000 | 0.000
27peptides
spectra
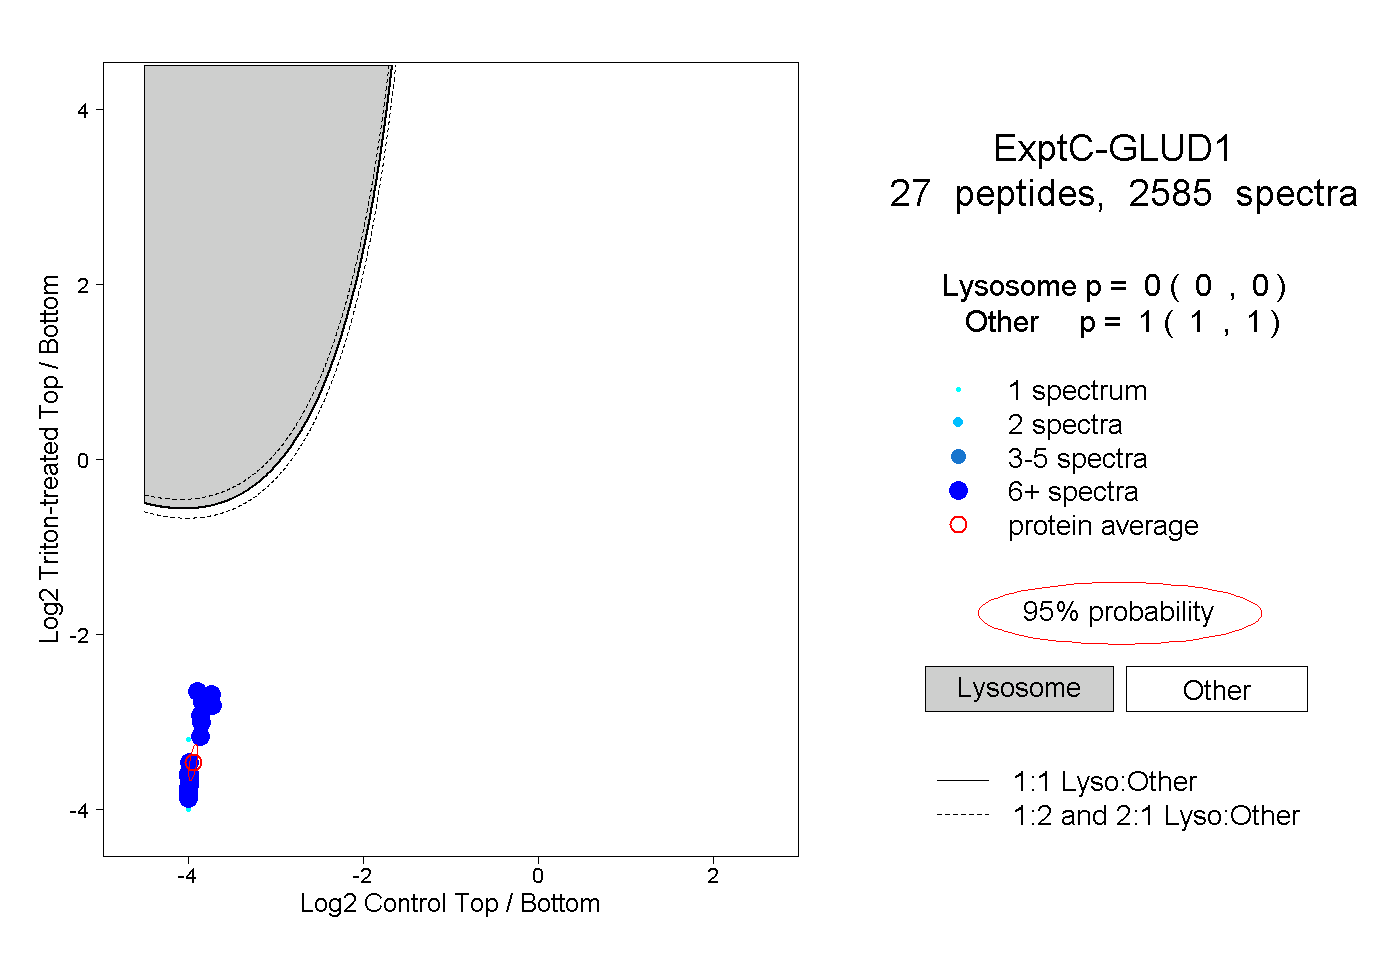
0.000 | 0.000
1.000 | 1.000
22peptides
spectra
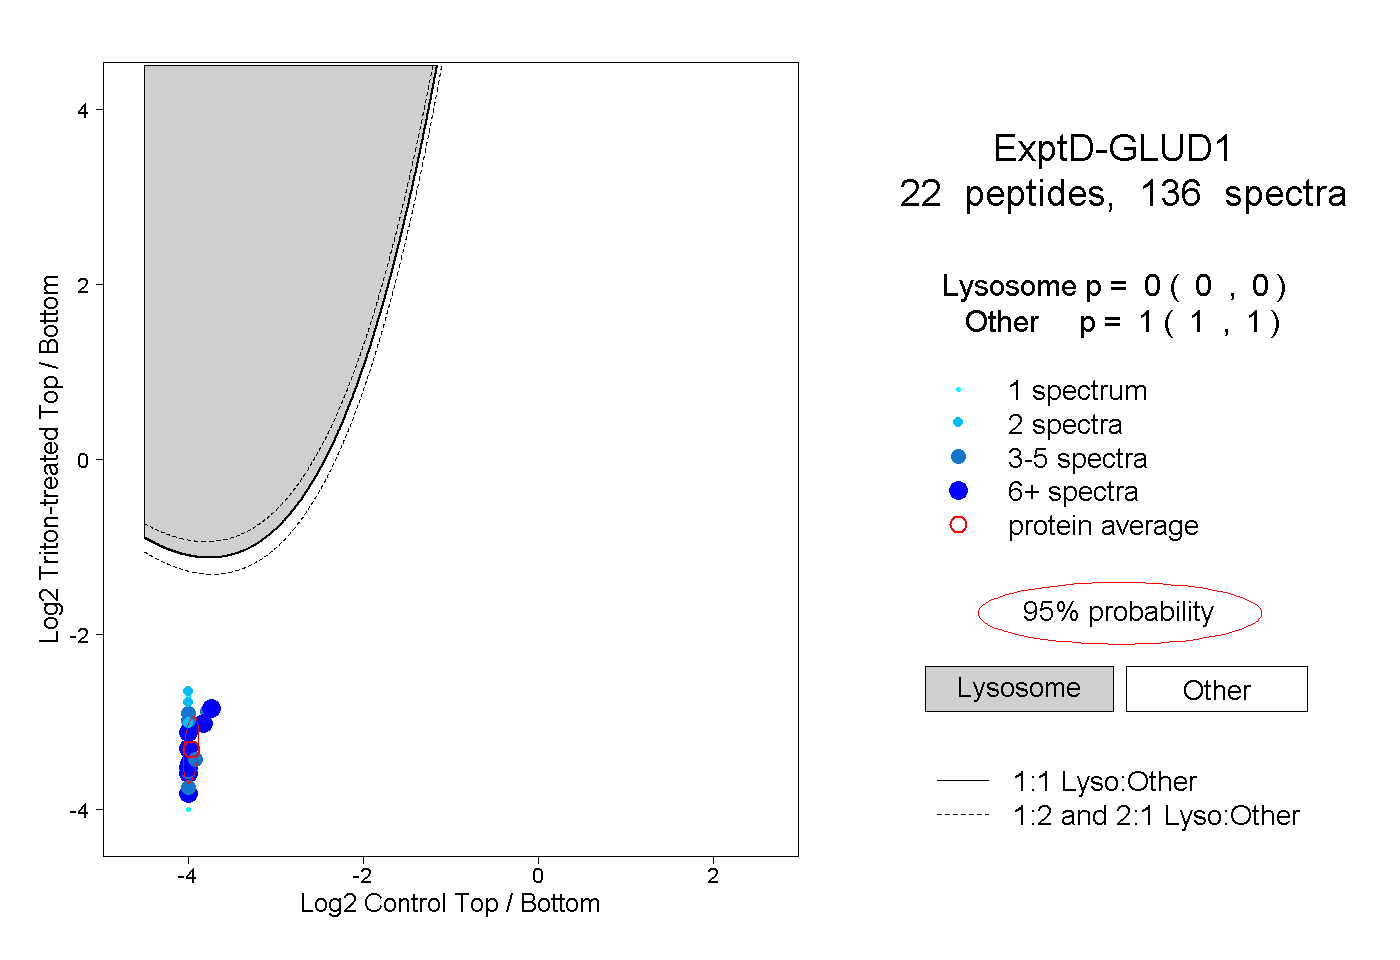
0.000 | 0.000
1.000 | 1.000