 27
27peptides
spectra
0.917 | 0.919
0.000 | 0.000
0.000 | 0.000
0.081 | 0.083
0.000 | 0.000
0.000 | 0.000
0.000 | 0.000
0.000 | 0.000
| Plot | Mito | Lyso | Perox | ER | Golgi | PM | Cytosol | Nucleus | |||||
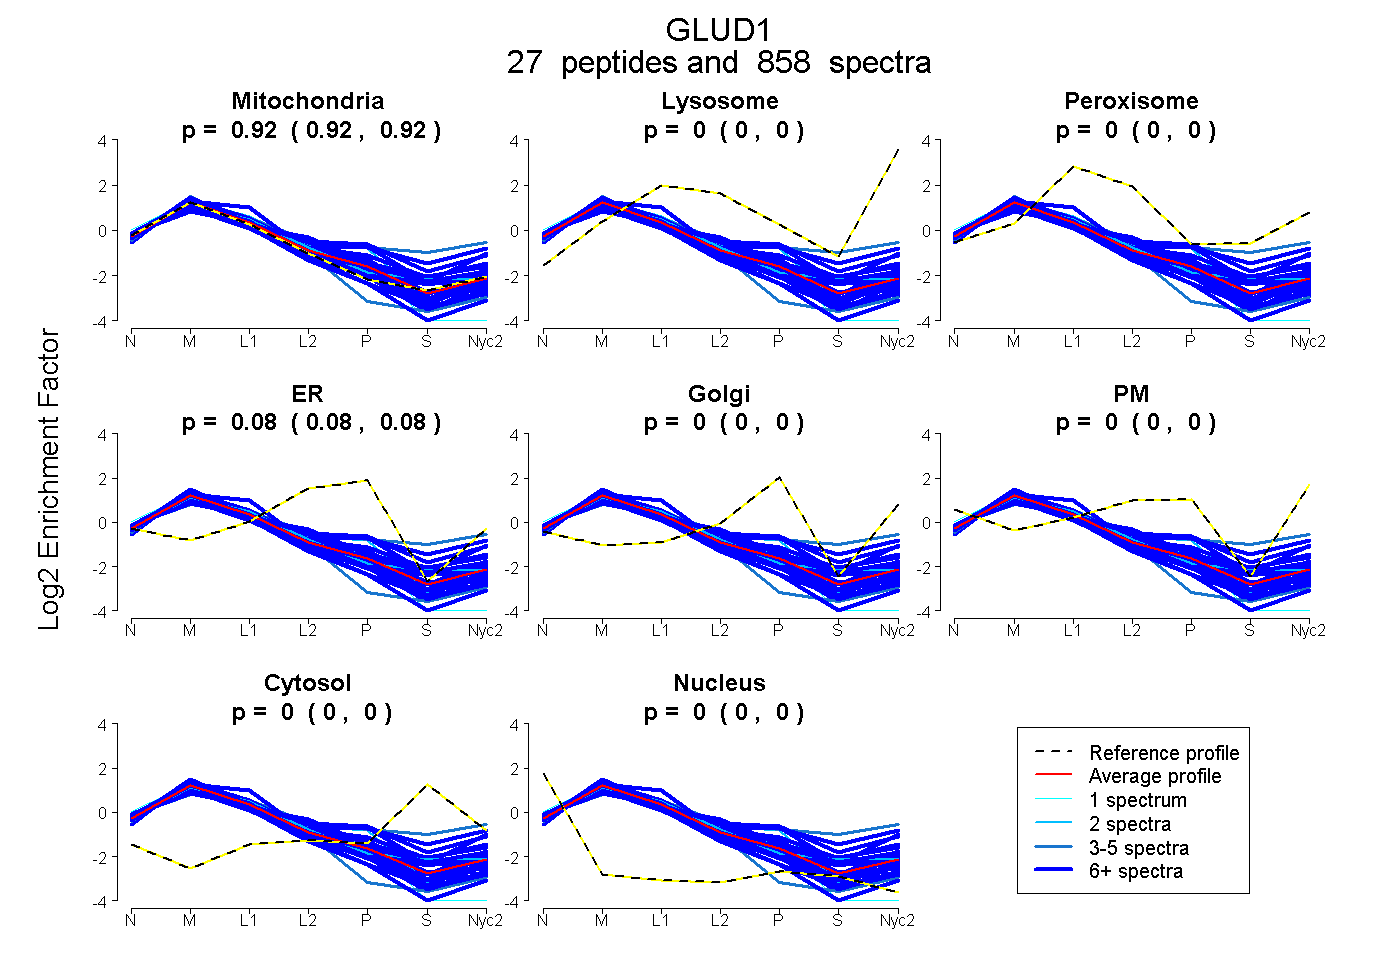
| Expt A |
27 peptides |
858 spectra |
|
0.918 0.917 | 0.919 |
0.000 0.000 | 0.000 |
0.000 0.000 | 0.000 |
0.082 0.081 | 0.083 |
0.000 0.000 | 0.000 |
0.000 0.000 | 0.000 |
0.000 0.000 | 0.000 |
0.000 0.000 | 0.000 |
| 53 spectra, ALASLMTYK | 0.943 | 0.000 | 0.000 | 0.057 | 0.000 | 0.000 | 0.000 | 0.000 | ||
| 33 spectra, YSTDVSVDEVK | 0.933 | 0.000 | 0.000 | 0.056 | 0.000 | 0.000 | 0.000 | 0.011 | ||
| 19 spectra, CAVVDVPFGGAK | 0.957 | 0.000 | 0.000 | 0.000 | 0.000 | 0.000 | 0.031 | 0.012 | ||
| 11 spectra, VYNEAGVTFT | 0.538 | 0.000 | 0.189 | 0.000 | 0.178 | 0.018 | 0.078 | 0.000 | ||
| 4 spectra, CVGVGESDGSIWNPDGIDPK | 0.461 | 0.031 | 0.225 | 0.000 | 0.064 | 0.076 | 0.143 | 0.000 | ||
| 8 spectra, GFIGPGIDVPAPDMSTGER | 0.989 | 0.000 | 0.000 | 0.000 | 0.000 | 0.000 | 0.000 | 0.011 | ||
| 2 spectra, VYEGSILEADCDILIPAASEK | 0.890 | 0.000 | 0.071 | 0.002 | 0.000 | 0.000 | 0.037 | 0.000 | ||
| 68 spectra, NYTDNELEK | 0.988 | 0.000 | 0.000 | 0.000 | 0.000 | 0.000 | 0.000 | 0.012 | ||
| 32 spectra, DSNYHLLMSVQESLER | 0.901 | 0.000 | 0.000 | 0.095 | 0.000 | 0.000 | 0.000 | 0.004 | ||
| 1 spectrum, EDDPNFFK | 0.917 | 0.000 | 0.000 | 0.000 | 0.000 | 0.000 | 0.000 | 0.083 | ||
| 24 spectra, ISATGR | 0.945 | 0.000 | 0.000 | 0.000 | 0.000 | 0.000 | 0.000 | 0.055 | ||
| 17 spectra, GASIVEDK | 0.920 | 0.000 | 0.000 | 0.080 | 0.000 | 0.000 | 0.000 | 0.000 | ||
| 2 spectra, AQHSQHR | 0.809 | 0.000 | 0.000 | 0.191 | 0.000 | 0.000 | 0.000 | 0.000 | ||
| 58 spectra, YNLGLDLR | 0.875 | 0.000 | 0.034 | 0.000 | 0.070 | 0.000 | 0.021 | 0.000 | ||
| 22 spectra, TAAYVNAIEK | 0.926 | 0.000 | 0.028 | 0.026 | 0.000 | 0.000 | 0.020 | 0.000 | ||
| 14 spectra, FTMELAK | 1.000 | 0.000 | 0.000 | 0.000 | 0.000 | 0.000 | 0.000 | 0.000 | ||
| 15 spectra, NLNHVSYGR | 0.615 | 0.000 | 0.115 | 0.000 | 0.247 | 0.000 | 0.023 | 0.000 | ||
| 15 spectra, LVEDLK | 1.000 | 0.000 | 0.000 | 0.000 | 0.000 | 0.000 | 0.000 | 0.000 | ||
| 17 spectra, LQHGSILGFPK | 0.671 | 0.031 | 0.083 | 0.000 | 0.202 | 0.013 | 0.000 | 0.000 | ||
| 70 spectra, DDGSWEVIEGYR | 0.979 | 0.000 | 0.000 | 0.000 | 0.000 | 0.000 | 0.000 | 0.021 | ||
| 98 spectra, DIVHSGLAYTMER | 0.747 | 0.000 | 0.088 | 0.000 | 0.151 | 0.000 | 0.014 | 0.000 | ||
| 11 spectra, IIKPCNHVLSLSFPIR | 0.957 | 0.000 | 0.000 | 0.043 | 0.000 | 0.000 | 0.000 | 0.000 | ||
| 109 spectra, MVEGFFDR | 0.928 | 0.000 | 0.000 | 0.047 | 0.025 | 0.000 | 0.000 | 0.000 | ||
| 35 spectra, HGGTIPVVPTAEFQDR | 0.743 | 0.000 | 0.089 | 0.114 | 0.000 | 0.002 | 0.052 | 0.000 | ||
| 24 spectra, ISGASEK | 0.930 | 0.000 | 0.000 | 0.018 | 0.000 | 0.000 | 0.000 | 0.051 | ||
| 4 spectra, IIAEGANGPTTPEADK | 0.965 | 0.000 | 0.000 | 0.000 | 0.000 | 0.000 | 0.000 | 0.035 | ||
| 92 spectra, TFVVQGFGNVGLHSMR | 0.821 | 0.003 | 0.000 | 0.176 | 0.000 | 0.000 | 0.000 | 0.000 |
| Plot | Mito | Lyso or Perox | ER | Golgi | PM | Cytosol | Nucleus | ||||||
| Expt B |
22 peptides |
475 spectra |
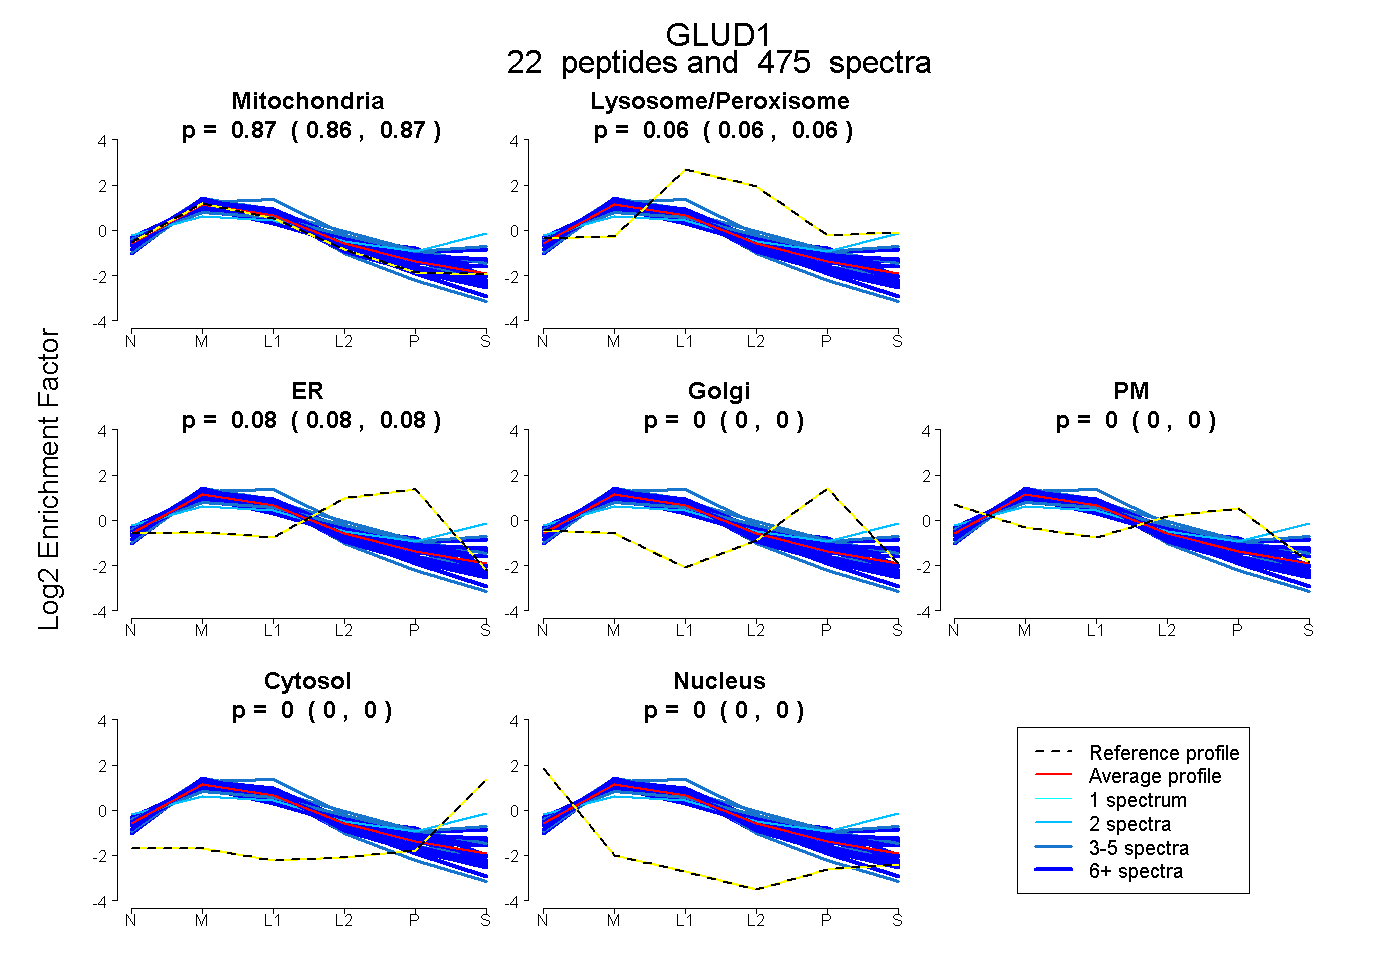 |
0.865 0.864 | 0.867 |
0.058 0.056 | 0.059 |
0.077 0.075 | 0.078 |
0.000 0.000 | 0.000 |
0.000 0.000 | 0.000 |
0.000 0.000 | 0.000 |
0.000 0.000 | 0.000 |
|||
| Plot | Lyso | Other | |||||||||||
| Expt C |
27 peptides |
2585 spectra |
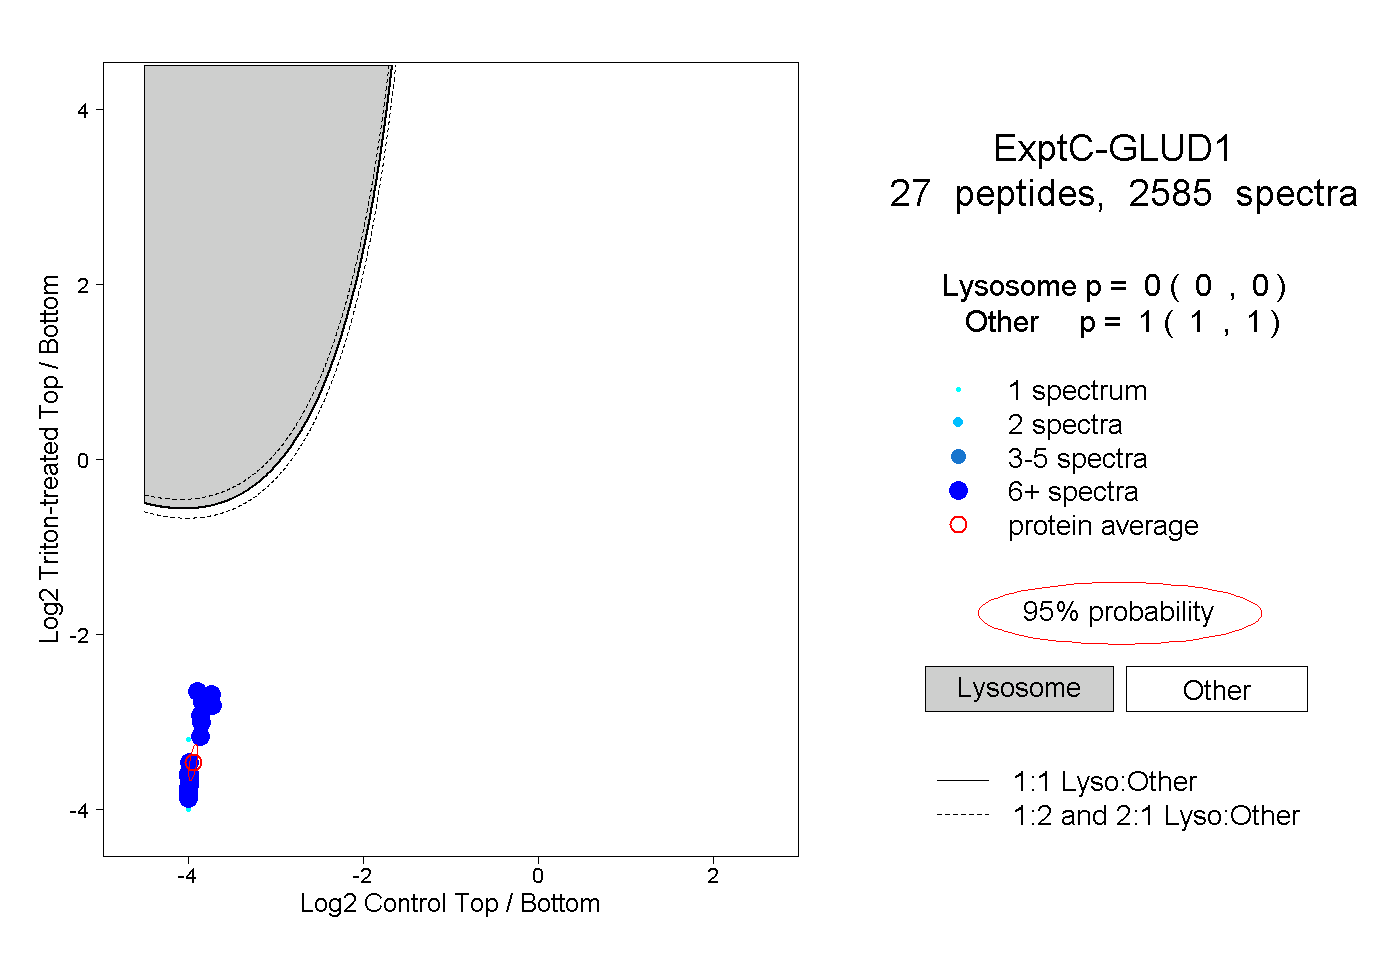 |
0.000 0.000 | 0.000 |
1.000 1.000 | 1.000 |
||||||||
| Plot | Lyso | Other | |||||||||||
| Expt D |
22 peptides |
136 spectra |
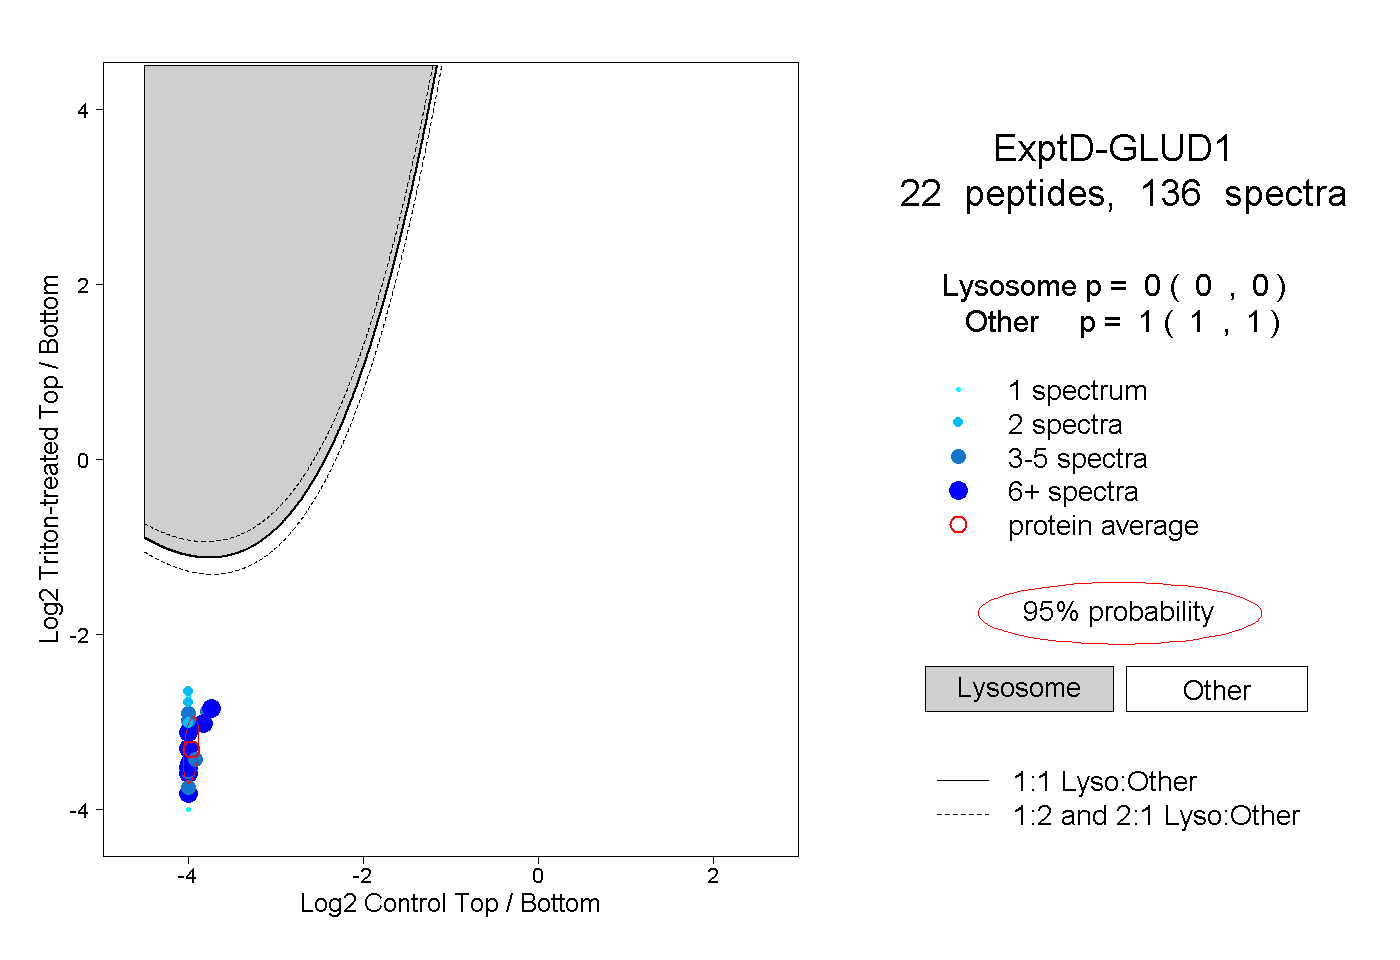 |
0.000 0.000 | 0.000 |
1.000 1.000 | 1.000 |