 5
5peptides
spectra
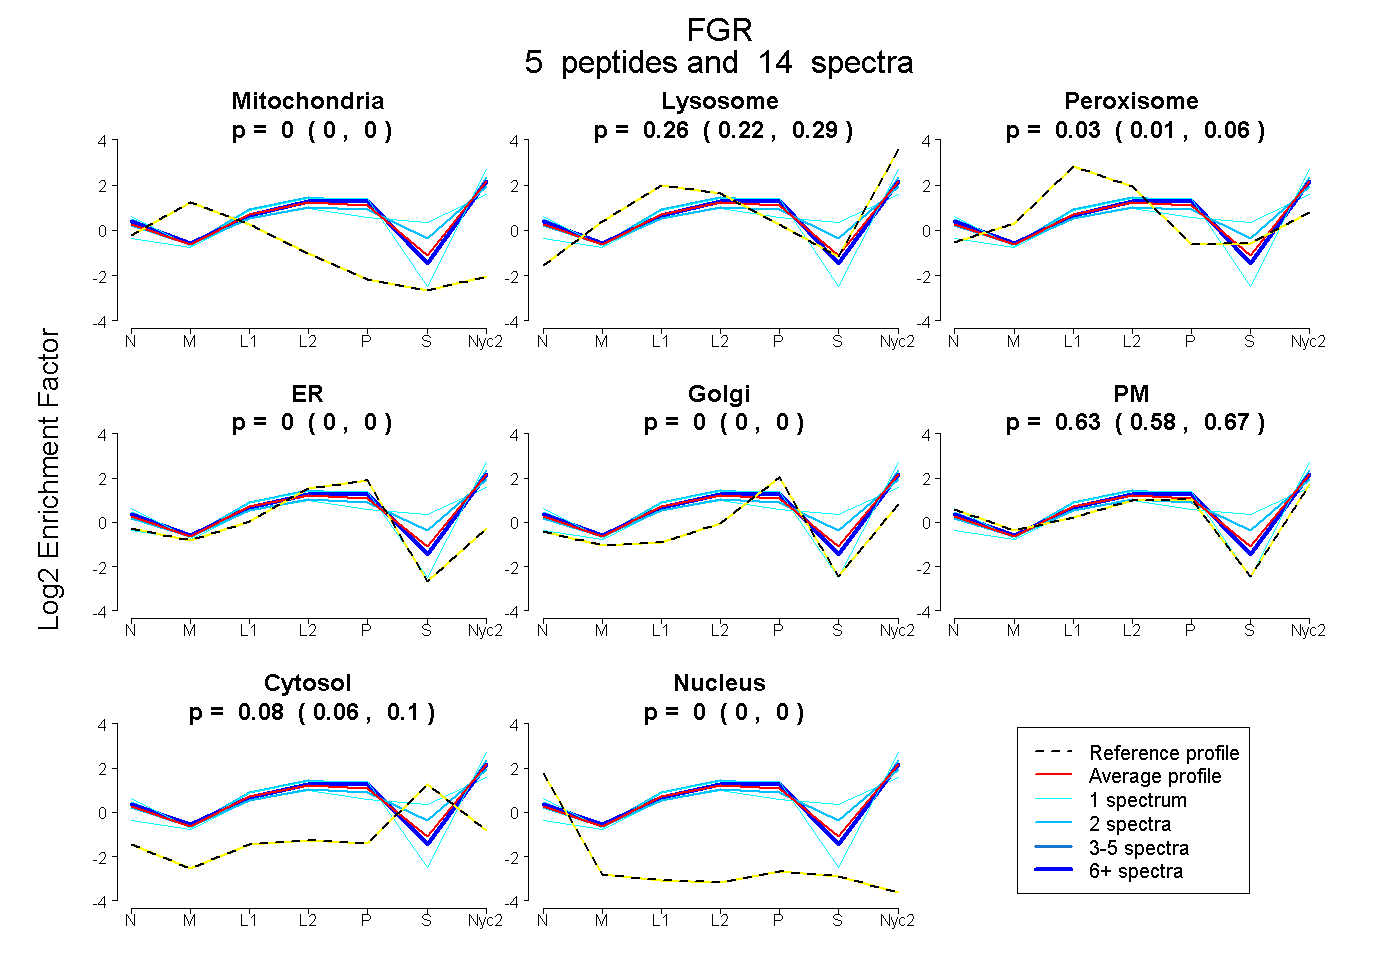
0.000 | 0.000
0.218 | 0.290
0.008 | 0.059
0.000 | 0.000
0.000 | 0.000
0.577 | 0.668
0.056 | 0.096
0.000 | 0.000
10peptides
spectra
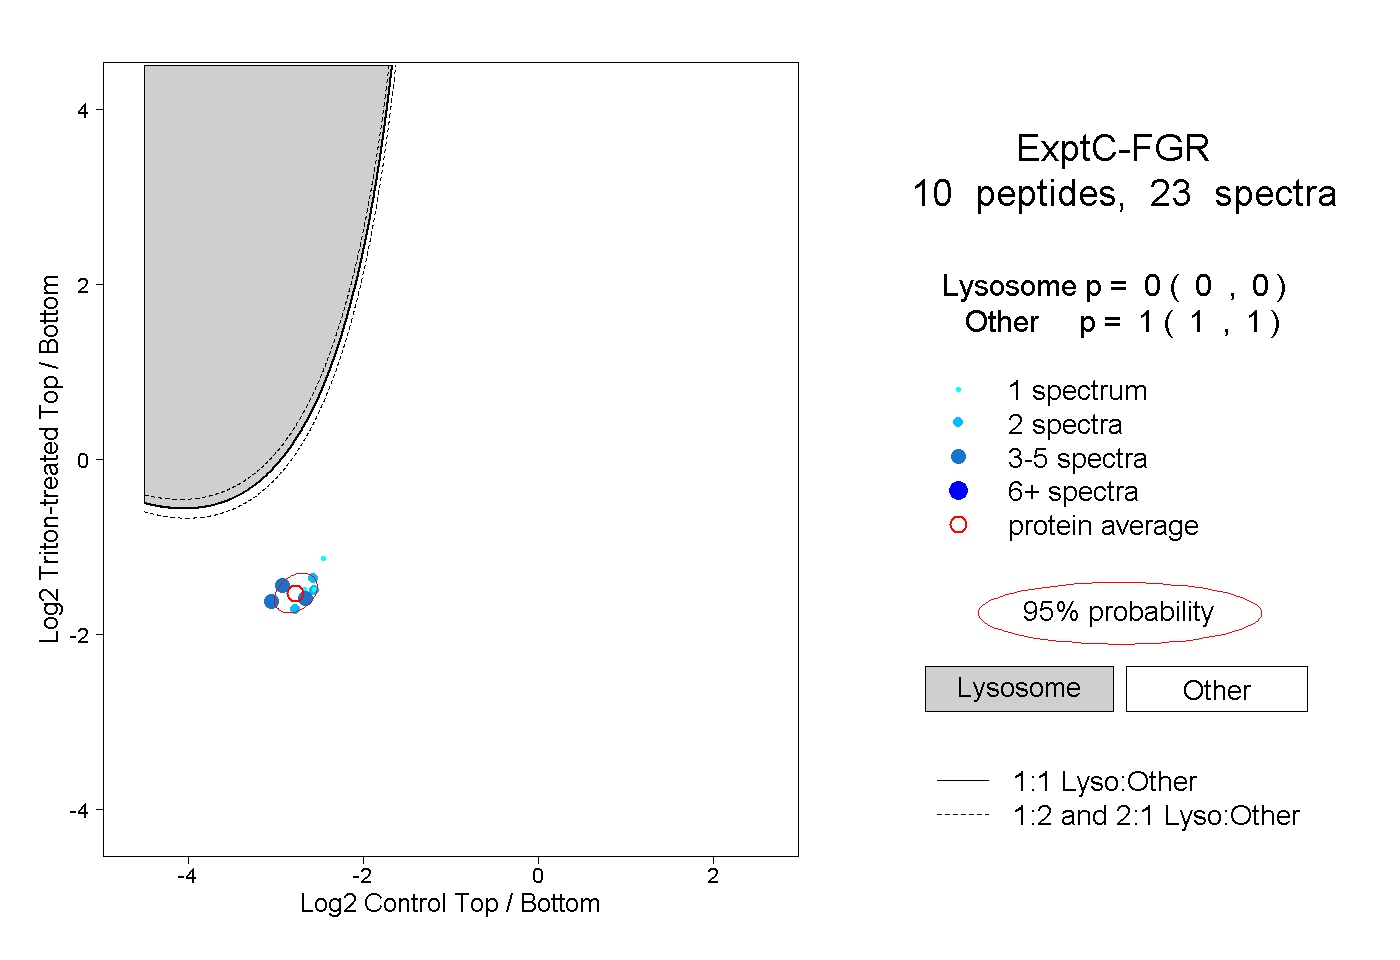
0.000 | 0.000
1.000 | 1.000
1peptide
spectrum
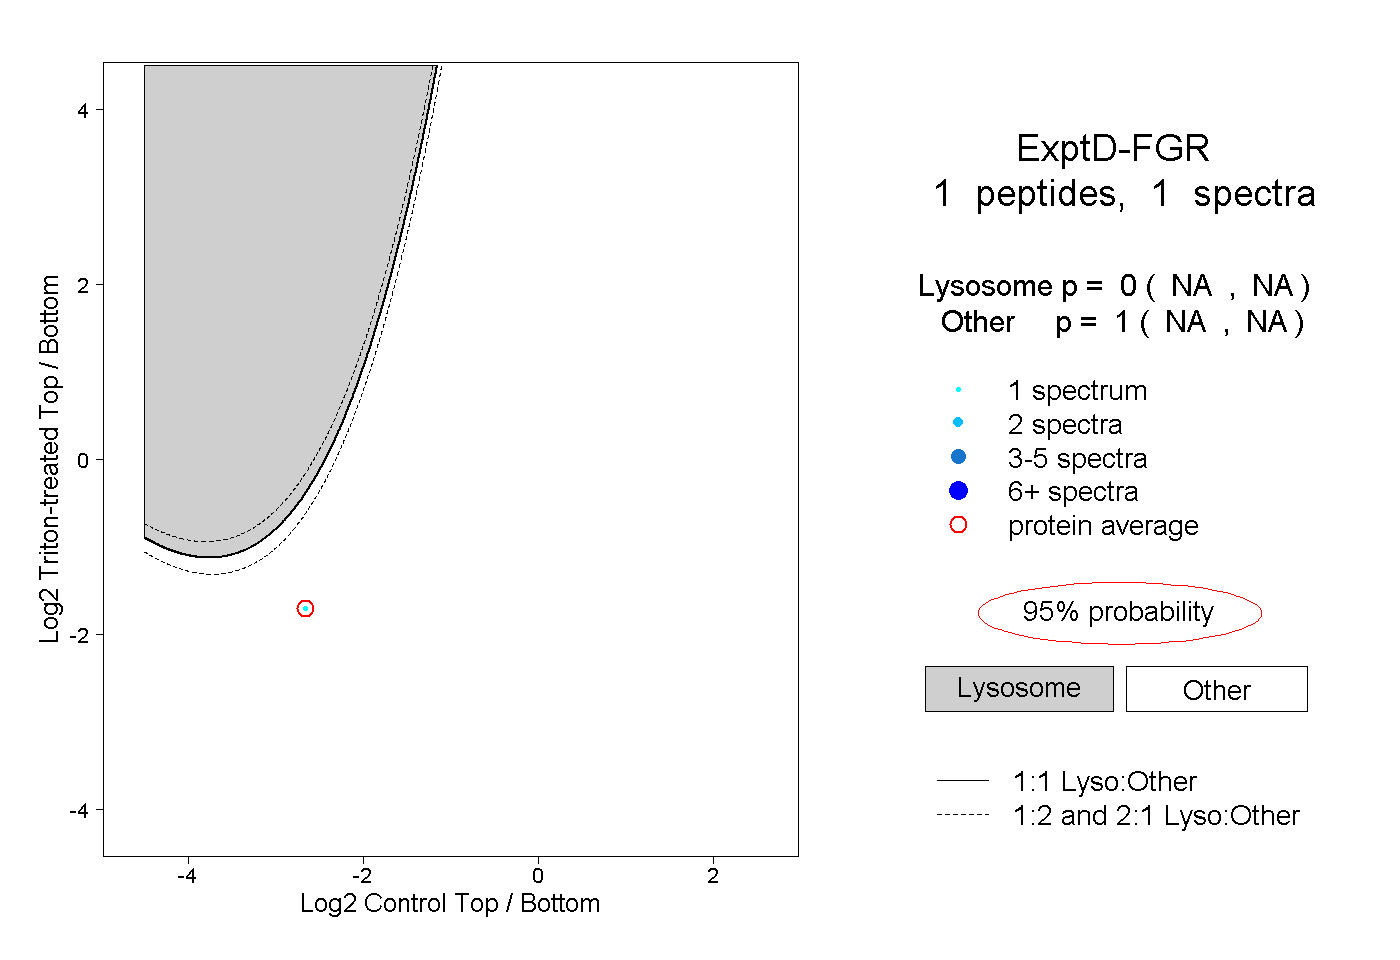
NA | NA
NA | NA