 5
5peptides
spectra
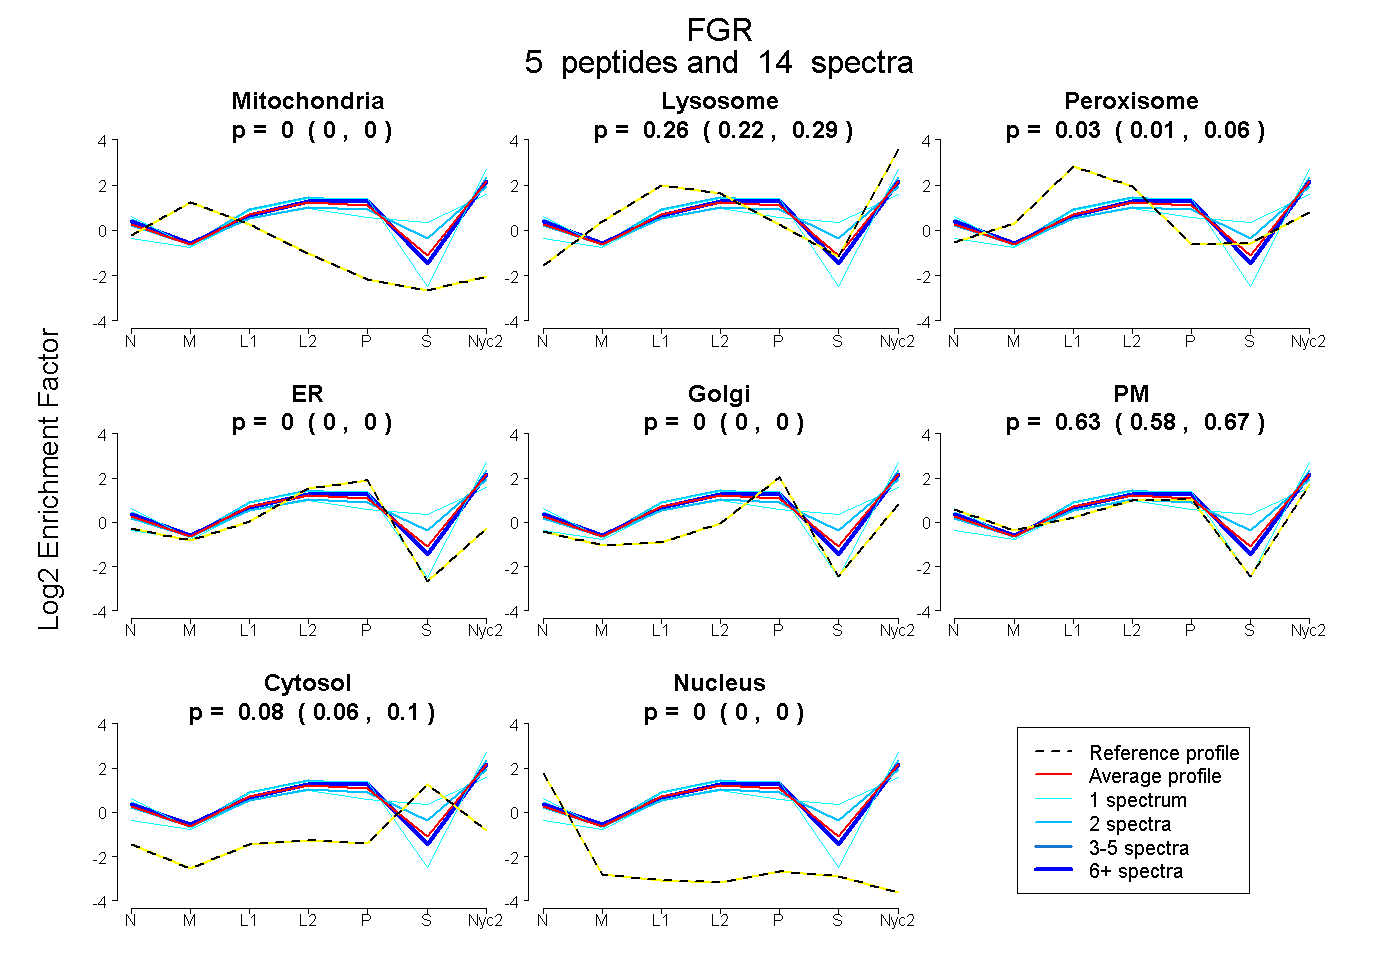
0.000 | 0.000
0.218 | 0.290
0.008 | 0.059
0.000 | 0.000
0.000 | 0.000
0.577 | 0.668
0.056 | 0.096
0.000 | 0.000
10peptides
spectra
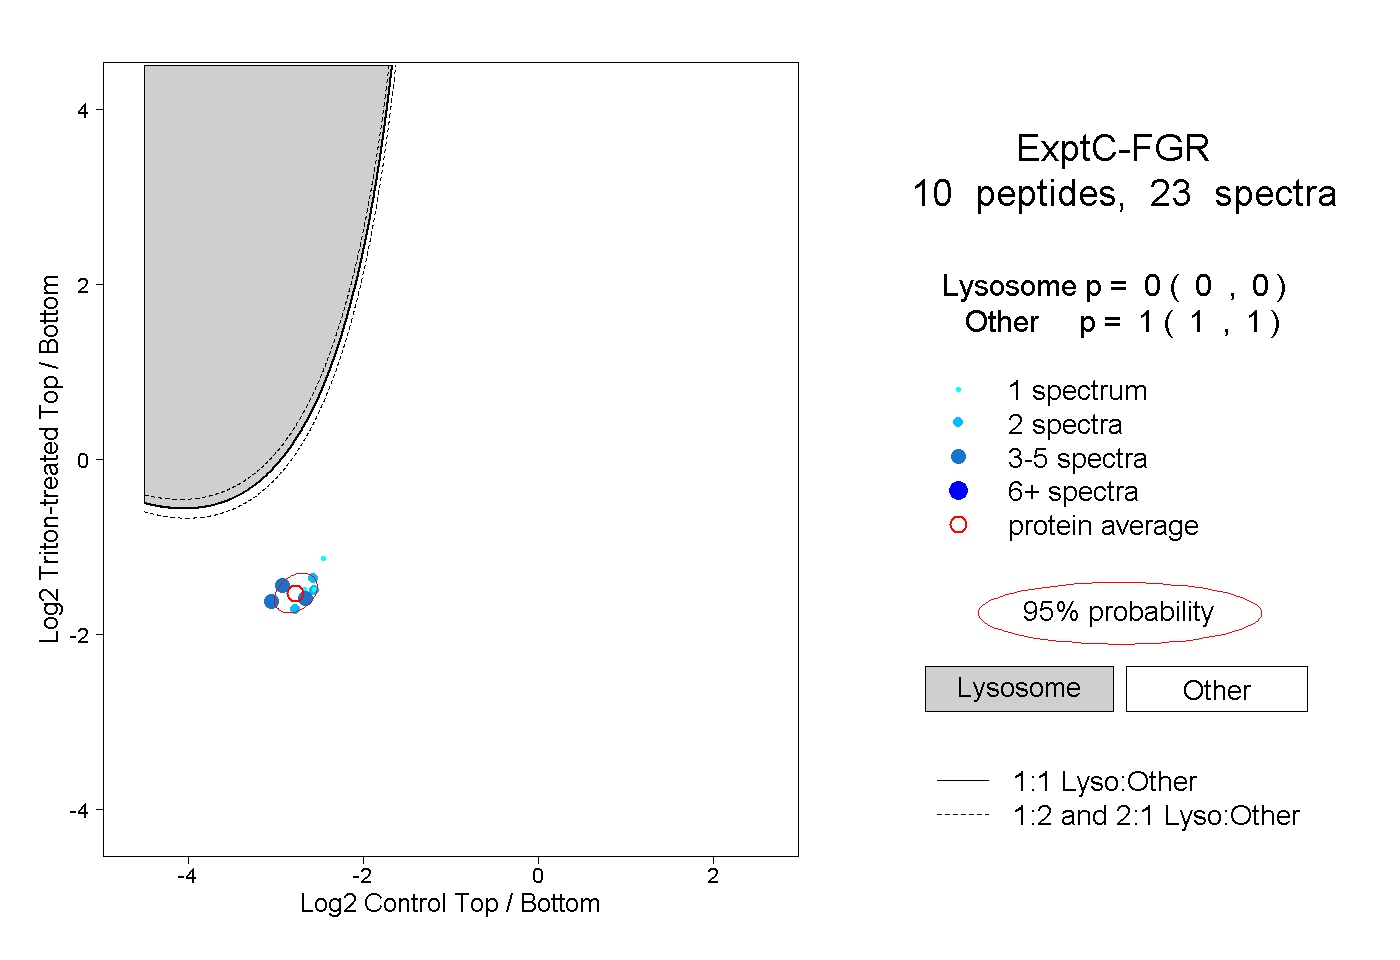
0.000 | 0.000
1.000 | 1.000
| Plot | Mito | Lyso | Perox | ER | Golgi | PM | Cytosol | Nucleus | |||||
| Expt A |
5 peptides |
14 spectra |
|
0.000 0.000 | 0.000 |
0.258 0.218 | 0.290 |
0.035 0.008 | 0.059 |
0.000 0.000 | 0.000 |
0.000 0.000 | 0.000 |
0.630 0.577 | 0.668 |
0.078 0.056 | 0.096 |
0.000 0.000 | 0.000 |
||
| Plot | Lyso | Other | |||||||||||
| Expt C |
10 peptides |
23 spectra |
|
0.000 0.000 | 0.000 |
1.000 1.000 | 1.000 |
| 2 spectra, DAWEIDR | 0.000 | 1.000 | ||||||||
| 1 spectrum, NSIALDR | 0.000 | 1.000 | ||||||||
| 4 spectra, YYPDPTQGR | 0.000 | 1.000 | ||||||||
| 5 spectra, EDVGLEGDFR | 0.000 | 1.000 | ||||||||
| 2 spectra, AQFESVQDLVR | 0.000 | 1.000 | ||||||||
| 4 spectra, TLKPGTMSPK | 0.000 | 1.000 | ||||||||
| 1 spectrum, AANILVGEHLICK | 0.000 | 1.000 | ||||||||
| 1 spectrum, TGDDLTFTK | 0.000 | 1.000 | ||||||||
| 1 spectrum, LIVDDEYNPQQGTK | 0.000 | 1.000 | ||||||||
| 2 spectra, VPYPGMNNR | 0.000 | 1.000 |
| Plot | Lyso | Other | |||||||||||
| Expt D |
1 peptide |
1 spectrum |
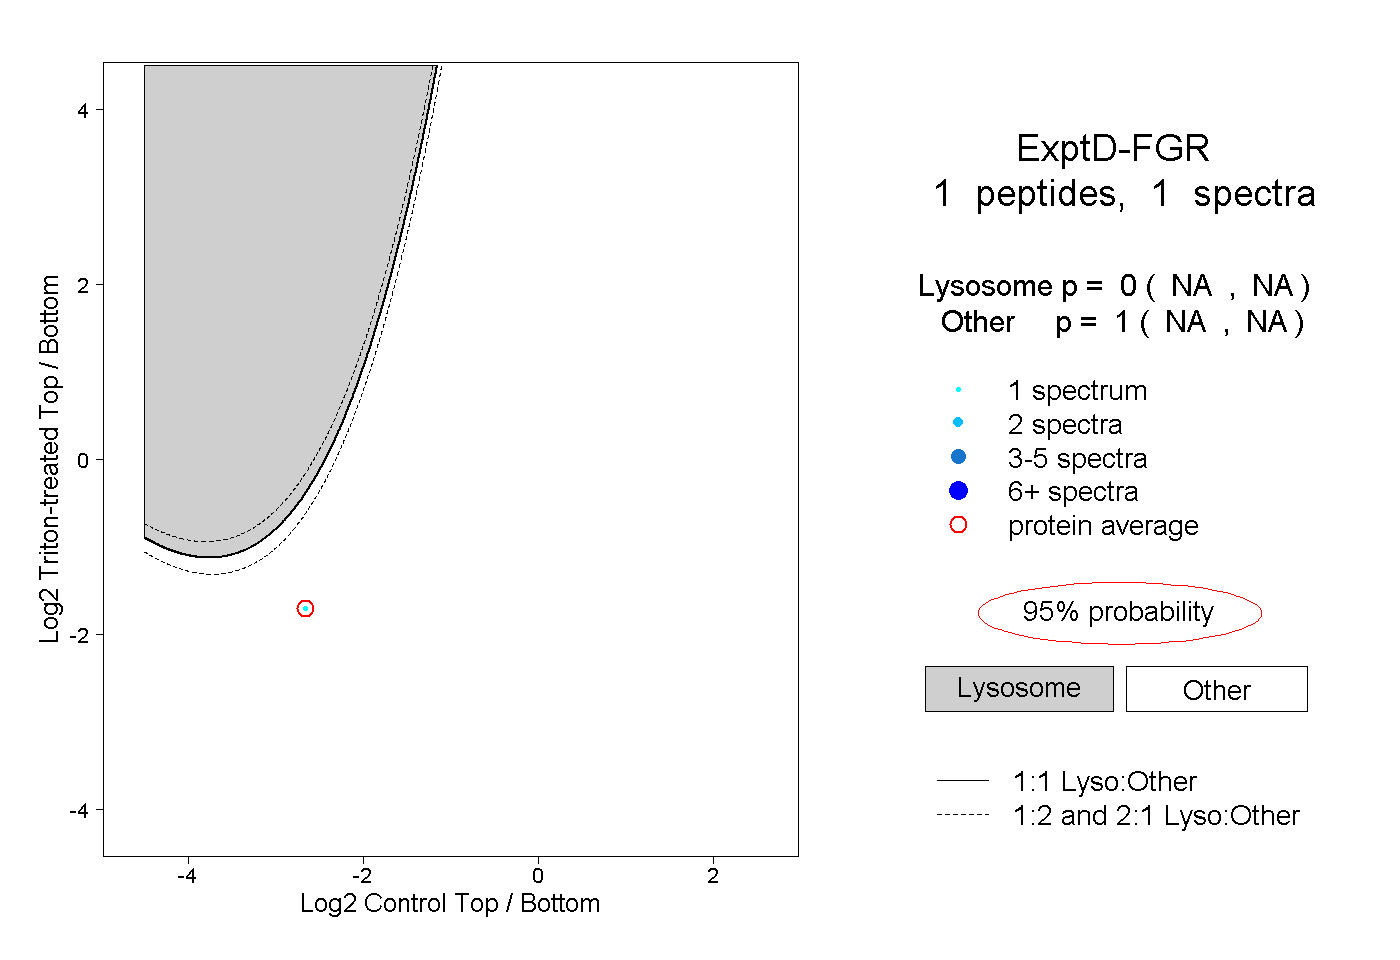 |
0.000 NA | NA |
1.000 NA | NA |