 5
5peptides
spectra
0.000 | 0.000
0.218 | 0.290
0.008 | 0.059
0.000 | 0.000
0.000 | 0.000
0.577 | 0.668
0.056 | 0.096
0.000 | 0.000
| Plot | Mito | Lyso | Perox | ER | Golgi | PM | Cytosol | Nucleus | |||||
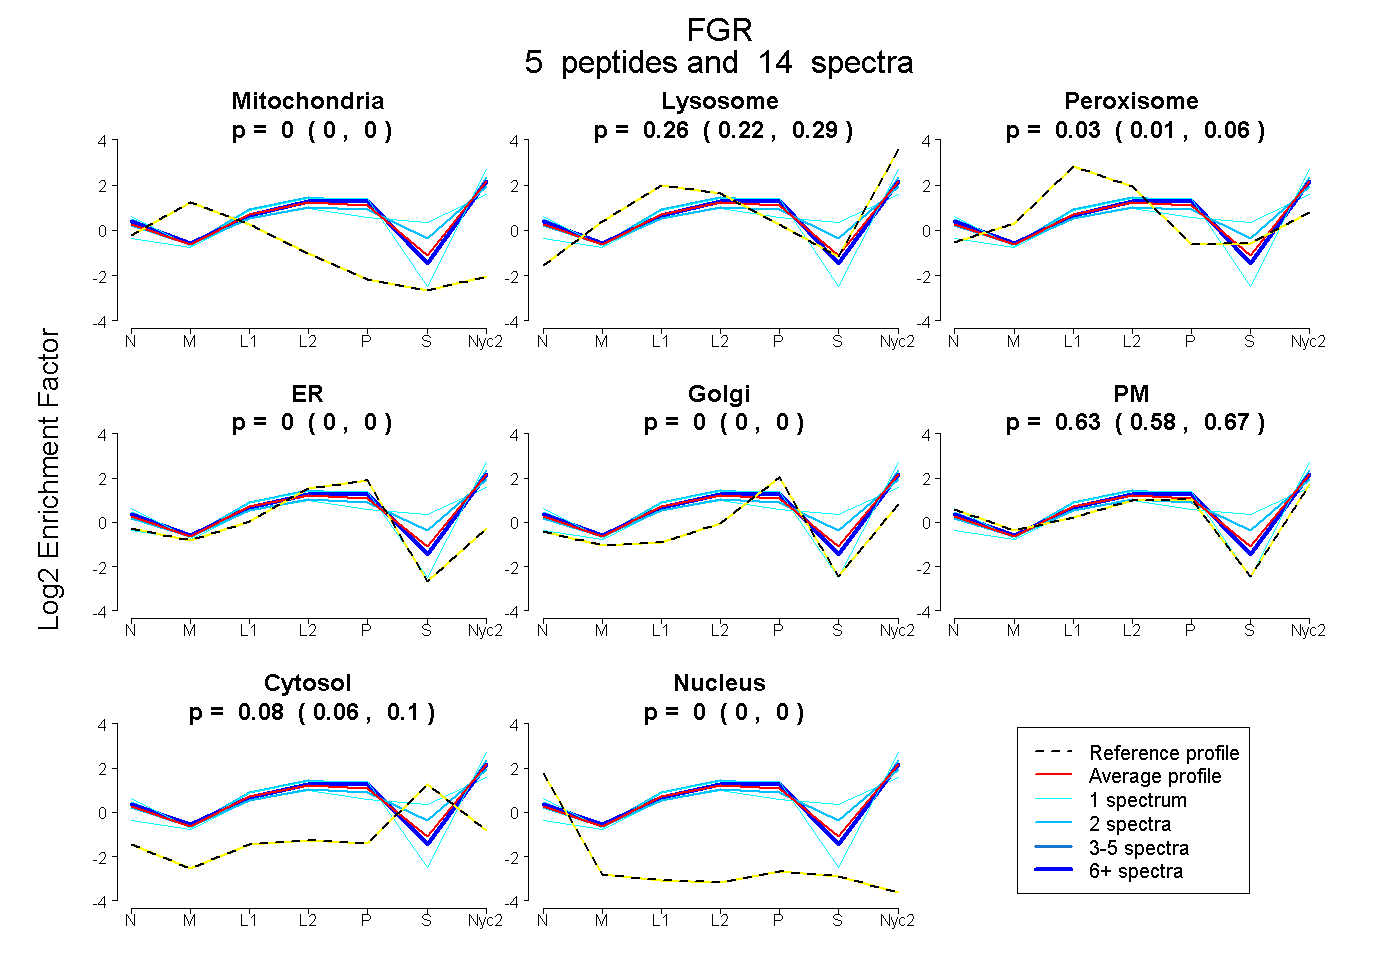
| Expt A |
5 peptides |
14 spectra |
|
0.000 0.000 | 0.000 |
0.258 0.218 | 0.290 |
0.035 0.008 | 0.059 |
0.000 0.000 | 0.000 |
0.000 0.000 | 0.000 |
0.630 0.577 | 0.668 |
0.078 0.056 | 0.096 |
0.000 0.000 | 0.000 |
| 8 spectra, DAWEIDR | 0.000 | 0.214 | 0.013 | 0.000 | 0.000 | 0.745 | 0.028 | 0.000 | ||
| 1 spectrum, WTAPEAALFGR | 0.000 | 0.184 | 0.000 | 0.000 | 0.000 | 0.816 | 0.000 | 0.000 | ||
| 2 spectra, AQFESVQDLVR | 0.000 | 0.243 | 0.036 | 0.000 | 0.000 | 0.721 | 0.000 | 0.000 | ||
| 1 spectrum, AFLEEAQIMK | 0.000 | 0.323 | 0.135 | 0.000 | 0.000 | 0.237 | 0.304 | 0.000 | ||
| 2 spectra, SLSSGR | 0.000 | 0.271 | 0.059 | 0.000 | 0.000 | 0.490 | 0.180 | 0.000 |
| Plot | Lyso | Other | |||||||||||
| Expt C |
10 peptides |
23 spectra |
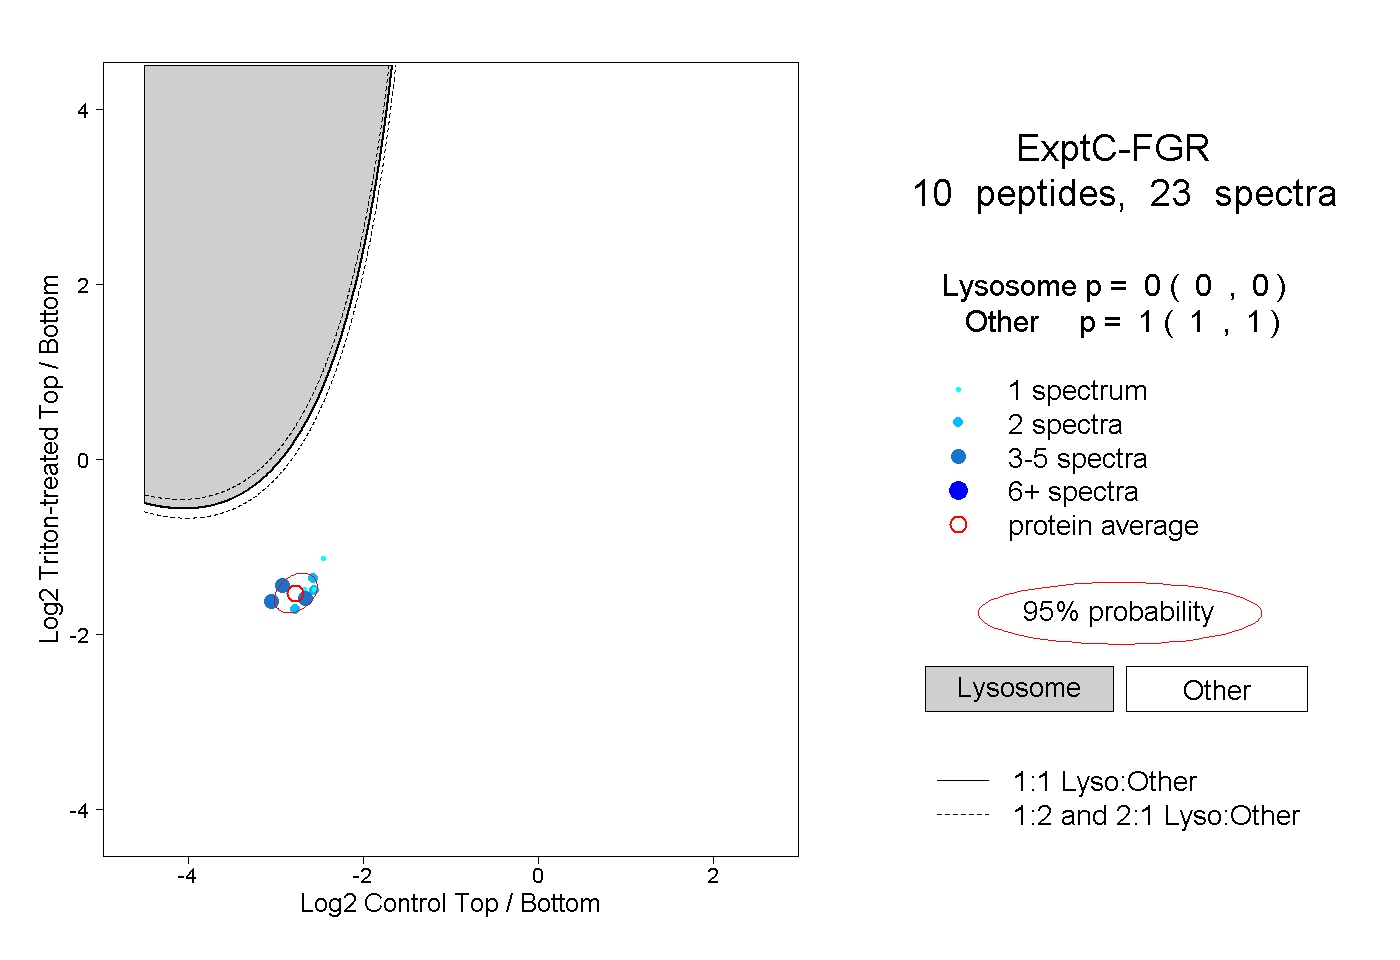 |
0.000 0.000 | 0.000 |
1.000 1.000 | 1.000 |
||||||||
| Plot | Lyso | Other | |||||||||||
| Expt D |
1 peptide |
1 spectrum |
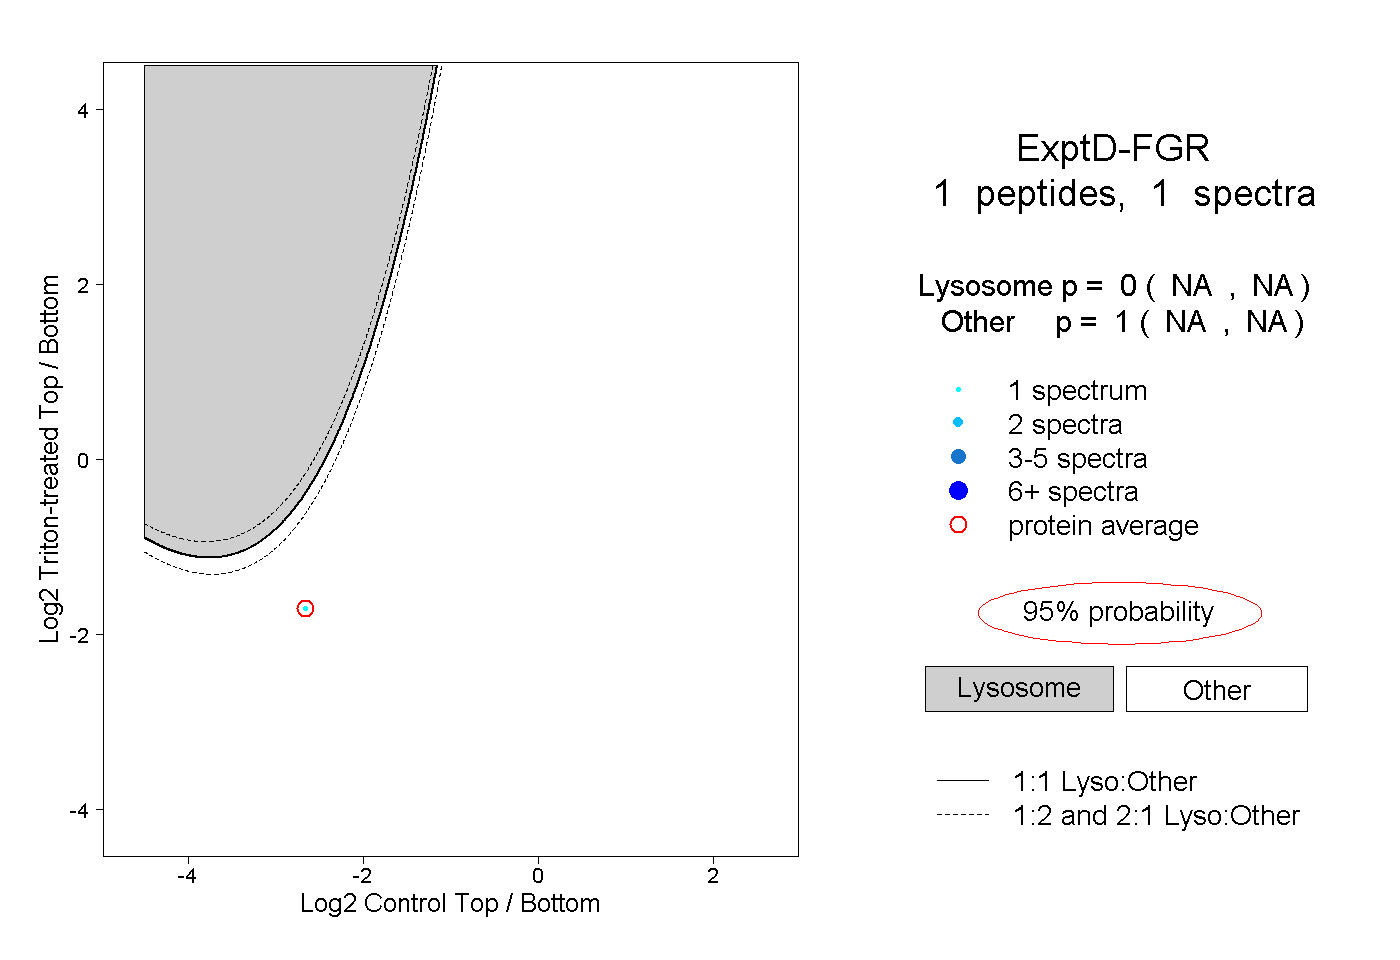 |
0.000 NA | NA |
1.000 NA | NA |