 16
16peptides
spectra
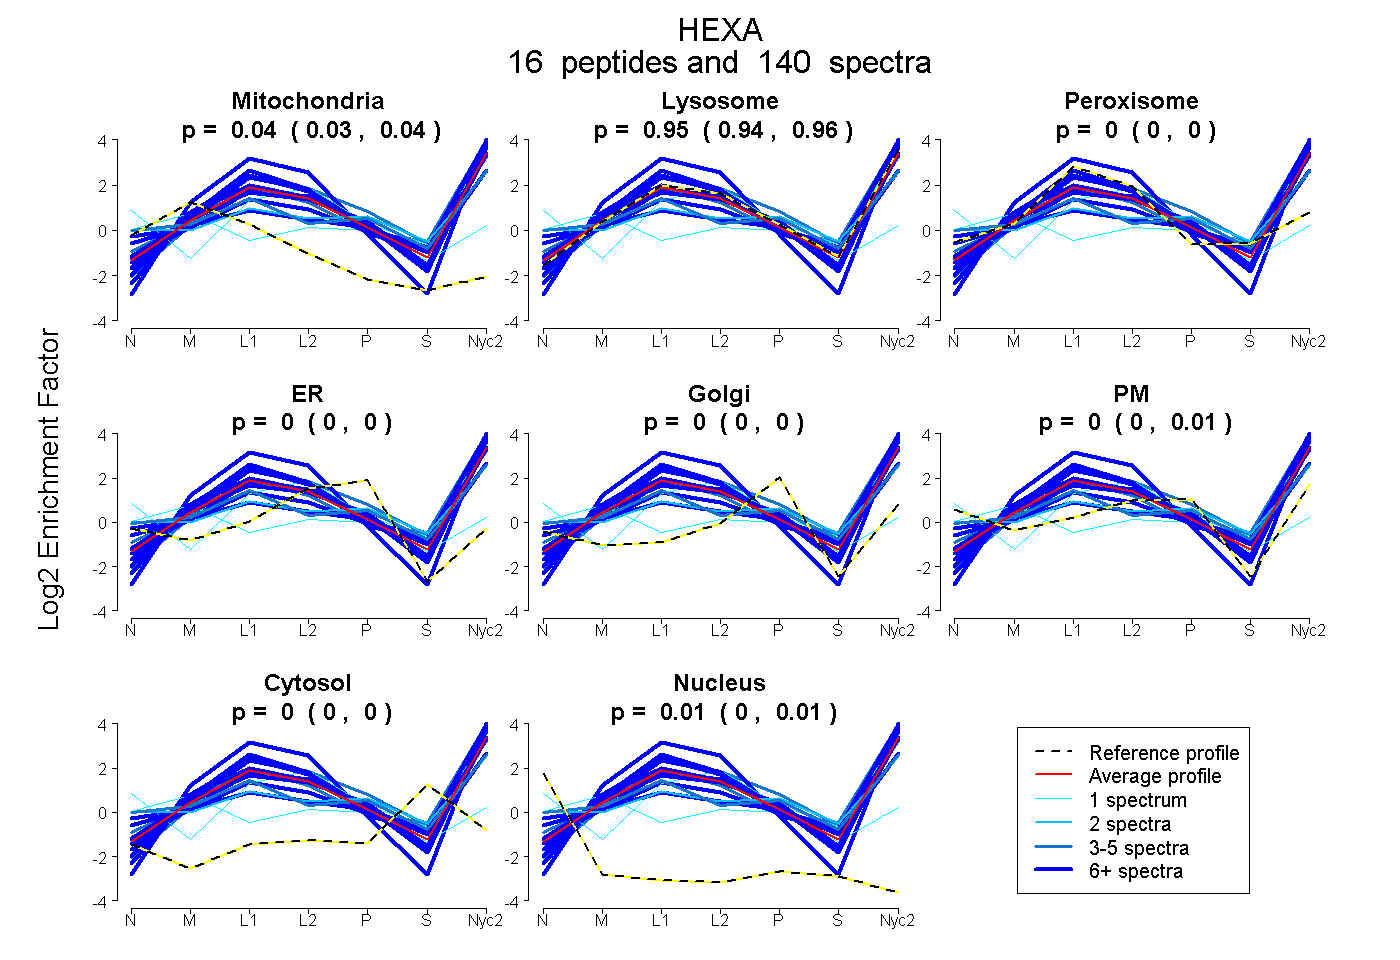
0.029 | 0.041
0.942 | 0.958
0.000 | 0.000
0.000 | 0.000
0.000 | 0.000
0.000 | 0.011
0.000 | 0.000
0.004 | 0.013
13peptides
spectra
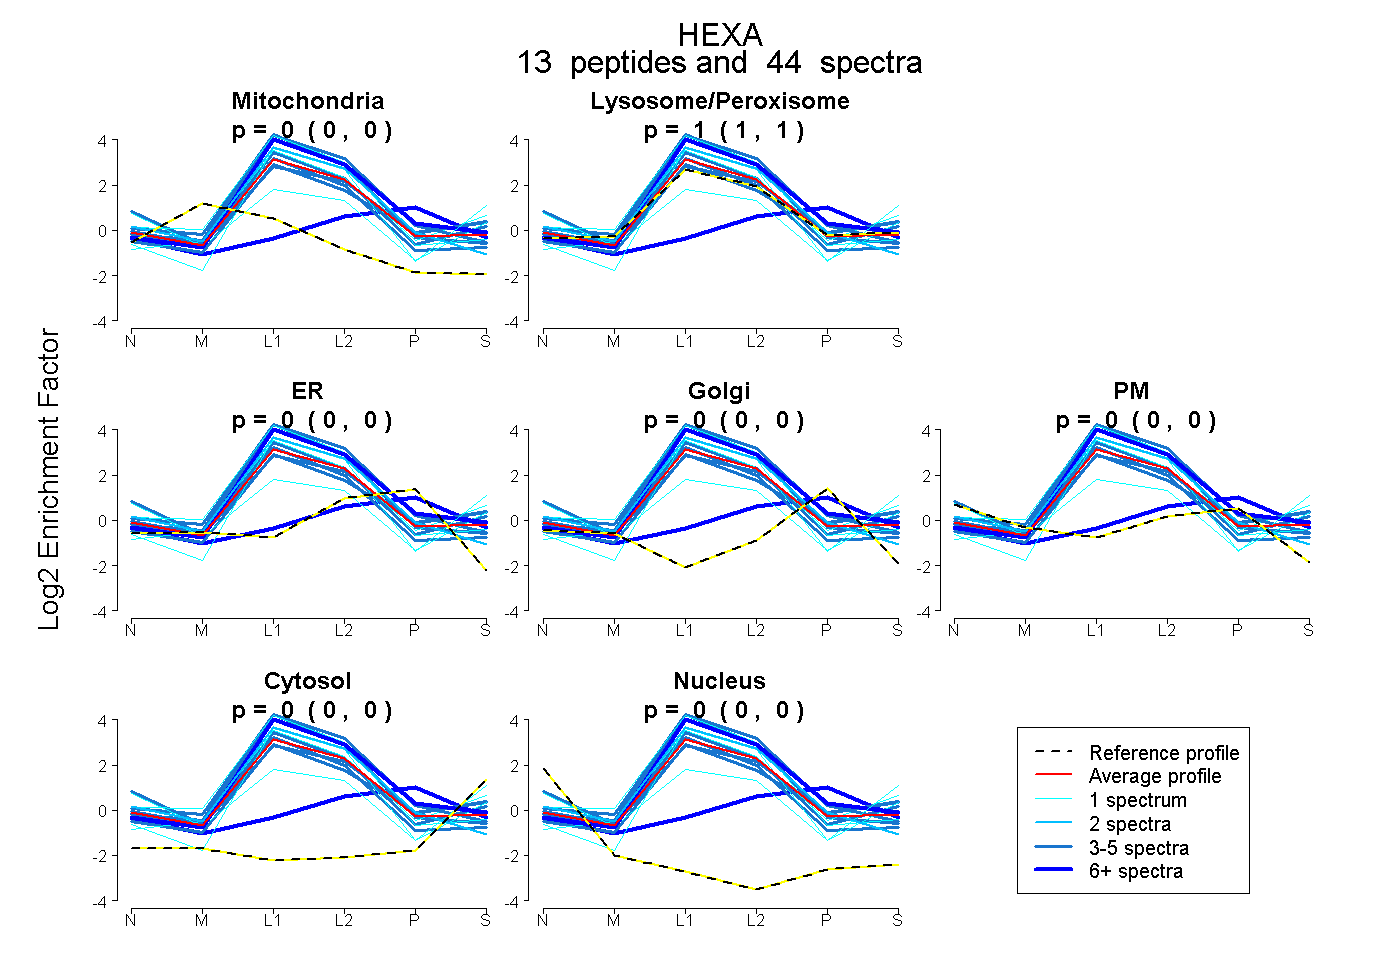
0.000 | 0.000
1.000 | 1.000
0.000 | 0.000
0.000 | 0.000
0.000 | 0.000
0.000 | 0.000
0.000 | 0.000
20peptides
spectra
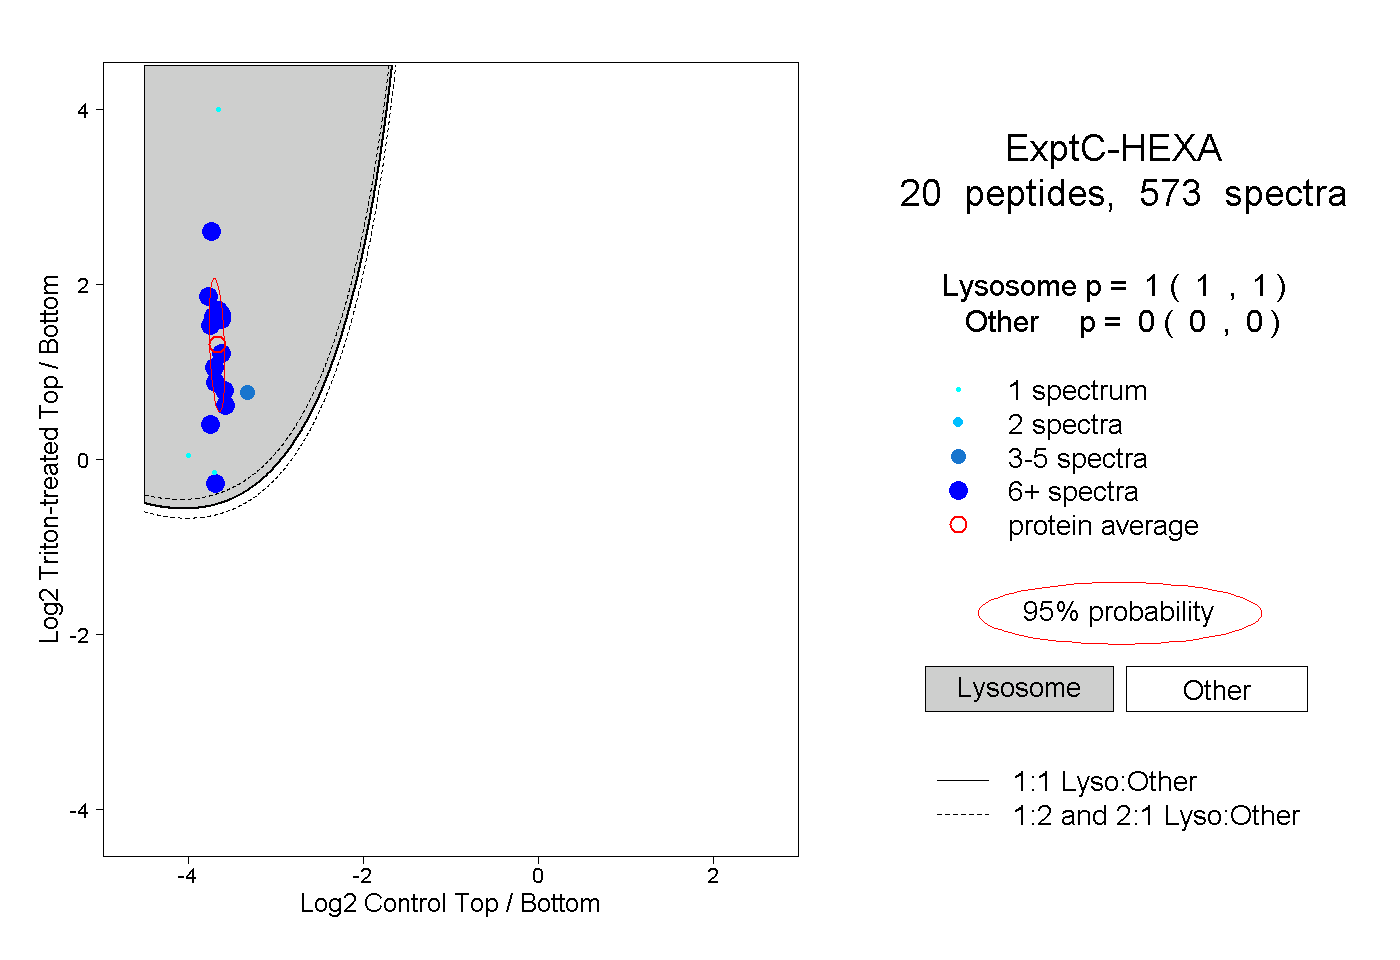
1.000 | 1.000
0.000 | 0.000
8peptides
spectra
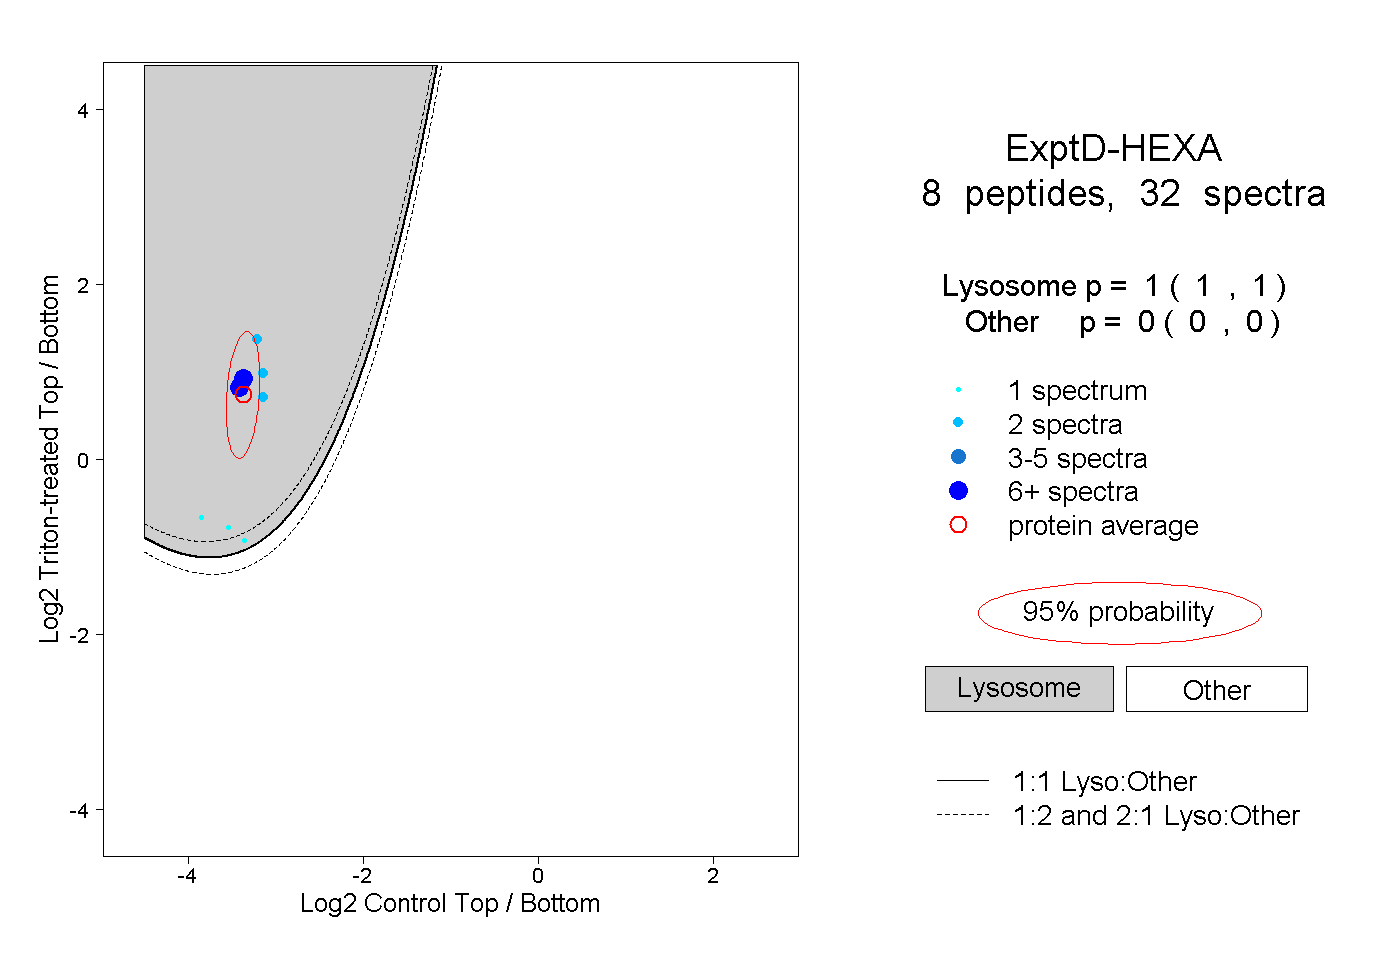
1.000 | 1.000
0.000 | 0.000