 16
16peptides
spectra
0.029 | 0.041
0.942 | 0.958
0.000 | 0.000
0.000 | 0.000
0.000 | 0.000
0.000 | 0.011
0.000 | 0.000
0.004 | 0.013
| Plot | Mito | Lyso | Perox | ER | Golgi | PM | Cytosol | Nucleus | |||||
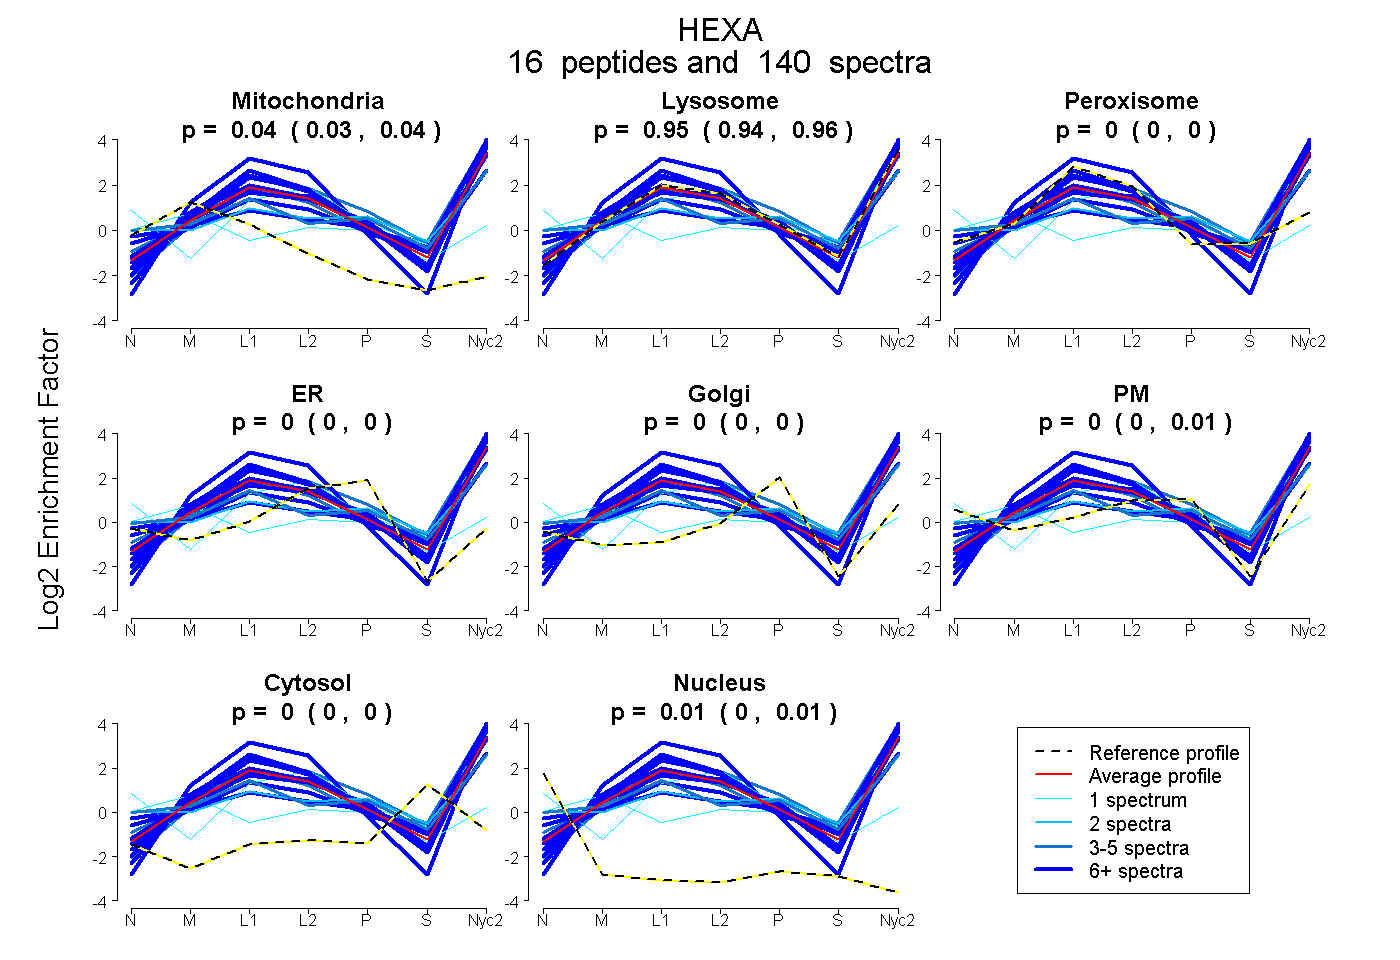
| Expt A |
16 peptides |
140 spectra |
|
0.035 0.029 | 0.041 |
0.953 0.942 | 0.958 |
0.000 0.000 | 0.000 |
0.000 0.000 | 0.000 |
0.000 0.000 | 0.000 |
0.002 0.000 | 0.011 |
0.000 0.000 | 0.000 |
0.010 0.004 | 0.013 |
| 16 spectra, VRPDTIIQVWR | 0.007 | 0.835 | 0.000 | 0.000 | 0.000 | 0.159 | 0.000 | 0.000 | ||
| 1 spectrum, GTPAQK | 0.000 | 0.488 | 0.048 | 0.000 | 0.000 | 0.439 | 0.025 | 0.000 | ||
| 13 spectra, GLETFSQLVWK | 0.000 | 0.877 | 0.000 | 0.000 | 0.000 | 0.000 | 0.094 | 0.029 | ||
| 1 spectrum, GIQAQPISVGYCEQEFEHT | 0.323 | 0.067 | 0.000 | 0.000 | 0.067 | 0.414 | 0.129 | 0.000 | ||
| 11 spectra, VEPLAFR | 0.000 | 1.000 | 0.000 | 0.000 | 0.000 | 0.000 | 0.000 | 0.000 | ||
| 7 spectra, GYVVWQEVFDNK | 0.005 | 0.995 | 0.000 | 0.000 | 0.000 | 0.000 | 0.000 | 0.000 | ||
| 4 spectra, AGAIAER | 0.000 | 1.000 | 0.000 | 0.000 | 0.000 | 0.000 | 0.000 | 0.000 | ||
| 7 spectra, SNPNIQAFMK | 0.015 | 0.624 | 0.000 | 0.000 | 0.000 | 0.218 | 0.107 | 0.036 | ||
| 2 spectra, YHAGSAAQAGCVVLDEAFR | 0.000 | 0.474 | 0.000 | 0.000 | 0.000 | 0.382 | 0.144 | 0.000 | ||
| 4 spectra, GFTDYK | 0.000 | 0.965 | 0.000 | 0.000 | 0.000 | 0.000 | 0.035 | 0.000 | ||
| 7 spectra, EEMPVQYMK | 0.000 | 0.995 | 0.005 | 0.000 | 0.000 | 0.000 | 0.000 | 0.000 | ||
| 13 spectra, EIEAITQAGFR | 0.000 | 0.771 | 0.000 | 0.000 | 0.000 | 0.229 | 0.000 | 0.000 | ||
| 3 spectra, YTLYPNNFQFR | 0.000 | 0.494 | 0.063 | 0.000 | 0.000 | 0.353 | 0.091 | 0.000 | ||
| 31 spectra, GILLDTSR | 0.000 | 1.000 | 0.000 | 0.000 | 0.000 | 0.000 | 0.000 | 0.000 | ||
| 9 spectra, ITDFPR | 0.000 | 1.000 | 0.000 | 0.000 | 0.000 | 0.000 | 0.000 | 0.000 | ||
| 11 spectra, ALLSAPWYLNR | 0.000 | 1.000 | 0.000 | 0.000 | 0.000 | 0.000 | 0.000 | 0.000 |
| Plot | Mito | Lyso or Perox | ER | Golgi | PM | Cytosol | Nucleus | ||||||
| Expt B |
13 peptides |
44 spectra |
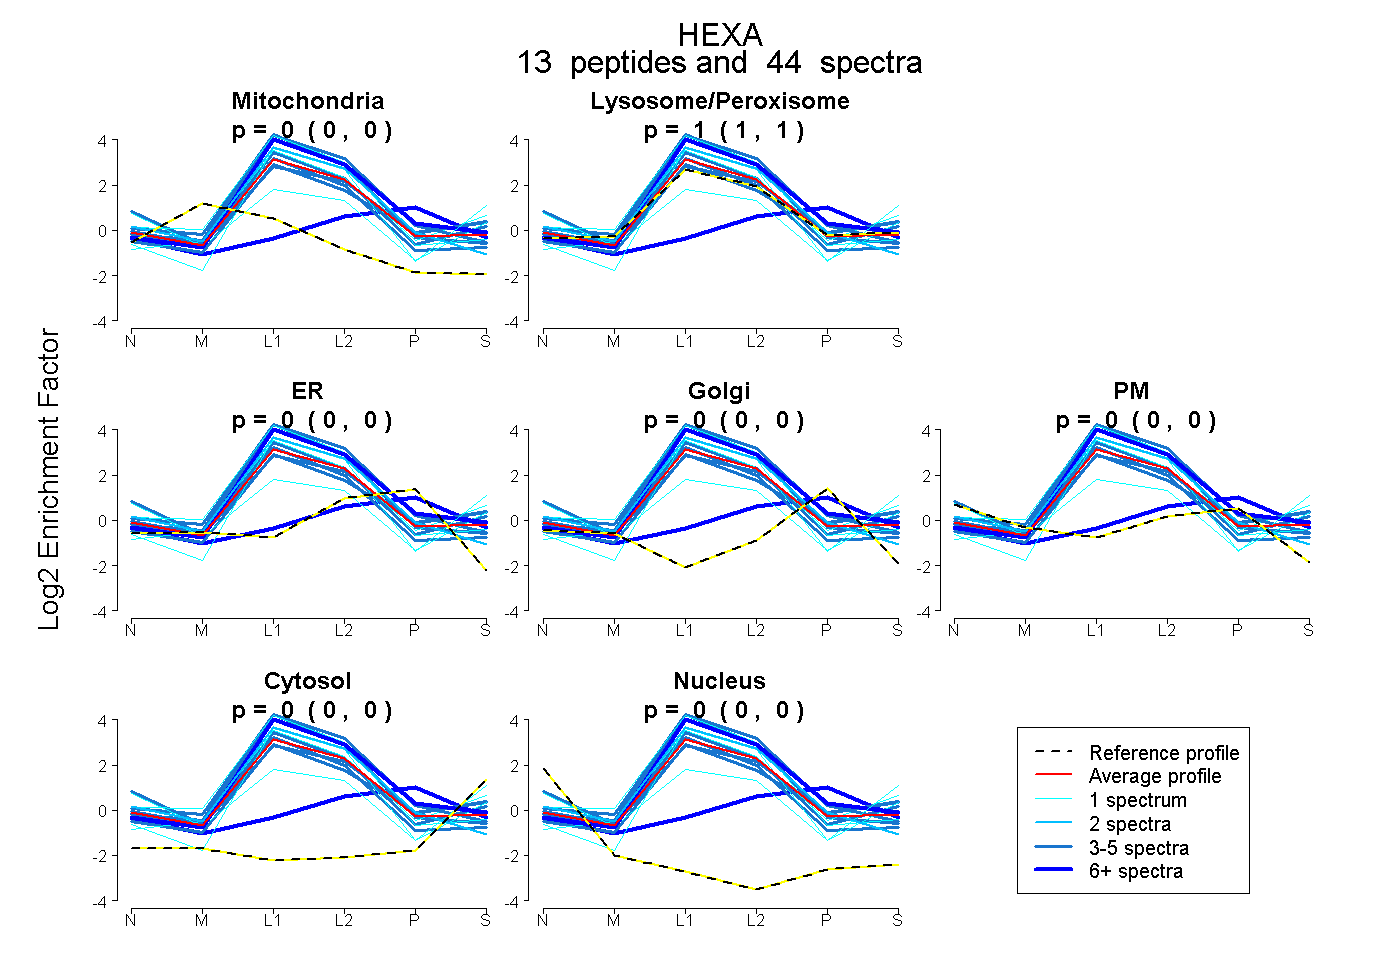 |
0.000 0.000 | 0.000 |
1.000 1.000 | 1.000 |
0.000 0.000 | 0.000 |
0.000 0.000 | 0.000 |
0.000 0.000 | 0.000 |
0.000 0.000 | 0.000 |
0.000 0.000 | 0.000 |
|||
| Plot | Lyso | Other | |||||||||||
| Expt C |
20 peptides |
573 spectra |
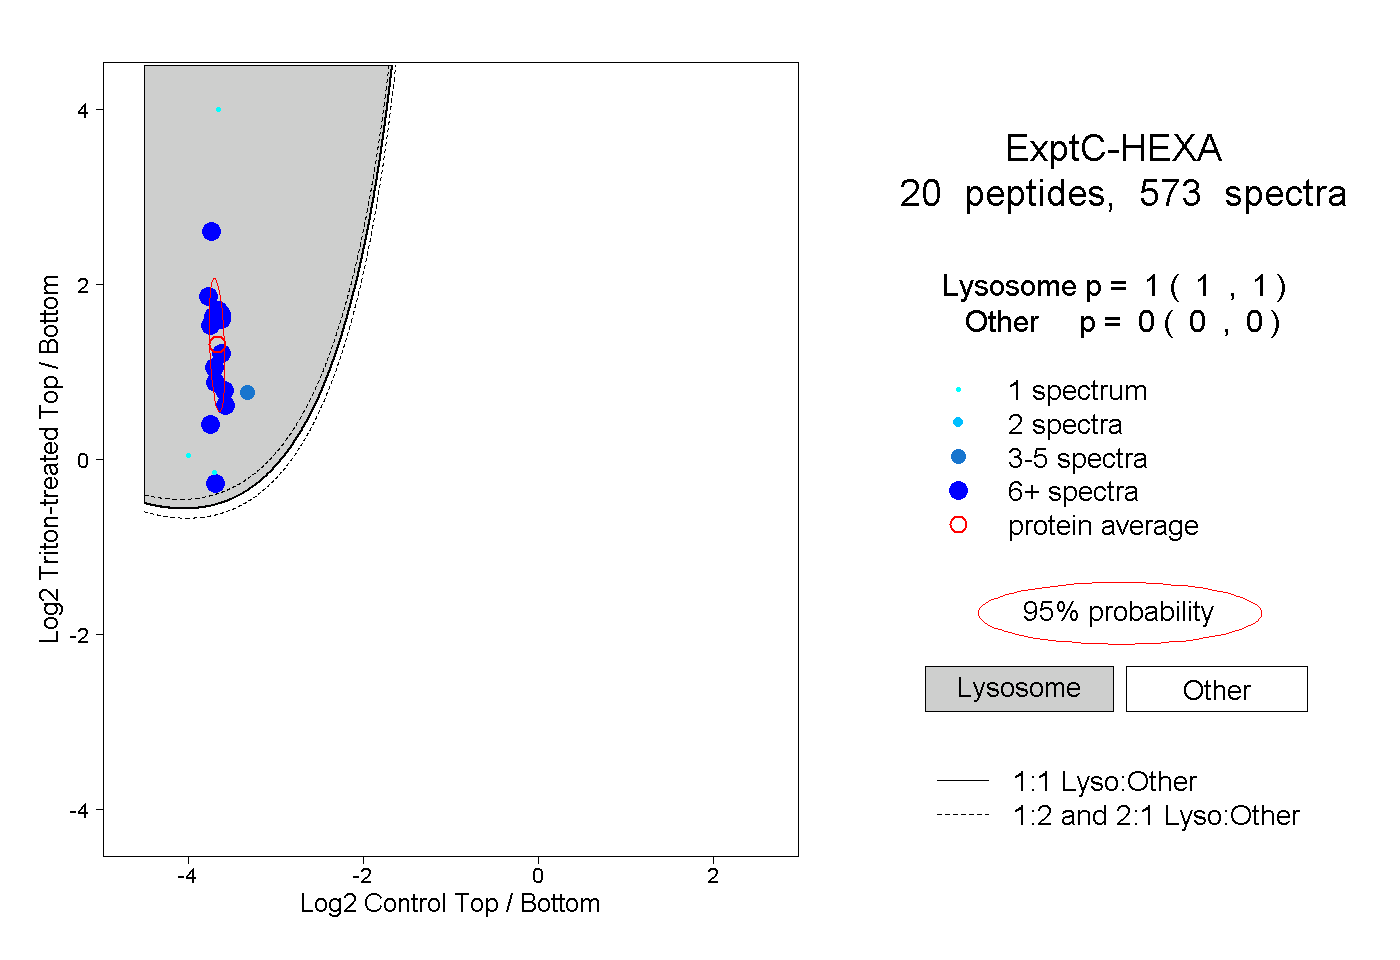 |
1.000 1.000 | 1.000 |
0.000 0.000 | 0.000 |
||||||||
| Plot | Lyso | Other | |||||||||||
| Expt D |
8 peptides |
32 spectra |
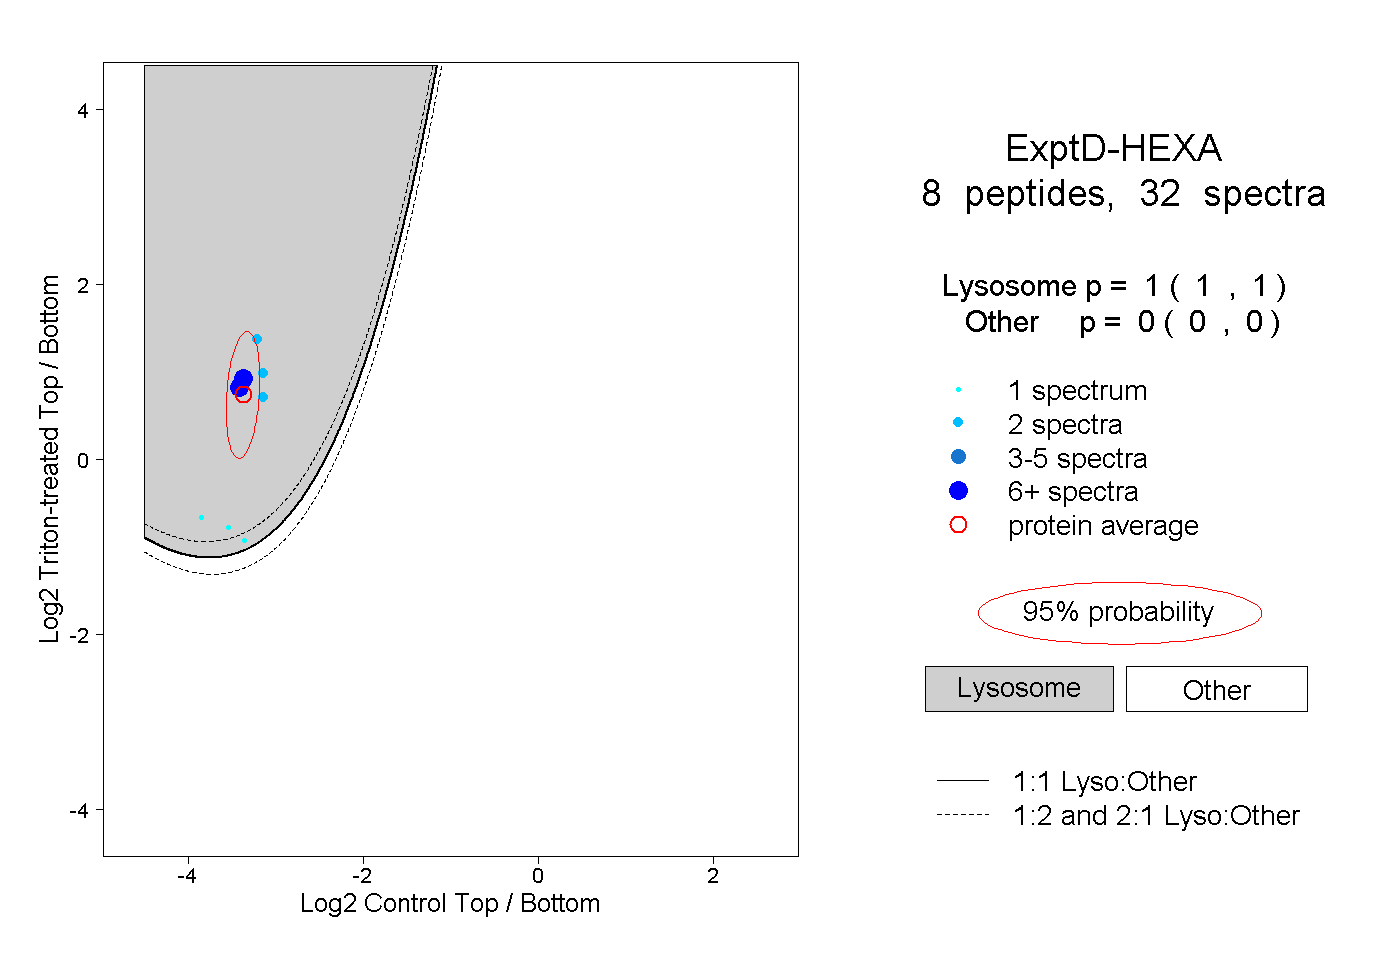 |
1.000 1.000 | 1.000 |
0.000 0.000 | 0.000 |