HEXA
[ENSRNOP00000013747]
Main page
| | | Plot |
Mito |
Lyso |
|
Perox |
ER |
Golgi |
PM |
Cytosol |
Nucleus |
|
| Expt A |
 16
16
peptides |
140
spectra |
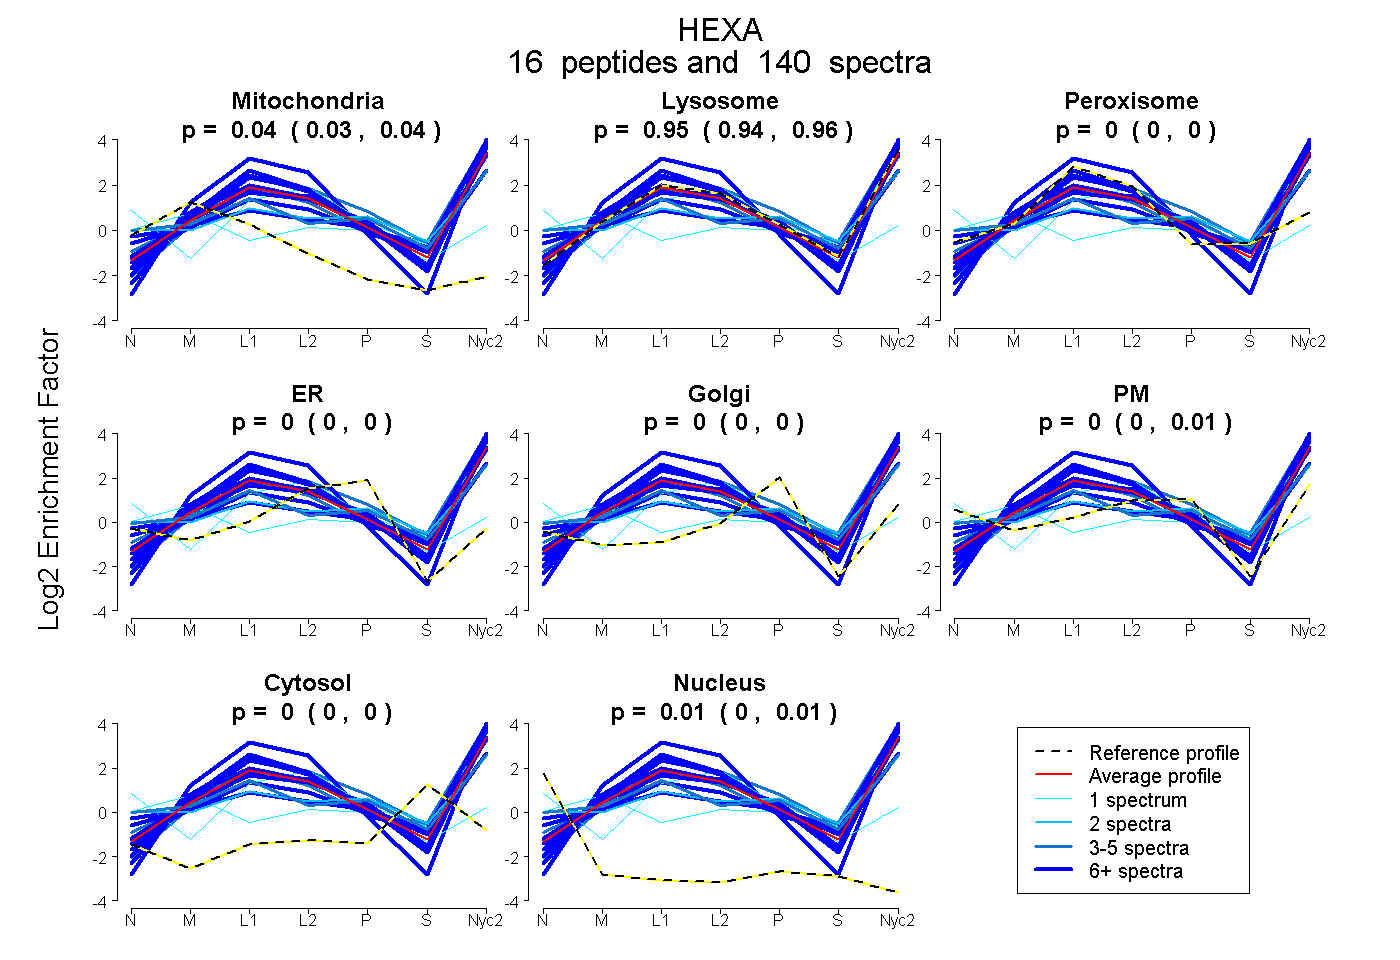 |
0.035
0.029 | 0.041 |
0.953
0.942 | 0.958 |
|
0.000
0.000 | 0.000 |
0.000
0.000 | 0.000 |
0.000
0.000 | 0.000 |
0.002
0.000 | 0.011 |
0.000
0.000 | 0.000 |
0.010
0.004 | 0.013 |
|
| | | Plot |
Mito |
|
Lyso or Perox |
|
ER |
Golgi |
PM |
Cytosol |
Nucleus |
|
| Expt B |
13
peptides |
44
spectra |
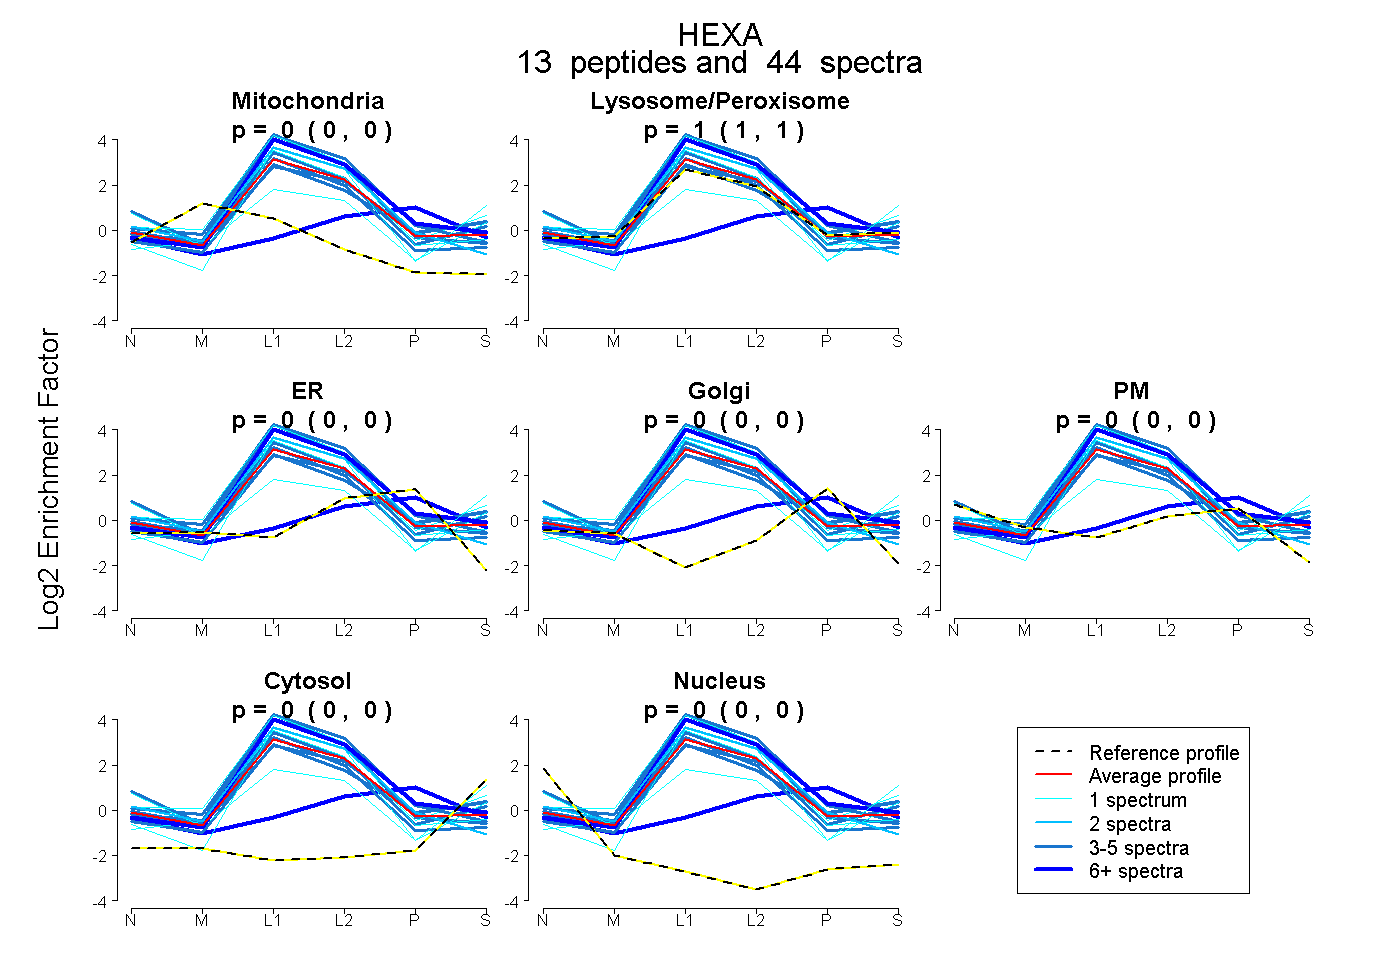 |
0.000
0.000 | 0.000 |
|
1.000
1.000 | 1.000 |
|
0.000
0.000 | 0.000 |
0.000
0.000 | 0.000 |
0.000
0.000 | 0.000 |
0.000
0.000 | 0.000 |
0.000
0.000 | 0.000 |
|
| 7 spectra, VRPDTIIQVWR |
0.000 |
|
1.000 |
|
0.000 |
0.000 |
0.000 |
0.000 |
0.000 |
|
| 1 spectrum, GLETFSQLVWK |
0.000 |
|
1.000 |
|
0.000 |
0.000 |
0.000 |
0.000 |
0.000 |
|
| 5 spectra, EIEAITQAGFR |
0.000 |
|
0.958 |
|
0.000 |
0.000 |
0.000 |
0.000 |
0.042 |
|
| 1 spectrum, VEPLAFR |
0.000 |
|
1.000 |
|
0.000 |
0.000 |
0.000 |
0.000 |
0.000 |
|
| 2 spectra, YTLYPNNFQFR |
0.000 |
|
1.000 |
|
0.000 |
0.000 |
0.000 |
0.000 |
0.000 |
|
| 8 spectra, AGAIAER |
0.000 |
|
0.332 |
|
0.257 |
0.269 |
0.000 |
0.142 |
0.000 |
|
| 3 spectra, GYVVWQEVFDNK |
0.000 |
|
1.000 |
|
0.000 |
0.000 |
0.000 |
0.000 |
0.000 |
|
| 1 spectrum, YGPDWK |
0.000 |
|
1.000 |
|
0.000 |
0.000 |
0.000 |
0.000 |
0.000 |
|
| 4 spectra, GILLDTSR |
0.000 |
|
1.000 |
|
0.000 |
0.000 |
0.000 |
0.000 |
0.000 |
|
| 1 spectrum, SNPNIQAFMK |
0.000 |
|
0.823 |
|
0.000 |
0.000 |
0.000 |
0.019 |
0.159 |
|
| 5 spectra, ITDFPR |
0.000 |
|
1.000 |
|
0.000 |
0.000 |
0.000 |
0.000 |
0.000 |
|
| 3 spectra, ALLSAPWYLNR |
0.000 |
|
1.000 |
|
0.000 |
0.000 |
0.000 |
0.000 |
0.000 |
|
| 3 spectra, GFTDYK |
0.000 |
|
0.972 |
|
0.000 |
0.000 |
0.000 |
0.028 |
0.000 |
|
| | | Plot |
|
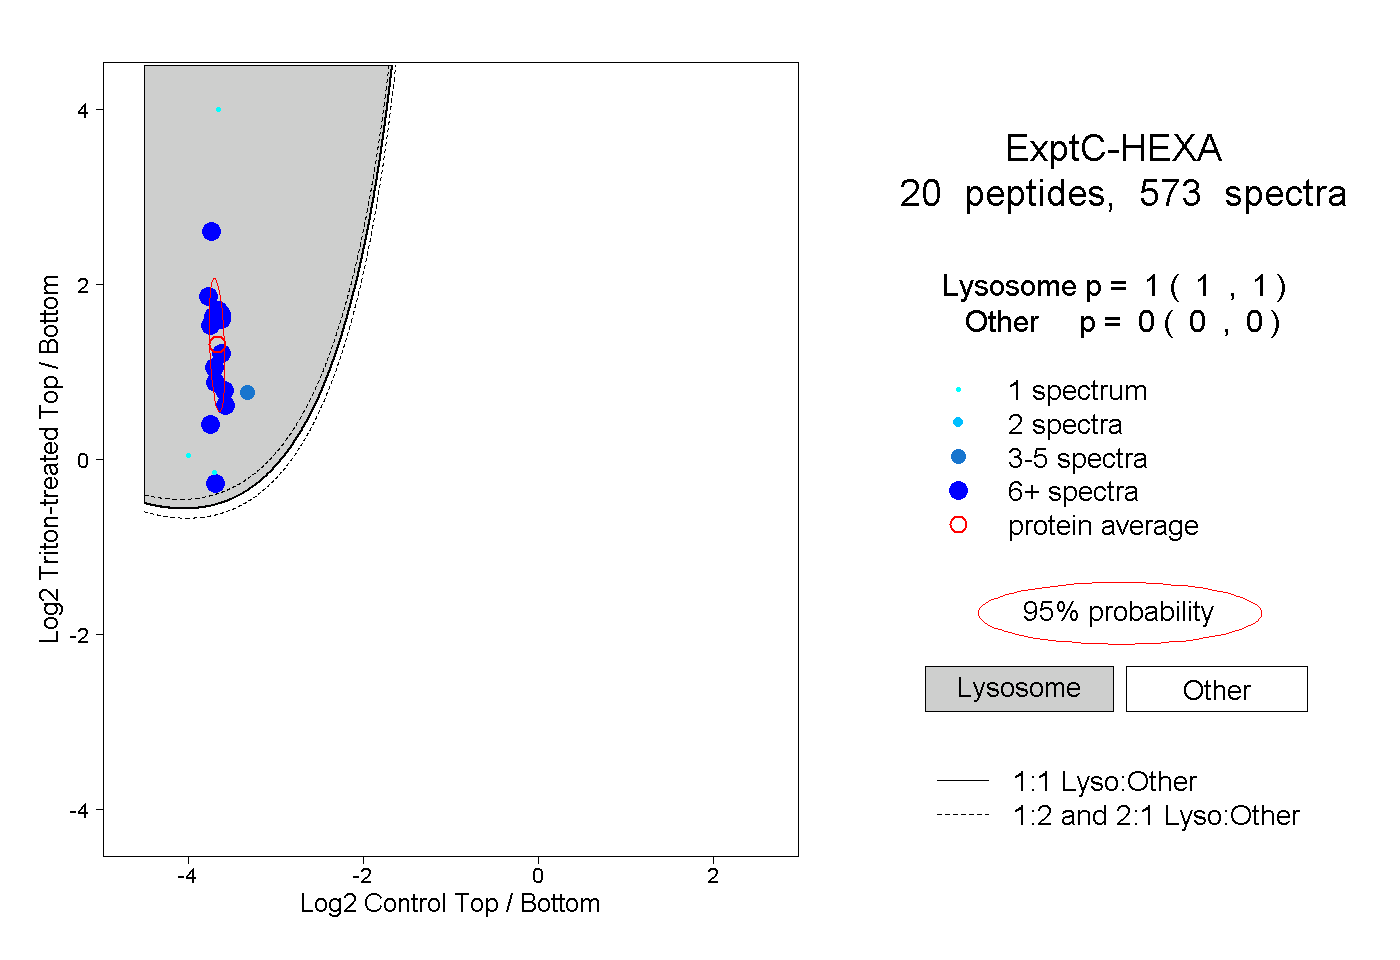
Lyso |
|
|
|
|
|
|
|
Other |
| Expt C |
20
peptides |
573
spectra |
 |
|
1.000
1.000 | 1.000 |
|
|
|
|
|
|
|
0.000
0.000 | 0.000 |
| | | Plot |
|
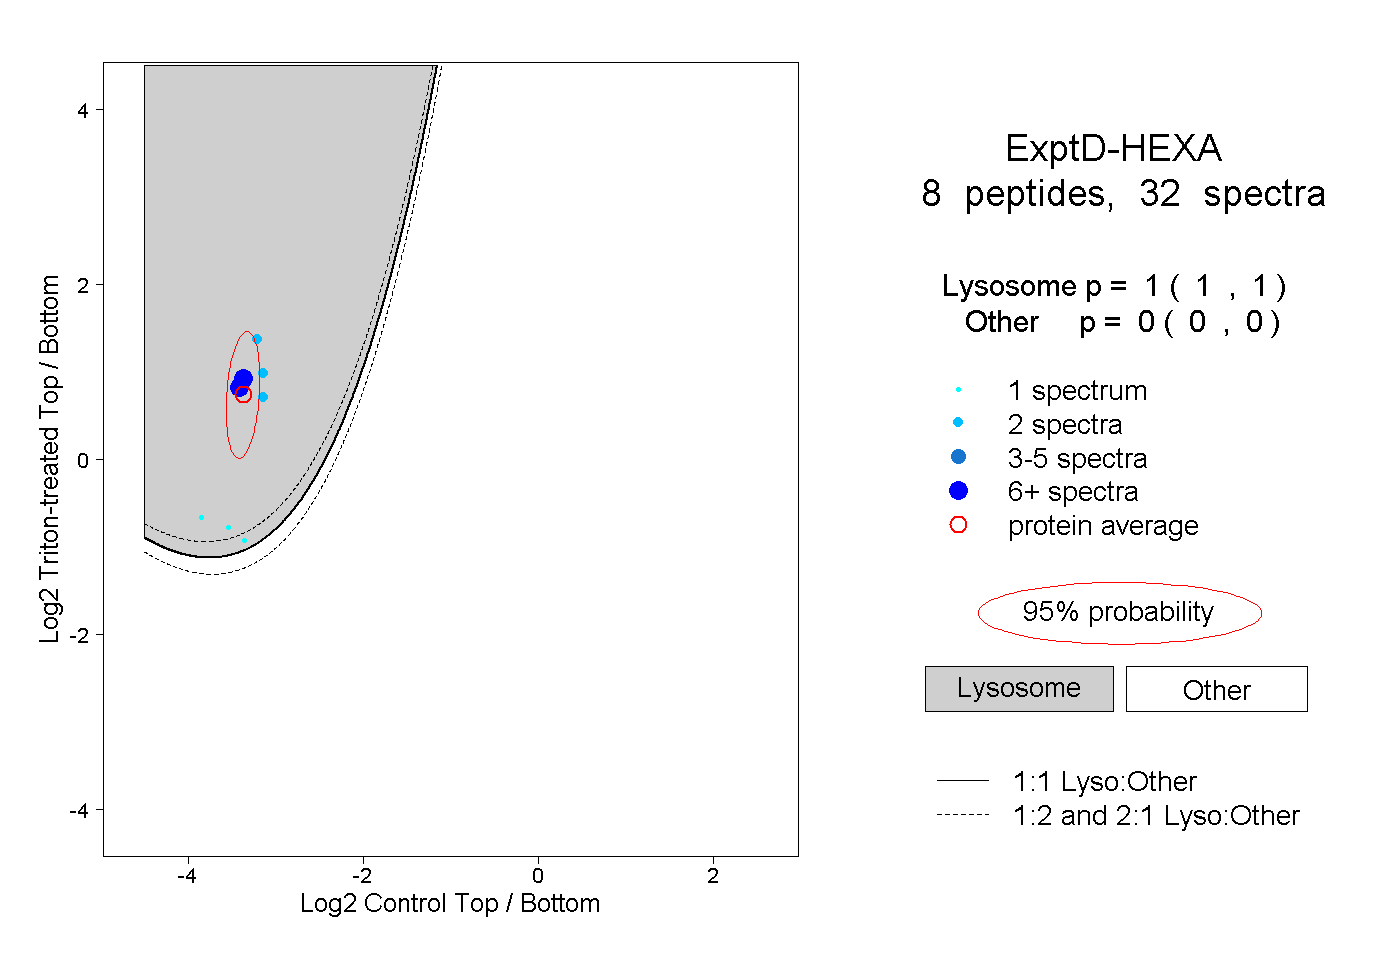
Lyso |
|
|
|
|
|
|
|
Other |
| Expt D |
8
peptides |
32
spectra |
 |
|
1.000
1.000 | 1.000 |
|
|
|
|
|
|
|
0.000
0.000 | 0.000 |