 12
12peptides
spectra
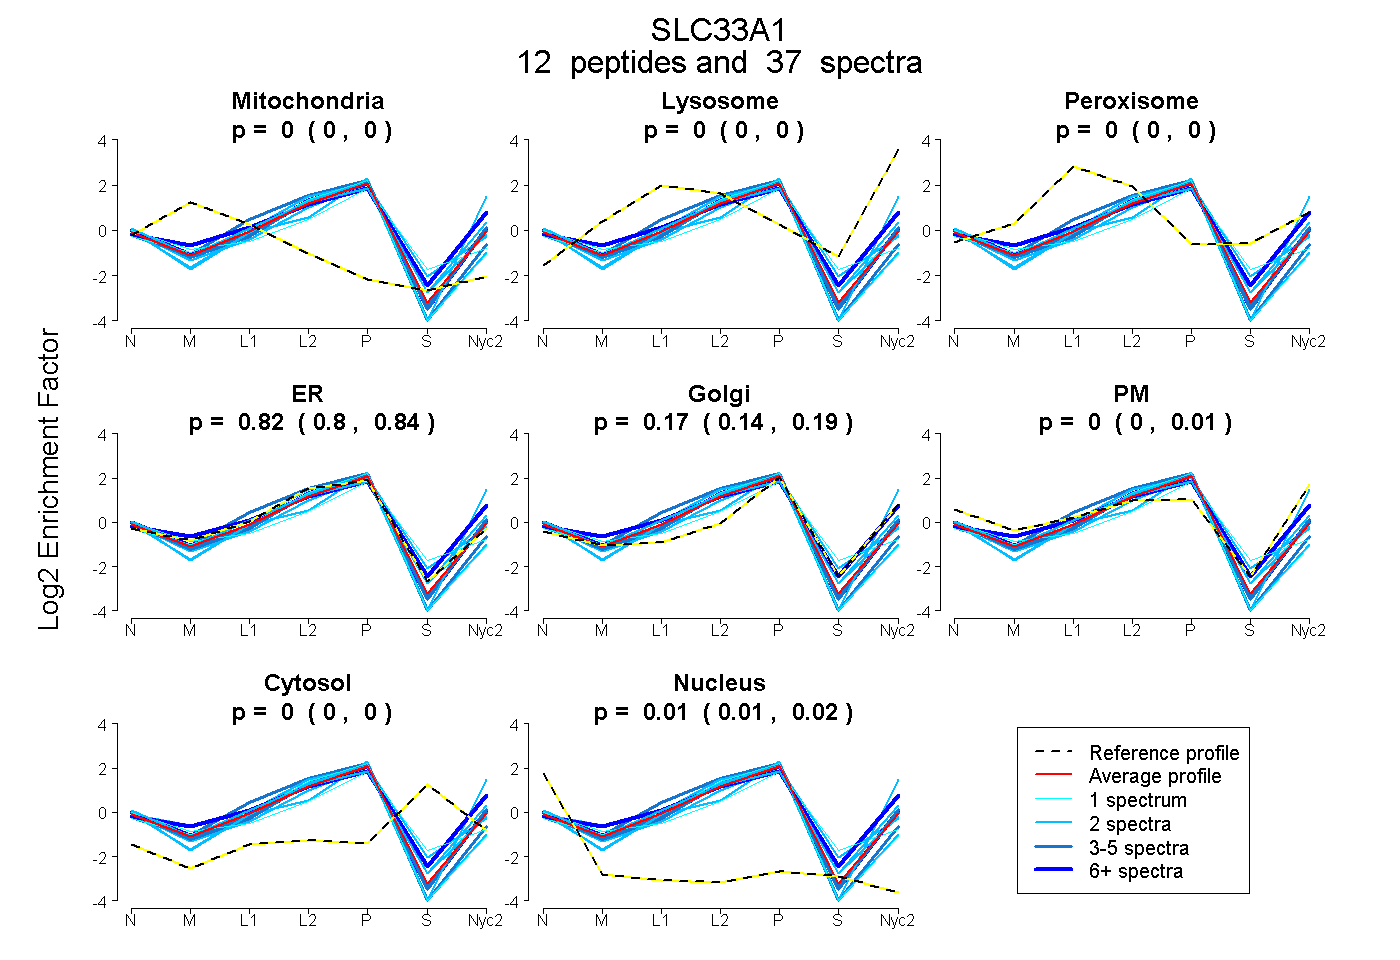
0.000 | 0.000
0.000 | 0.000
0.000 | 0.000
0.795 | 0.835
0.145 | 0.188
0.000 | 0.007
0.000 | 0.000
0.006 | 0.016
7peptides
spectra
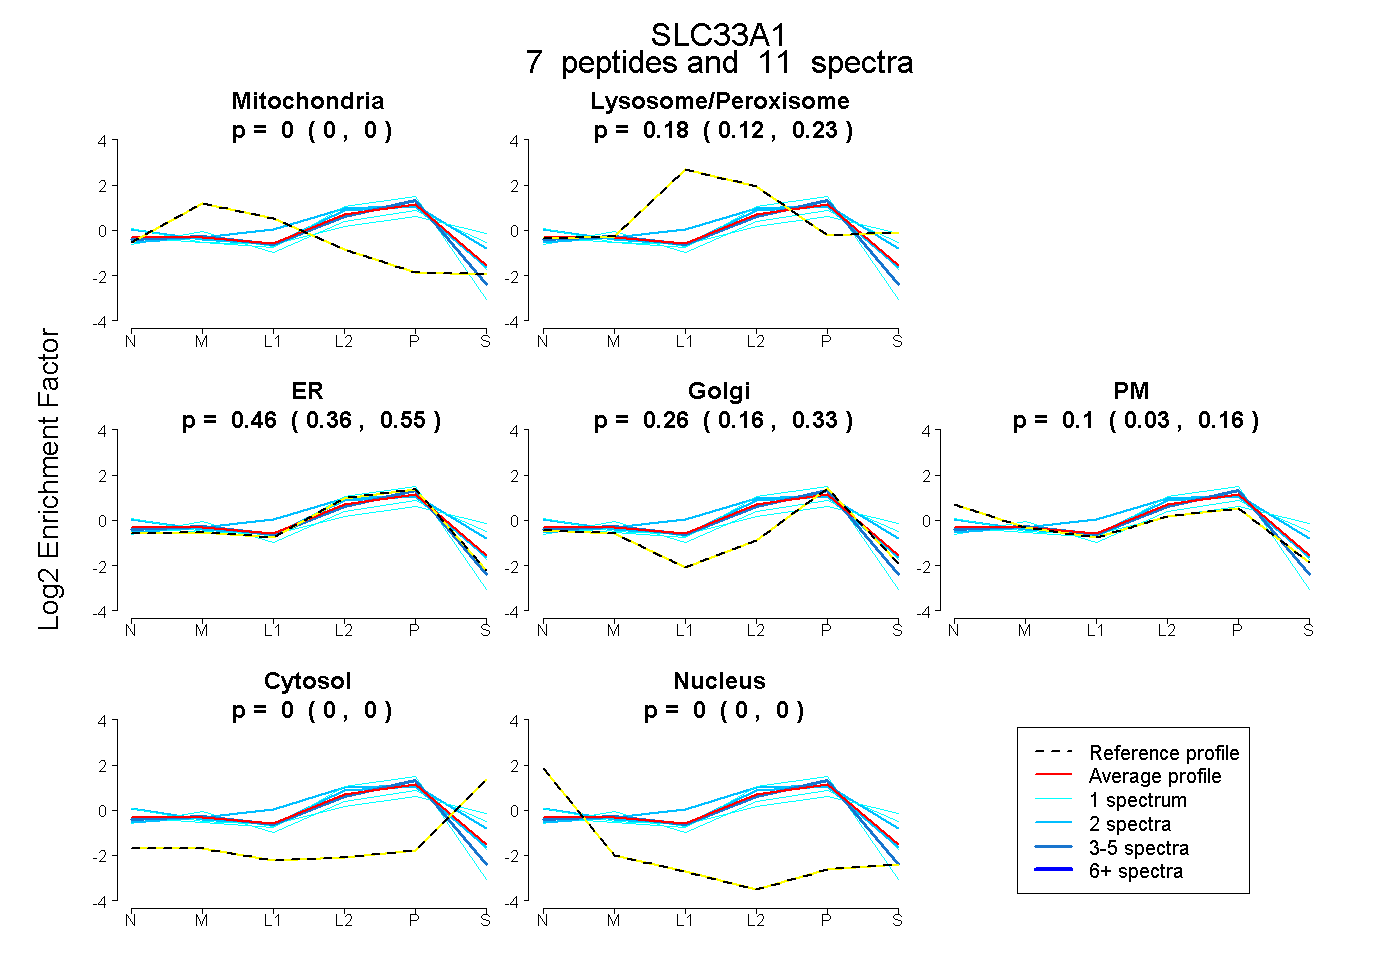
0.000 | 0.000
0.122 | 0.226
0.364 | 0.545
0.159 | 0.334
0.034 | 0.158
0.000 | 0.000
0.000 | 0.000
12peptides
spectra
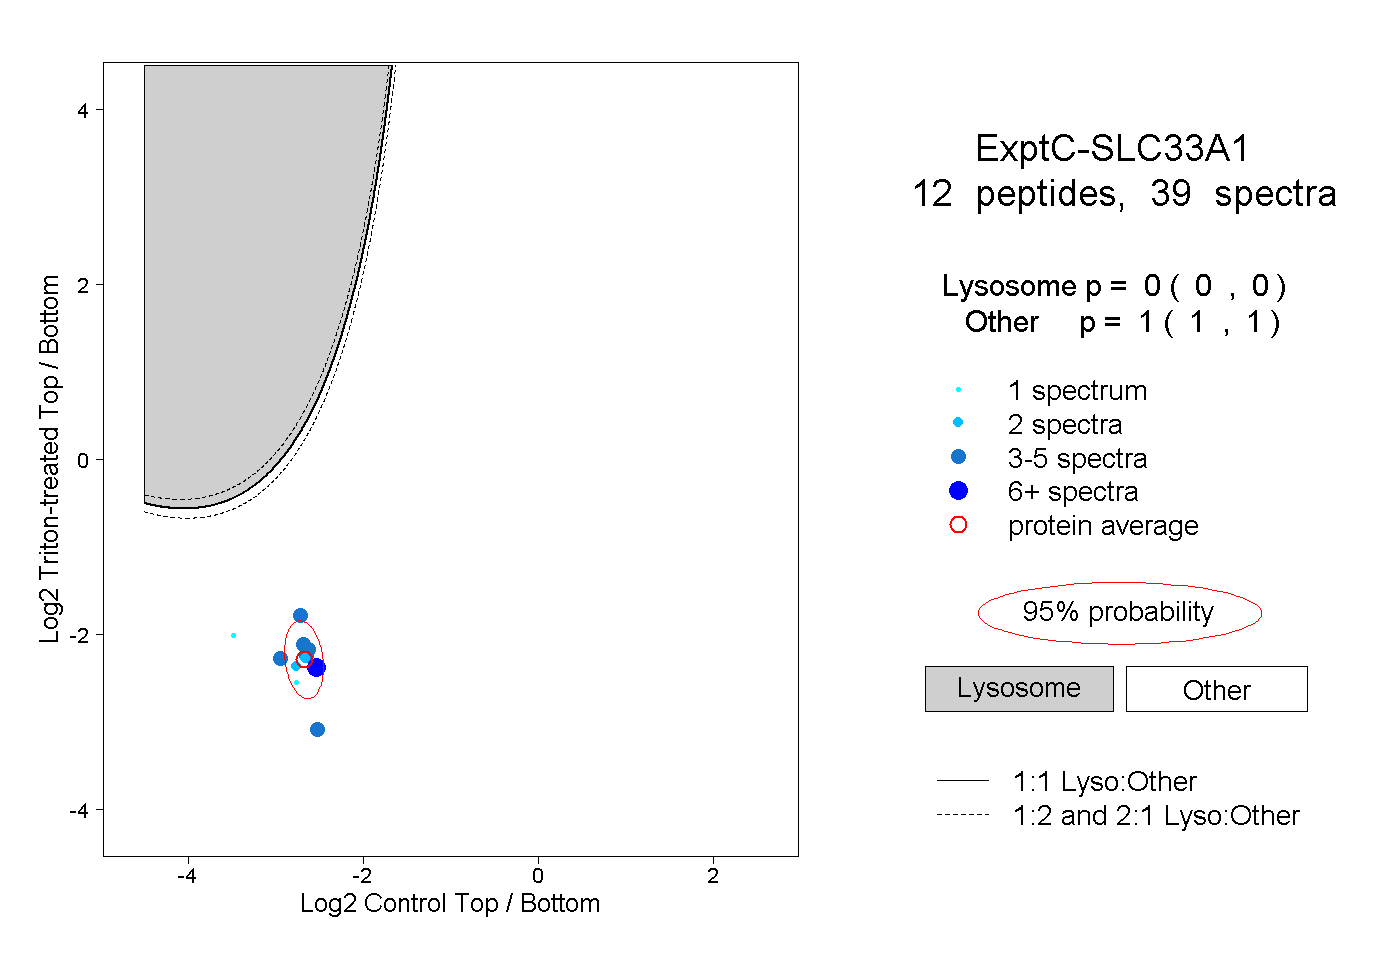
0.000 | 0.000
1.000 | 1.000
4peptides
spectra
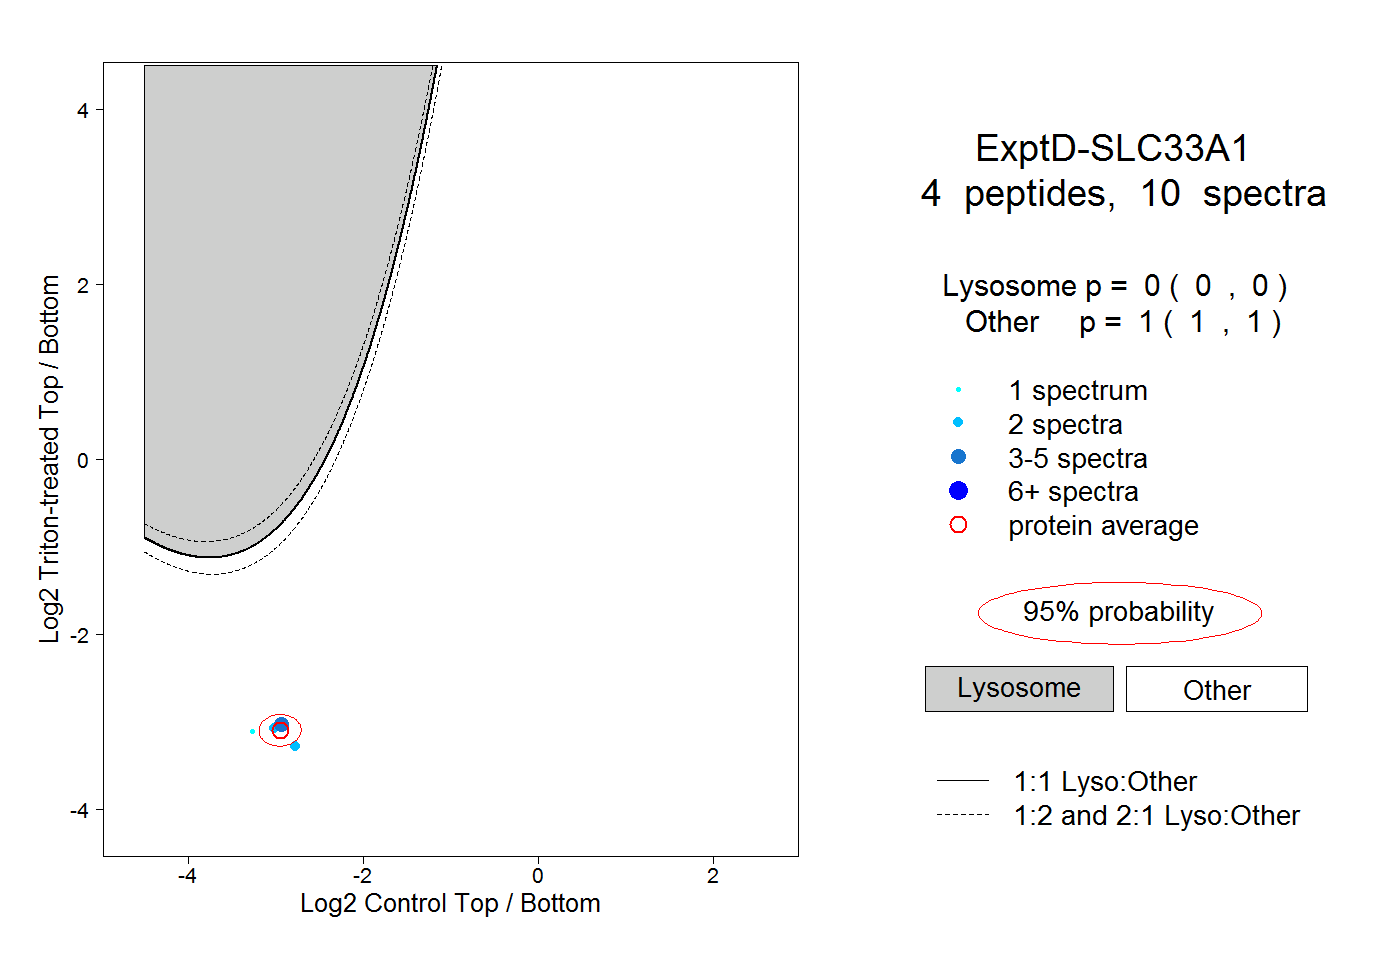
0.000 | 0.000
1.000 | 1.000