SLC33A1
[ENSRNOP00000013392]
Main page
| | | Plot |
Mito |
Lyso |
|
Perox |
ER |
Golgi |
PM |
Cytosol |
Nucleus |
|
| Expt A |
 12
12
peptides |
37
spectra |
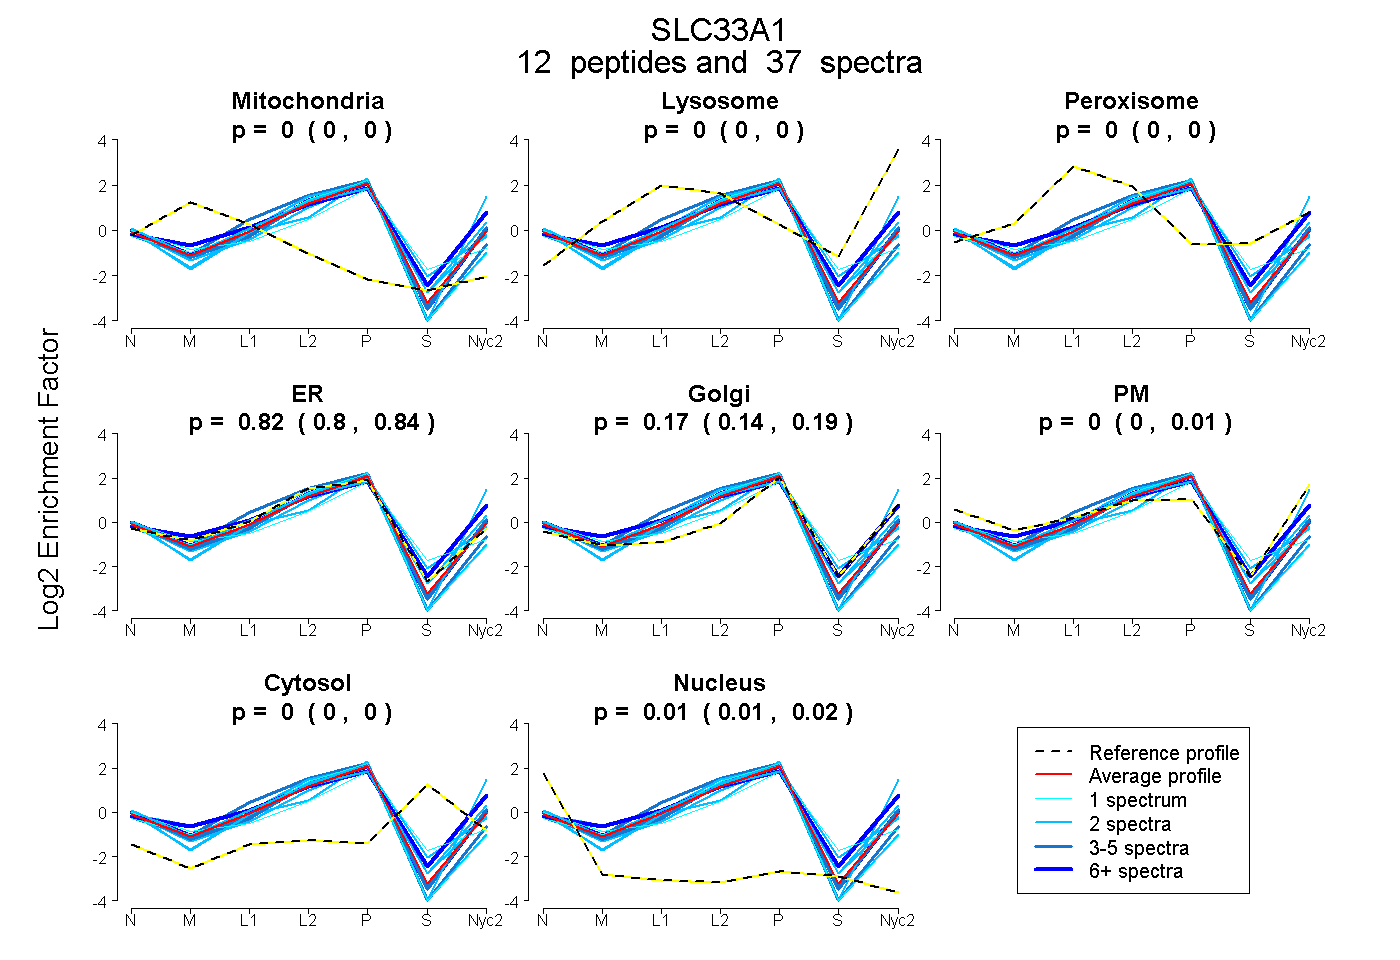 |
0.000
0.000 | 0.000 |
0.000
0.000 | 0.000 |
|
0.000
0.000 | 0.000 |
0.818
0.795 | 0.835 |
0.170
0.145 | 0.188 |
0.000
0.000 | 0.007 |
0.000
0.000 | 0.000 |
0.011
0.006 | 0.016 |
|
| | | Plot |
Mito |
|
Lyso or Perox |
|
ER |
Golgi |
PM |
Cytosol |
Nucleus |
|
| Expt B |
7
peptides |
11
spectra |
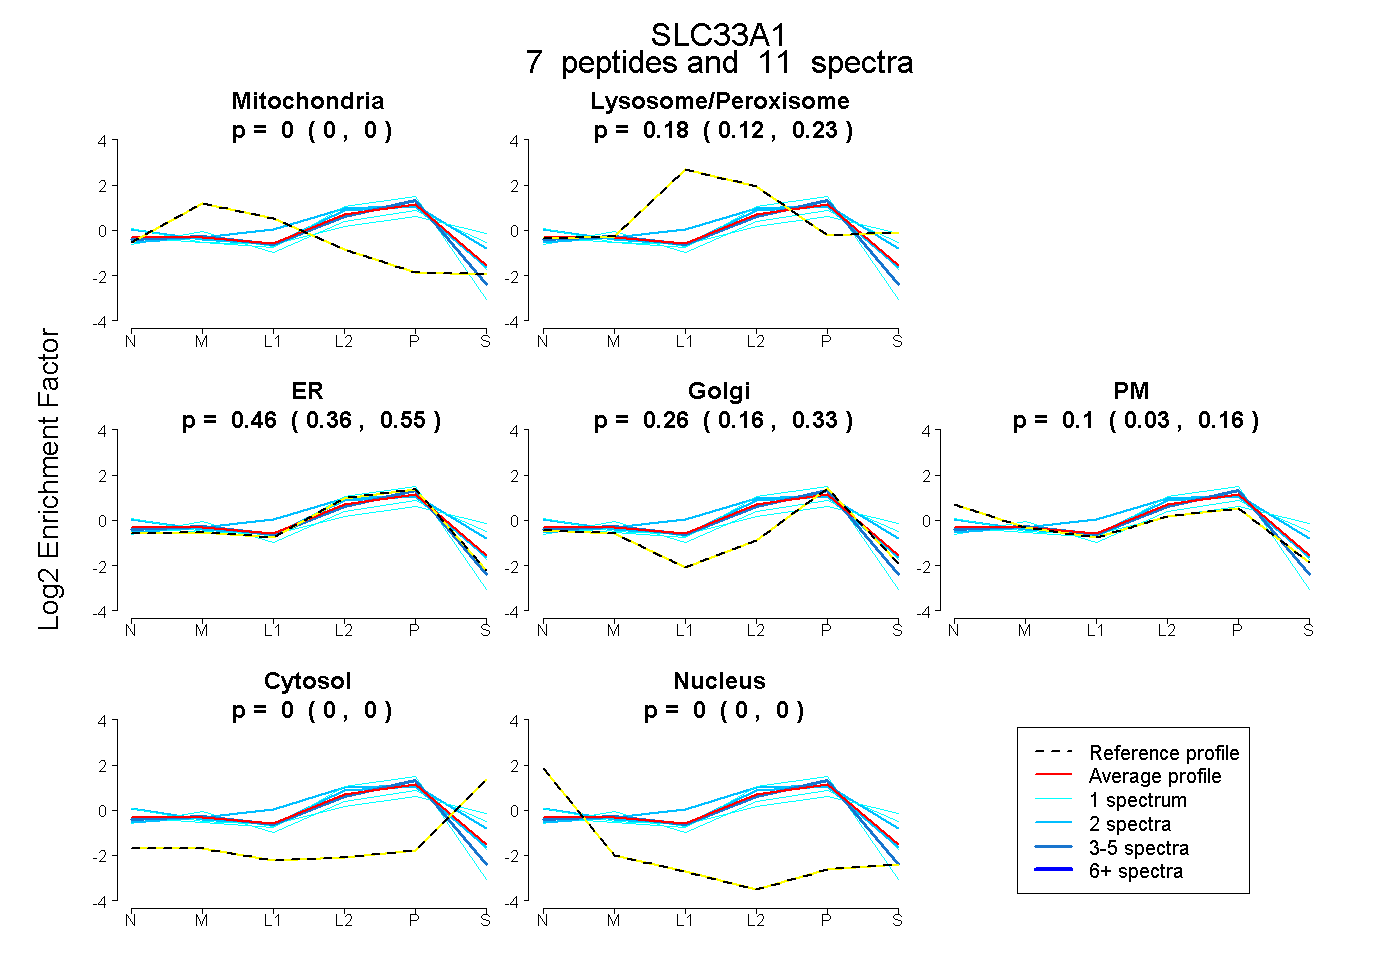 |
0.000
0.000 | 0.000 |
|
0.183
0.122 | 0.226 |
|
0.459
0.364 | 0.545 |
0.258
0.159 | 0.334 |
0.100
0.034 | 0.158 |
0.000
0.000 | 0.000 |
0.000
0.000 | 0.000 |
|
| 3 spectra, YTAGPQPLNIFYK |
0.051 |
|
0.000 |
|
0.825 |
0.049 |
0.075 |
0.000 |
0.000 |
|
| 1 spectrum, EASVVK |
0.000 |
|
0.131 |
|
0.546 |
0.279 |
0.044 |
0.000 |
0.000 |
|
| 1 spectrum, TPEAIELCK |
0.000 |
|
0.282 |
|
0.000 |
0.261 |
0.281 |
0.176 |
0.000 |
|
| 2 spectra, IGFSAADAVTGLK |
0.000 |
|
0.381 |
|
0.335 |
0.265 |
0.000 |
0.018 |
0.000 |
|
| 1 spectrum, EETQGITDTYK |
0.000 |
|
0.258 |
|
0.190 |
0.425 |
0.000 |
0.127 |
0.000 |
|
| 2 spectra, ECVGASNQNCR |
0.000 |
|
0.077 |
|
0.534 |
0.000 |
0.387 |
0.002 |
0.000 |
|
| 1 spectrum, LLGNIDGR |
0.000 |
|
0.000 |
|
0.999 |
0.000 |
0.000 |
0.000 |
0.001 |
|
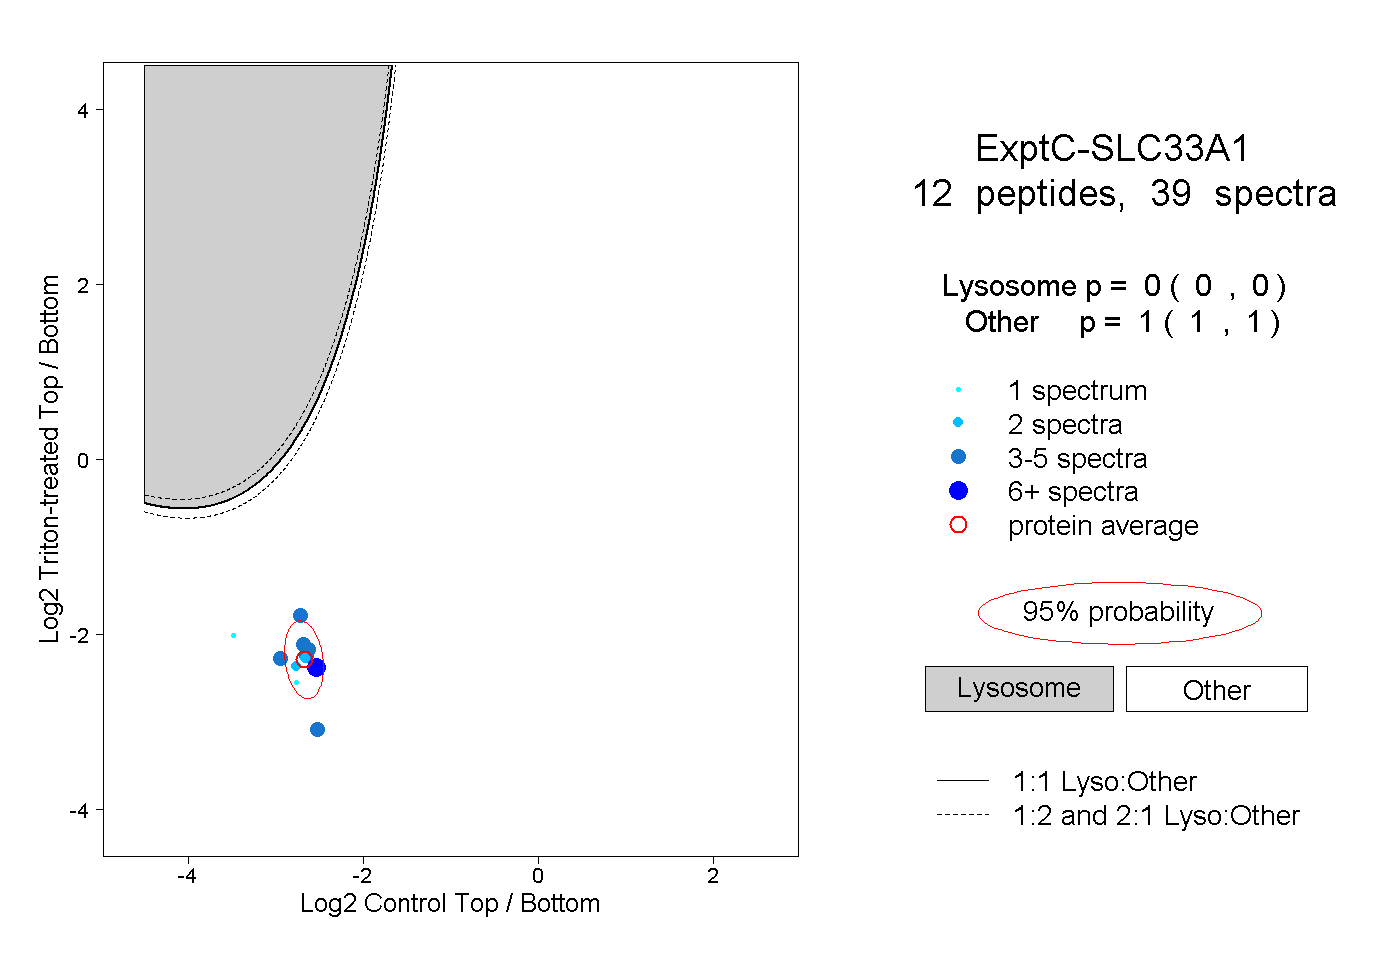
| | | Plot |
|
Lyso |
|
|
|
|
|
|
|
Other |
| Expt C |
12
peptides |
39
spectra |
 |
|
0.000
0.000 | 0.000 |
|
|
|
|
|
|
|
1.000
1.000 | 1.000 |
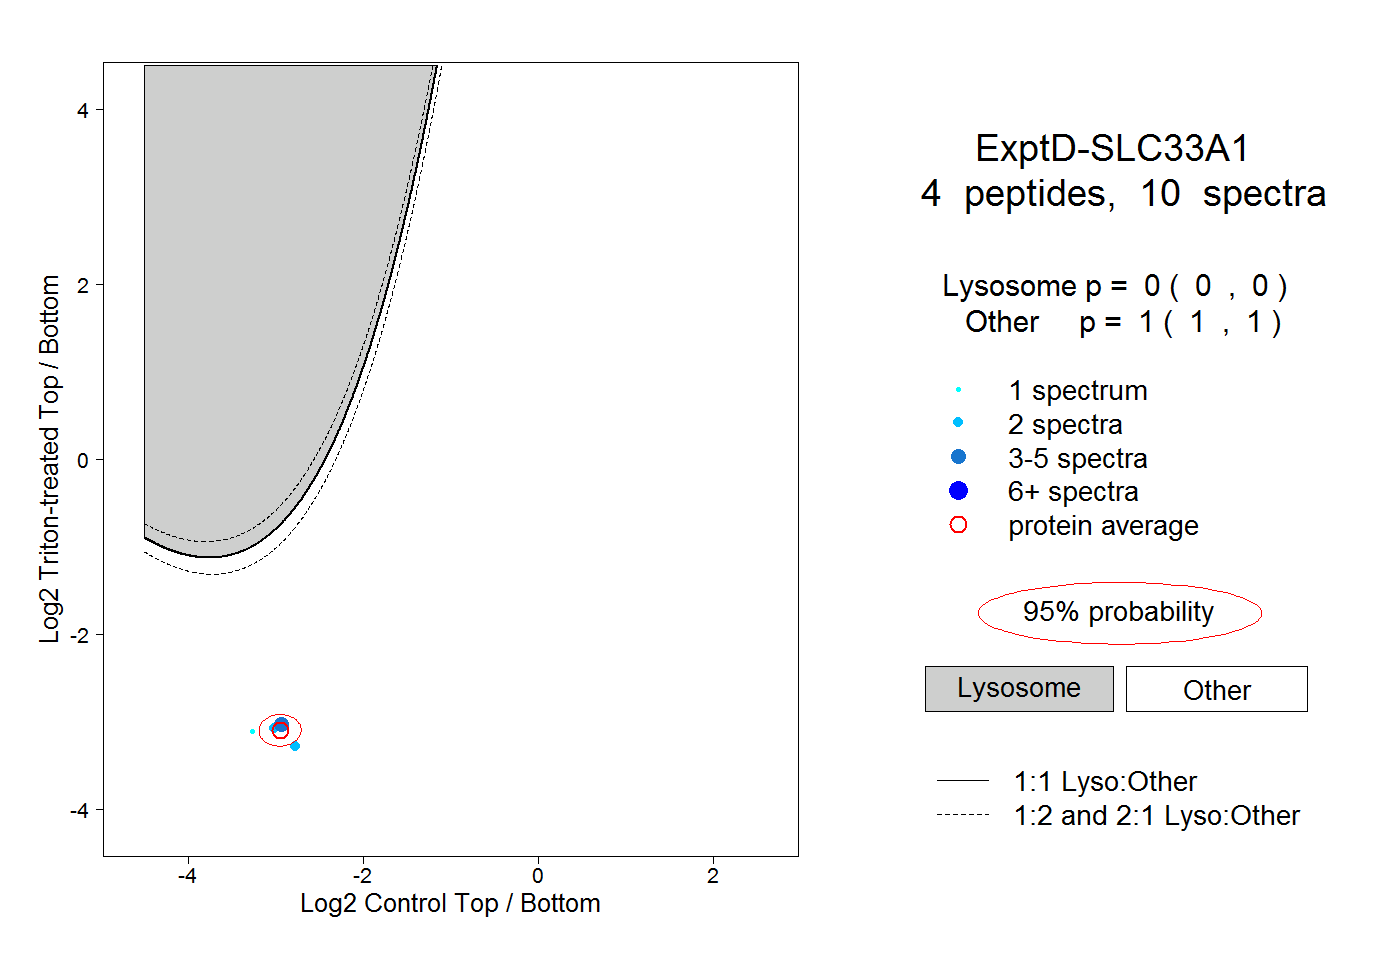
| | | Plot |
|
Lyso |
|
|
|
|
|
|
|
Other |
| Expt D |
4
peptides |
10
spectra |
 |
|
0.000
0.000 | 0.000 |
|
|
|
|
|
|
|
1.000
1.000 | 1.000 |