 12
12peptides
spectra
0.000 | 0.000
0.000 | 0.000
0.000 | 0.000
0.795 | 0.835
0.145 | 0.188
0.000 | 0.007
0.000 | 0.000
0.006 | 0.016
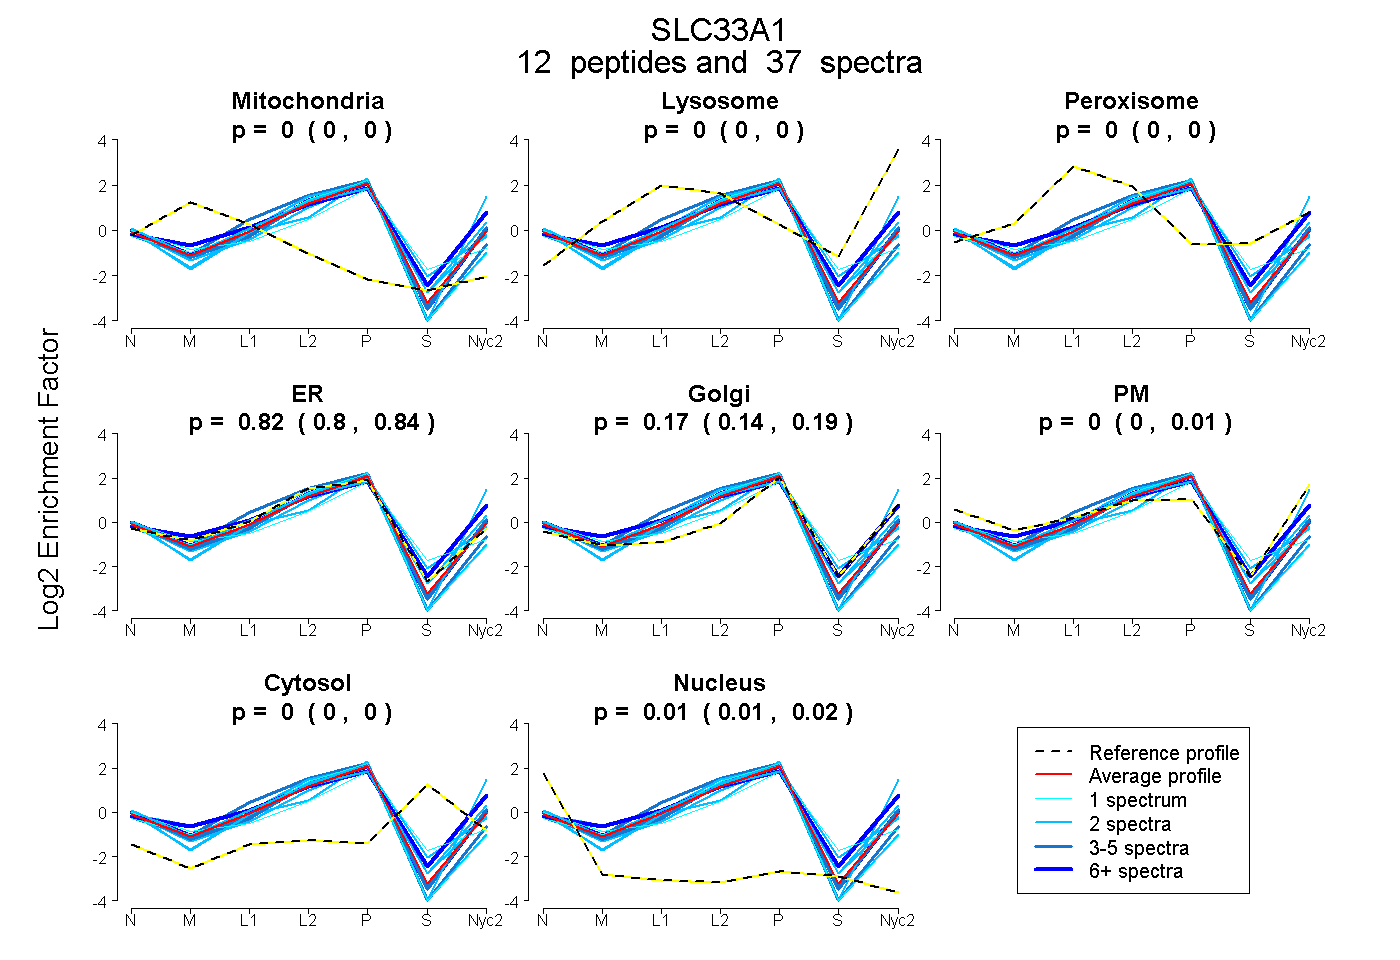
| Plot | Mito | Lyso | Perox | ER | Golgi | PM | Cytosol | Nucleus | |||||
| Expt A |
12 peptides |
37 spectra |
|
0.000 0.000 | 0.000 |
0.000 0.000 | 0.000 |
0.000 0.000 | 0.000 |
0.818 0.795 | 0.835 |
0.170 0.145 | 0.188 |
0.000 0.000 | 0.007 |
0.000 0.000 | 0.000 |
0.011 0.006 | 0.016 |
| 1 spectrum, SGPLPPGGWDDNHQDSVGGEGDR | 0.000 | 0.000 | 0.000 | 0.674 | 0.156 | 0.000 | 0.113 | 0.058 | ||
| 1 spectrum, TPEAIELCK | 0.000 | 0.000 | 0.000 | 0.955 | 0.000 | 0.000 | 0.000 | 0.045 | ||
| 2 spectra, LLWAPLVDAVYFK | 0.000 | 0.000 | 0.000 | 0.844 | 0.127 | 0.000 | 0.000 | 0.029 | ||
| 2 spectra, EETQGITDTYK | 0.000 | 0.000 | 0.000 | 0.695 | 0.217 | 0.000 | 0.074 | 0.014 | ||
| 7 spectra, FQPQPR | 0.000 | 0.000 | 0.000 | 0.799 | 0.162 | 0.035 | 0.000 | 0.005 | ||
| 2 spectra, YTAGPQPLNIFYK | 0.000 | 0.000 | 0.000 | 0.662 | 0.117 | 0.216 | 0.000 | 0.005 | ||
| 3 spectra, IGFSAADAVTGLK | 0.000 | 0.000 | 0.000 | 0.804 | 0.195 | 0.000 | 0.000 | 0.001 | ||
| 5 spectra, ECVGASNQNCR | 0.000 | 0.000 | 0.000 | 1.000 | 0.000 | 0.000 | 0.000 | 0.000 | ||
| 3 spectra, ILFSILK | 0.000 | 0.000 | 0.000 | 0.787 | 0.207 | 0.005 | 0.000 | 0.001 | ||
| 7 spectra, LQDEGPSSWK | 0.000 | 0.079 | 0.000 | 0.501 | 0.197 | 0.224 | 0.000 | 0.000 | ||
| 2 spectra, EVLLGDVGPGDFPK | 0.000 | 0.000 | 0.000 | 0.852 | 0.033 | 0.000 | 0.000 | 0.114 | ||
| 2 spectra, LLGNIDGR | 0.000 | 0.000 | 0.000 | 0.409 | 0.049 | 0.543 | 0.000 | 0.000 |
| Plot | Mito | Lyso or Perox | ER | Golgi | PM | Cytosol | Nucleus | ||||||
| Expt B |
7 peptides |
11 spectra |
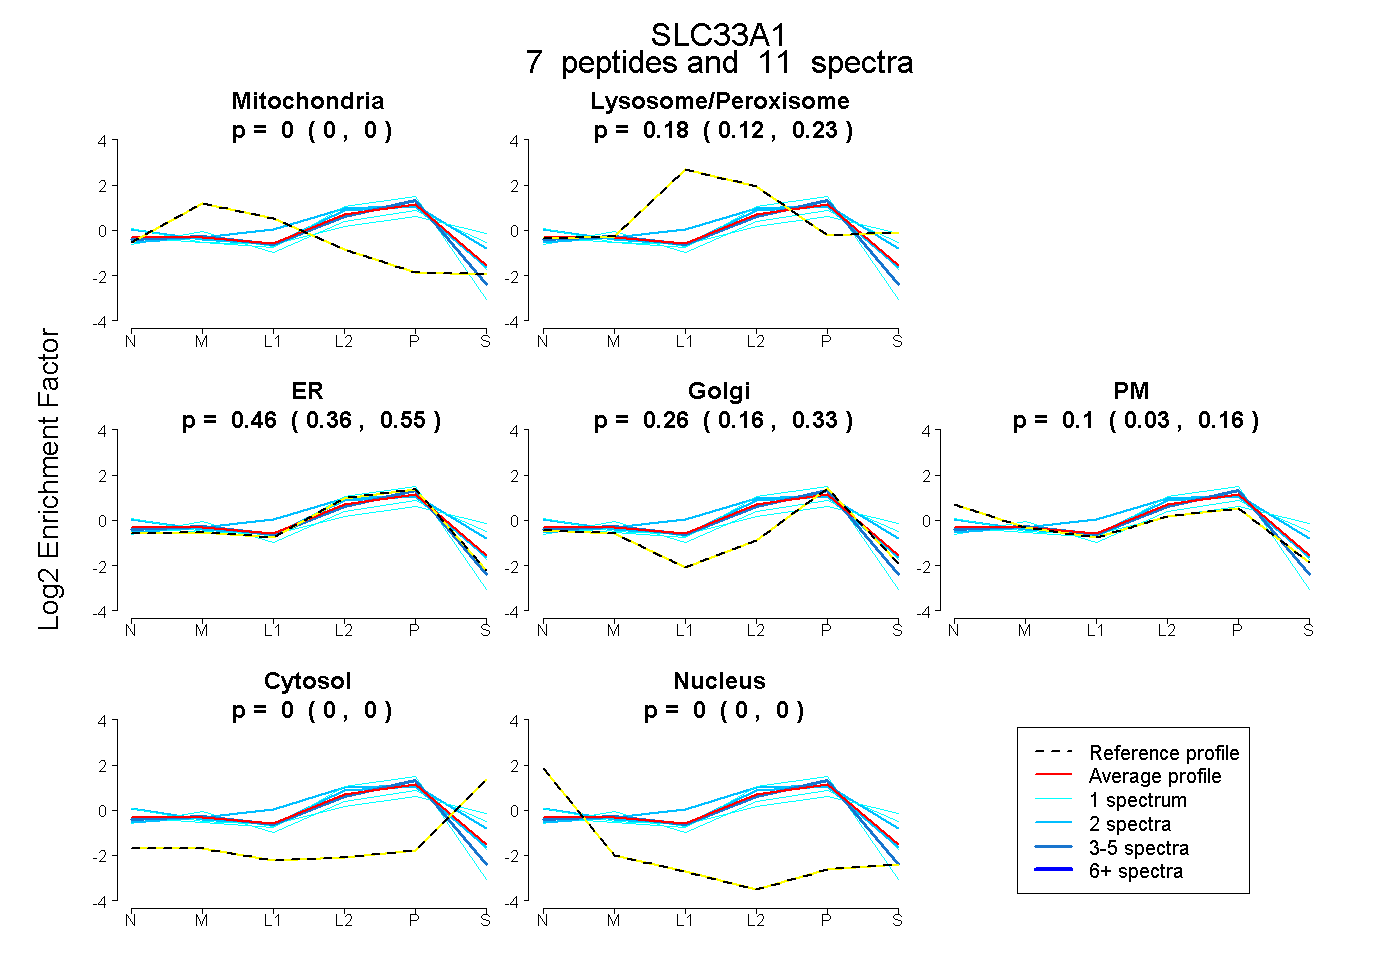 |
0.000 0.000 | 0.000 |
0.183 0.122 | 0.226 |
0.459 0.364 | 0.545 |
0.258 0.159 | 0.334 |
0.100 0.034 | 0.158 |
0.000 0.000 | 0.000 |
0.000 0.000 | 0.000 |
|||
| Plot | Lyso | Other | |||||||||||
| Expt C |
12 peptides |
39 spectra |
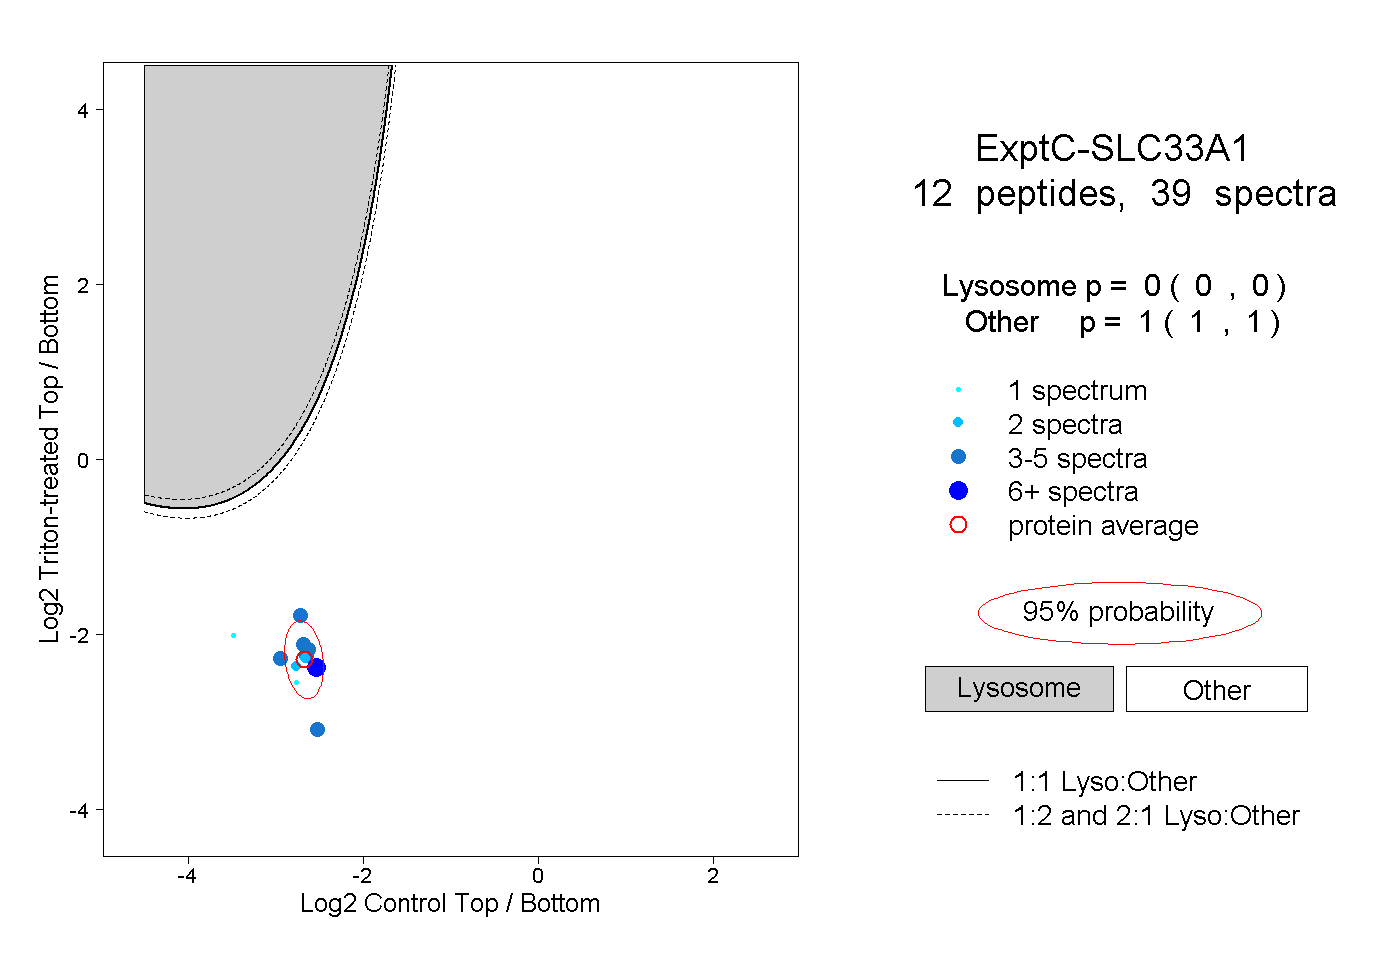 |
0.000 0.000 | 0.000 |
1.000 1.000 | 1.000 |
||||||||
| Plot | Lyso | Other | |||||||||||
| Expt D |
4 peptides |
10 spectra |
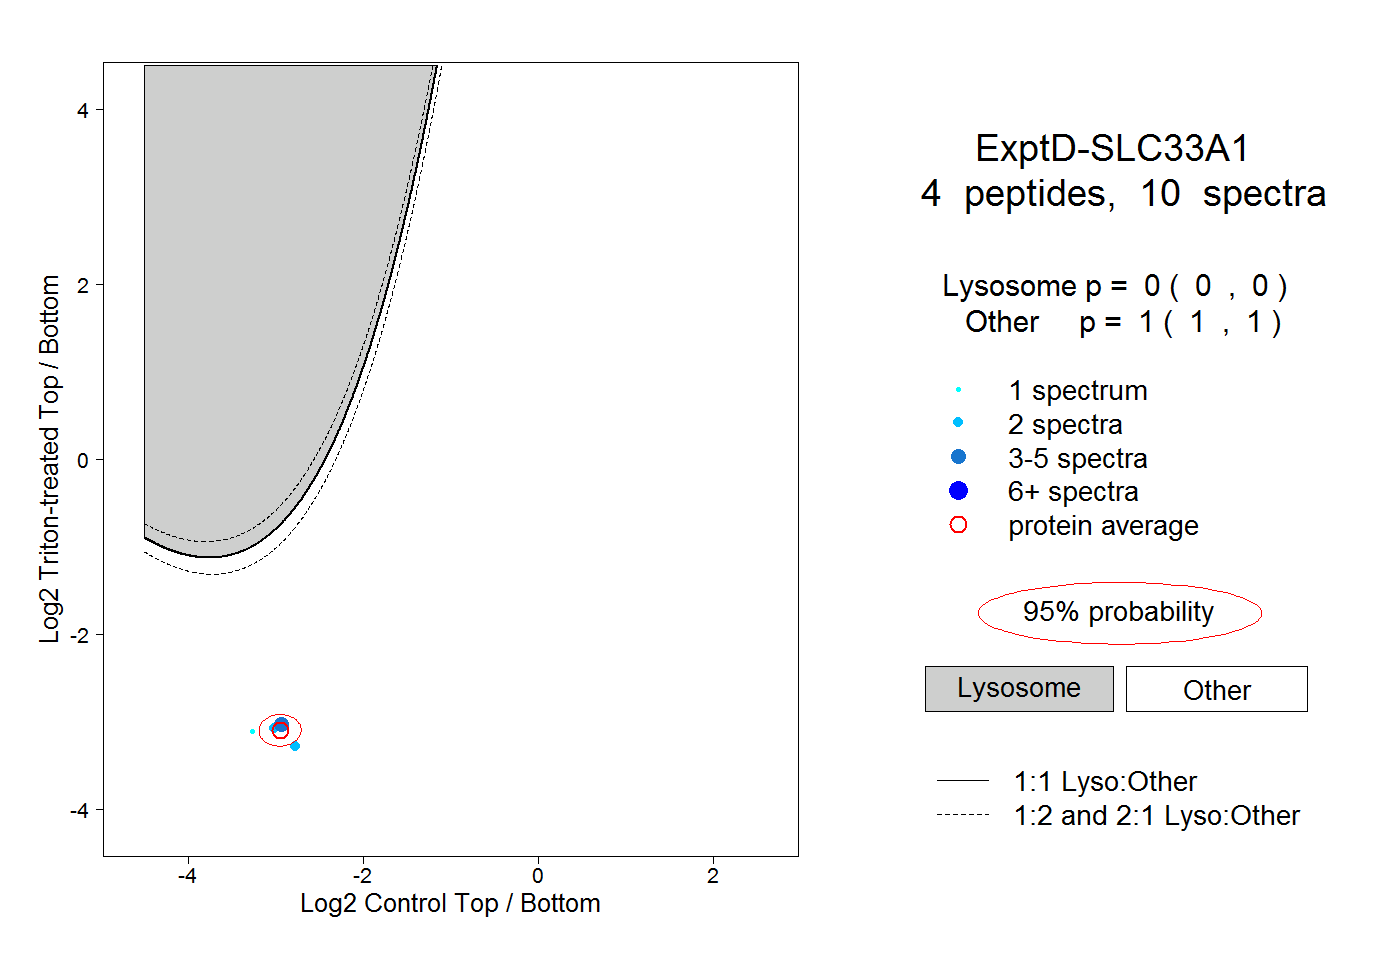 |
0.000 0.000 | 0.000 |
1.000 1.000 | 1.000 |