 21
21peptides
spectra
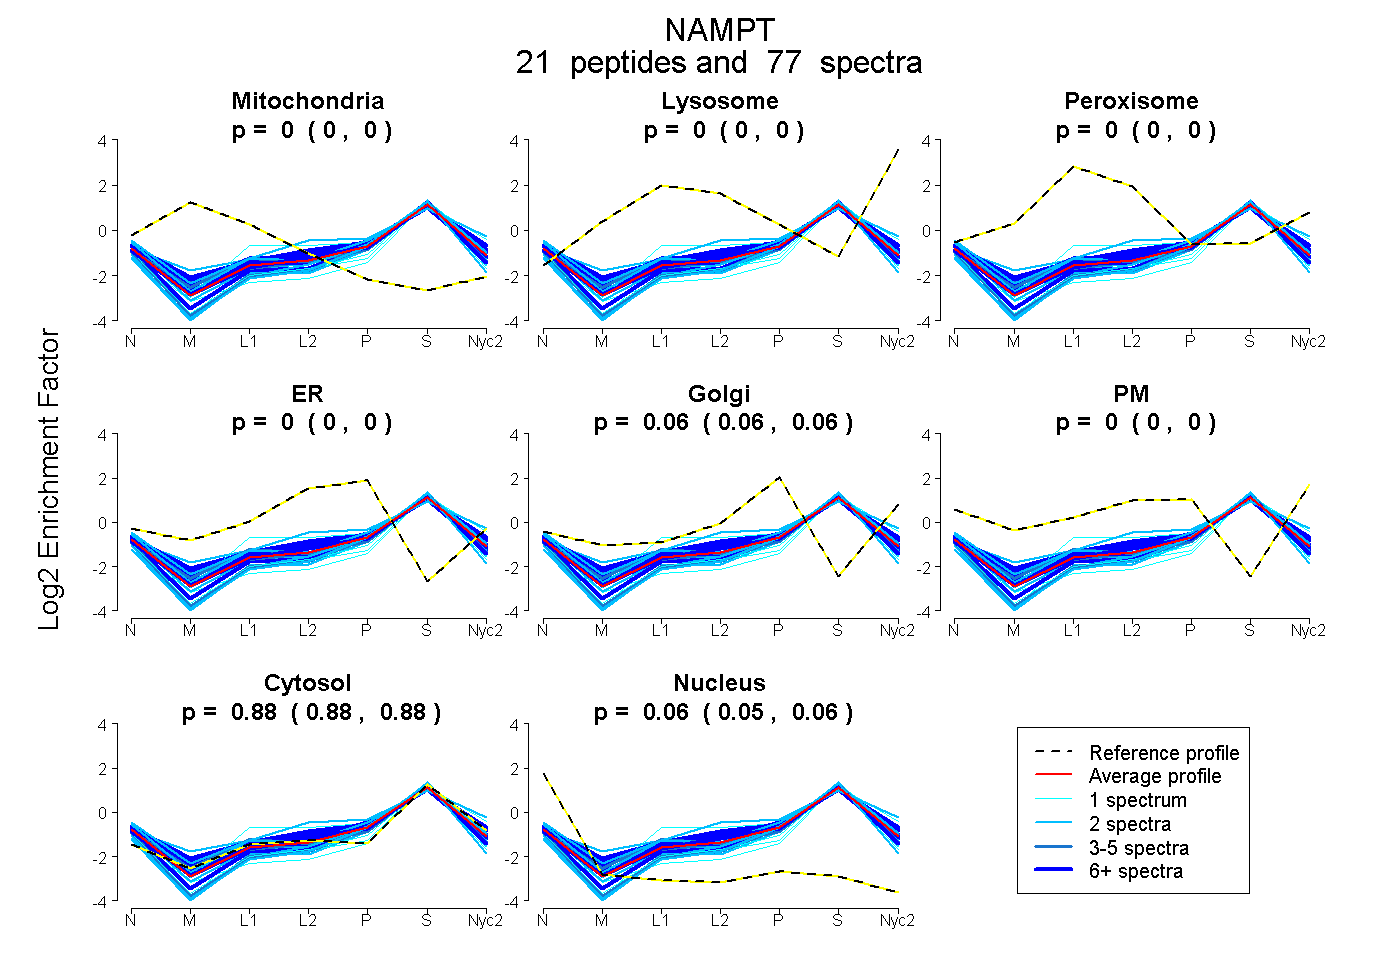
0.000 | 0.000
0.000 | 0.000
0.000 | 0.000
0.000 | 0.000
0.058 | 0.062
0.000 | 0.000
0.882 | 0.885
0.055 | 0.058
13peptides
spectra
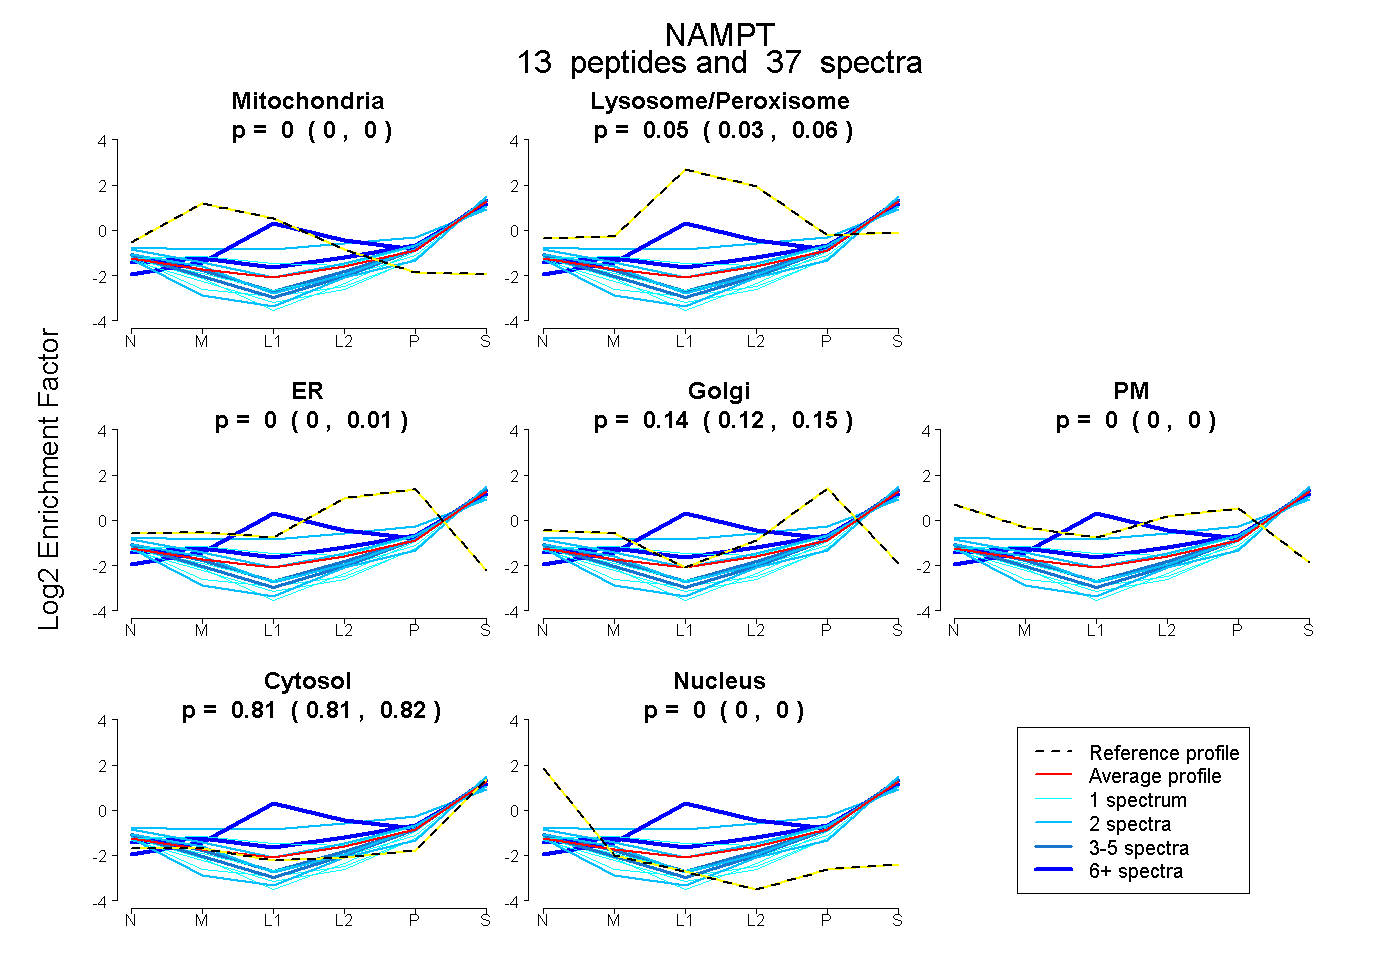
0.000 | 0.000
0.025 | 0.063
0.000 | 0.010
0.121 | 0.148
0.000 | 0.000
0.806 | 0.823
0.000 | 0.000
21peptides
spectra
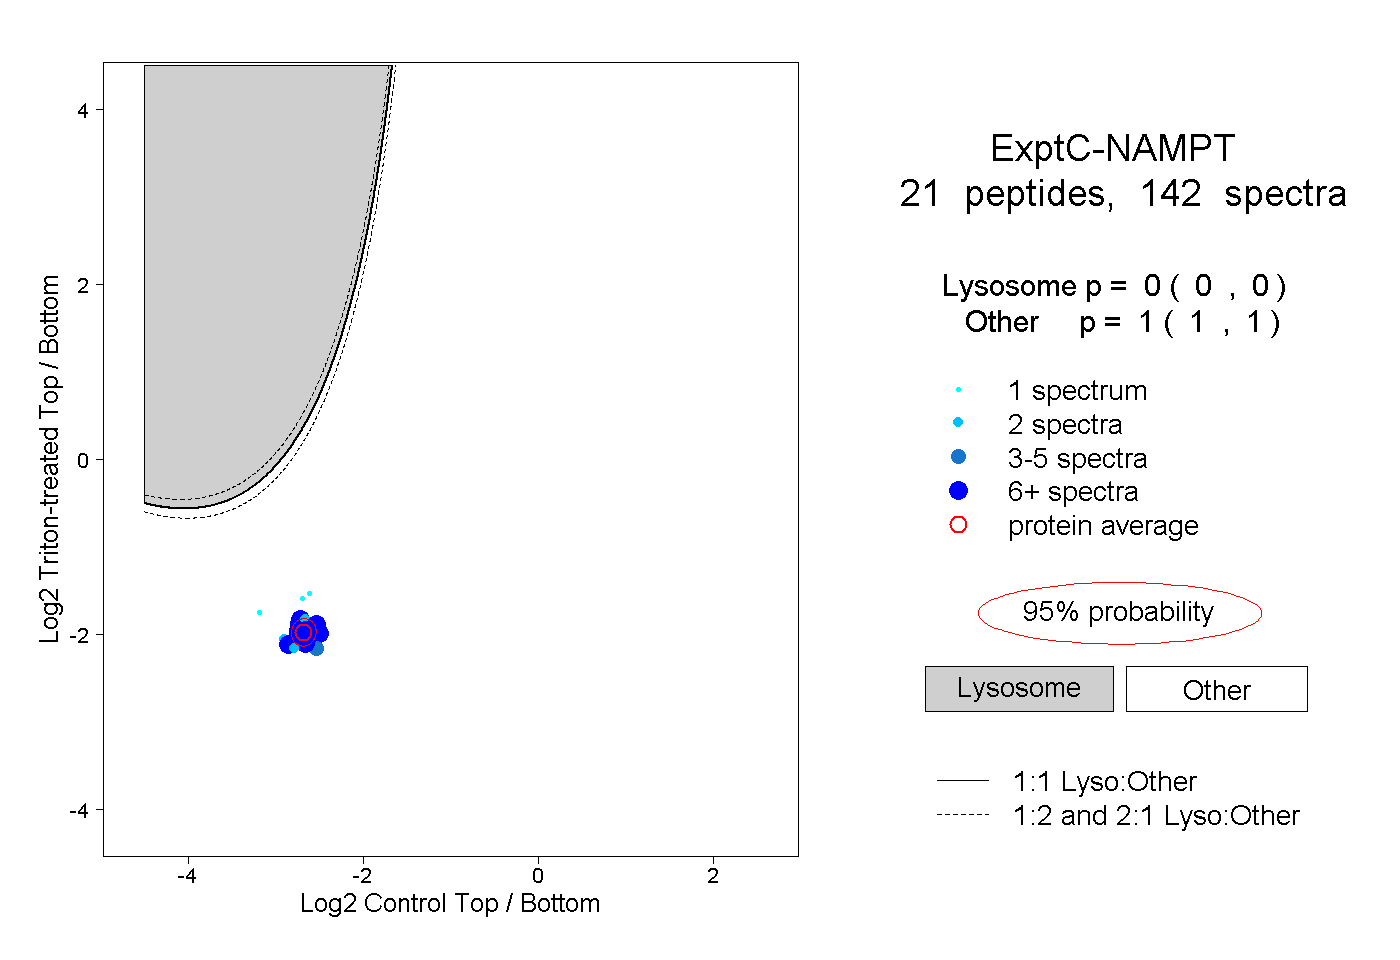
0.000 | 0.000
1.000 | 1.000
4peptides
spectra
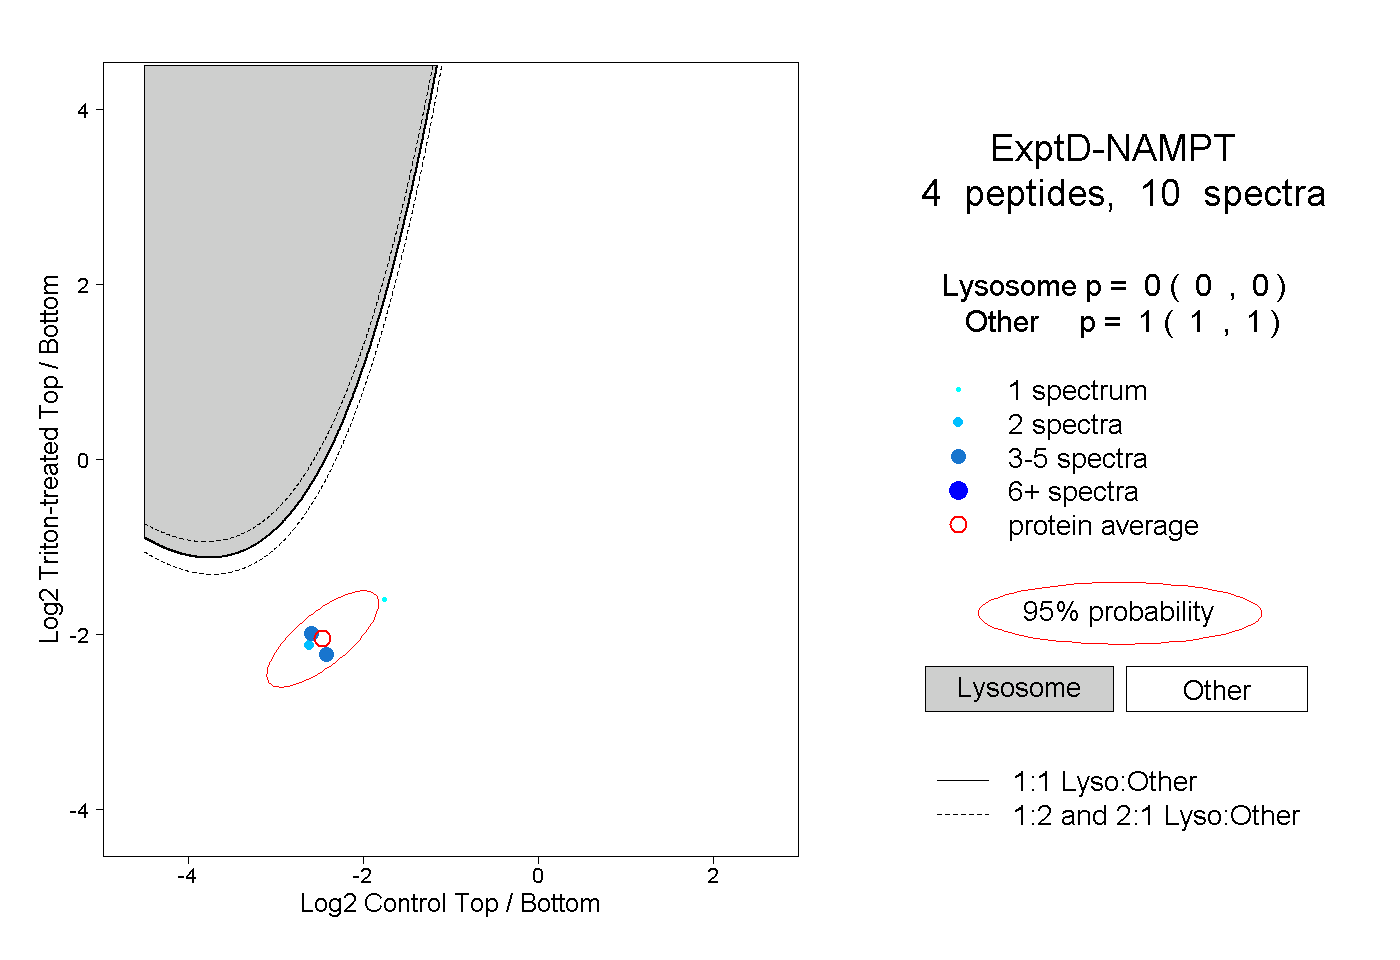
0.000 | 0.000
1.000 | 1.000