 21
21peptides
spectra
0.000 | 0.000
0.000 | 0.000
0.000 | 0.000
0.000 | 0.000
0.058 | 0.062
0.000 | 0.000
0.882 | 0.885
0.055 | 0.058
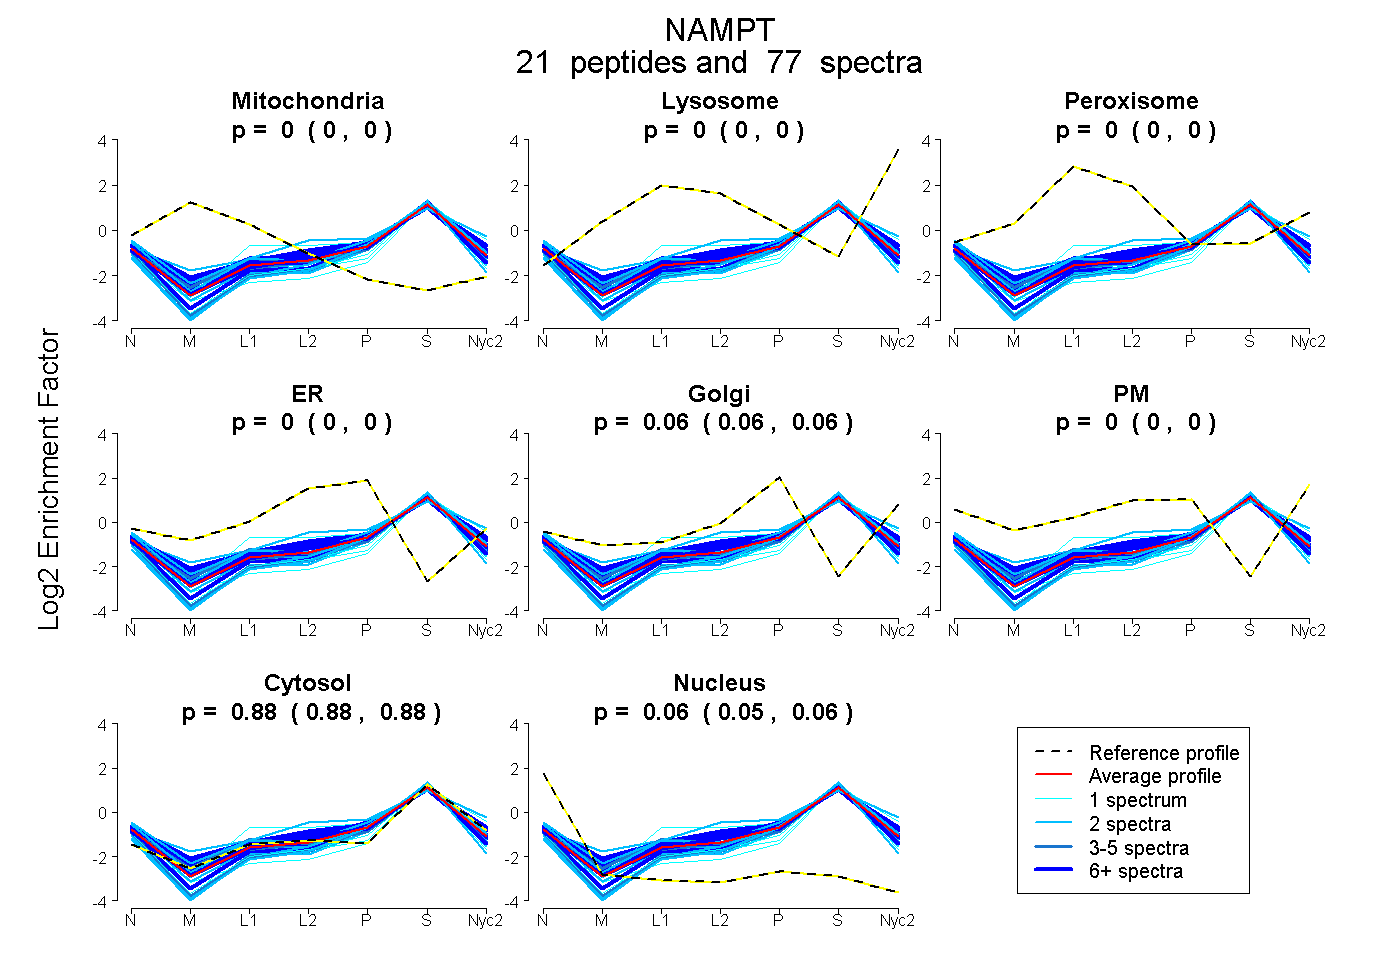
| Plot | Mito | Lyso | Perox | ER | Golgi | PM | Cytosol | Nucleus | |||||
| Expt A |
21 peptides |
77 spectra |
|
0.000 0.000 | 0.000 |
0.000 0.000 | 0.000 |
0.000 0.000 | 0.000 |
0.000 0.000 | 0.000 |
0.060 0.058 | 0.062 |
0.000 0.000 | 0.000 |
0.883 0.882 | 0.885 |
0.056 0.055 | 0.058 |
| 2 spectra, YYGTK | 0.000 | 0.000 | 0.000 | 0.032 | 0.000 | 0.197 | 0.771 | 0.000 | ||
| 2 spectra, TPAGTFVTLEEGK | 0.000 | 0.000 | 0.000 | 0.000 | 0.000 | 0.000 | 0.945 | 0.055 | ||
| 2 spectra, VYSYFECR | 0.000 | 0.000 | 0.000 | 0.089 | 0.010 | 0.000 | 0.830 | 0.071 | ||
| 2 spectra, DLLNCSFK | 0.032 | 0.000 | 0.000 | 0.136 | 0.000 | 0.000 | 0.826 | 0.006 | ||
| 1 spectrum, WSIENVSFGSGGALLQK | 0.000 | 0.000 | 0.000 | 0.000 | 0.000 | 0.000 | 0.873 | 0.127 | ||
| 7 spectra, YDGHLPIEVK | 0.000 | 0.000 | 0.000 | 0.045 | 0.000 | 0.000 | 0.887 | 0.068 | ||
| 4 spectra, IWGEDLR | 0.000 | 0.000 | 0.000 | 0.000 | 0.094 | 0.000 | 0.852 | 0.054 | ||
| 7 spectra, HLIVSR | 0.000 | 0.000 | 0.000 | 0.000 | 0.000 | 0.000 | 0.921 | 0.079 | ||
| 2 spectra, YLLETSGNLDGLEYK | 0.000 | 0.000 | 0.000 | 0.000 | 0.000 | 0.000 | 0.885 | 0.115 | ||
| 1 spectrum, GTDTVAGIALIK | 0.000 | 0.000 | 0.000 | 0.000 | 0.000 | 0.000 | 0.853 | 0.147 | ||
| 8 spectra, LLPPYLR | 0.000 | 0.000 | 0.000 | 0.000 | 0.083 | 0.000 | 0.869 | 0.048 | ||
| 6 spectra, QYPPNTSK | 0.000 | 0.000 | 0.000 | 0.036 | 0.112 | 0.000 | 0.840 | 0.011 | ||
| 5 spectra, AVPEGSVIPR | 0.000 | 0.000 | 0.000 | 0.000 | 0.041 | 0.000 | 0.870 | 0.089 | ||
| 9 spectra, EHFQDDVFNER | 0.000 | 0.000 | 0.000 | 0.151 | 0.000 | 0.000 | 0.814 | 0.035 | ||
| 3 spectra, VLDILGK | 0.000 | 0.000 | 0.000 | 0.000 | 0.000 | 0.000 | 0.898 | 0.102 | ||
| 2 spectra, GWNYILEK | 0.000 | 0.000 | 0.000 | 0.000 | 0.016 | 0.000 | 0.896 | 0.088 | ||
| 6 spectra, LHDFGYR | 0.000 | 0.000 | 0.000 | 0.000 | 0.089 | 0.068 | 0.832 | 0.011 | ||
| 4 spectra, SYSFDEVR | 0.000 | 0.000 | 0.000 | 0.026 | 0.040 | 0.000 | 0.898 | 0.036 | ||
| 1 spectrum, GVSSQETAGIGASAHLVNFK | 0.000 | 0.000 | 0.000 | 0.000 | 0.000 | 0.000 | 0.965 | 0.035 | ||
| 1 spectrum, NAQLNMEQDVAPH | 0.000 | 0.000 | 0.052 | 0.075 | 0.000 | 0.039 | 0.835 | 0.000 | ||
| 2 spectra, GDLEEYGHDLLHTVFK | 0.000 | 0.000 | 0.000 | 0.000 | 0.000 | 0.000 | 0.908 | 0.092 |
| Plot | Mito | Lyso or Perox | ER | Golgi | PM | Cytosol | Nucleus | ||||||
| Expt B |
13 peptides |
37 spectra |
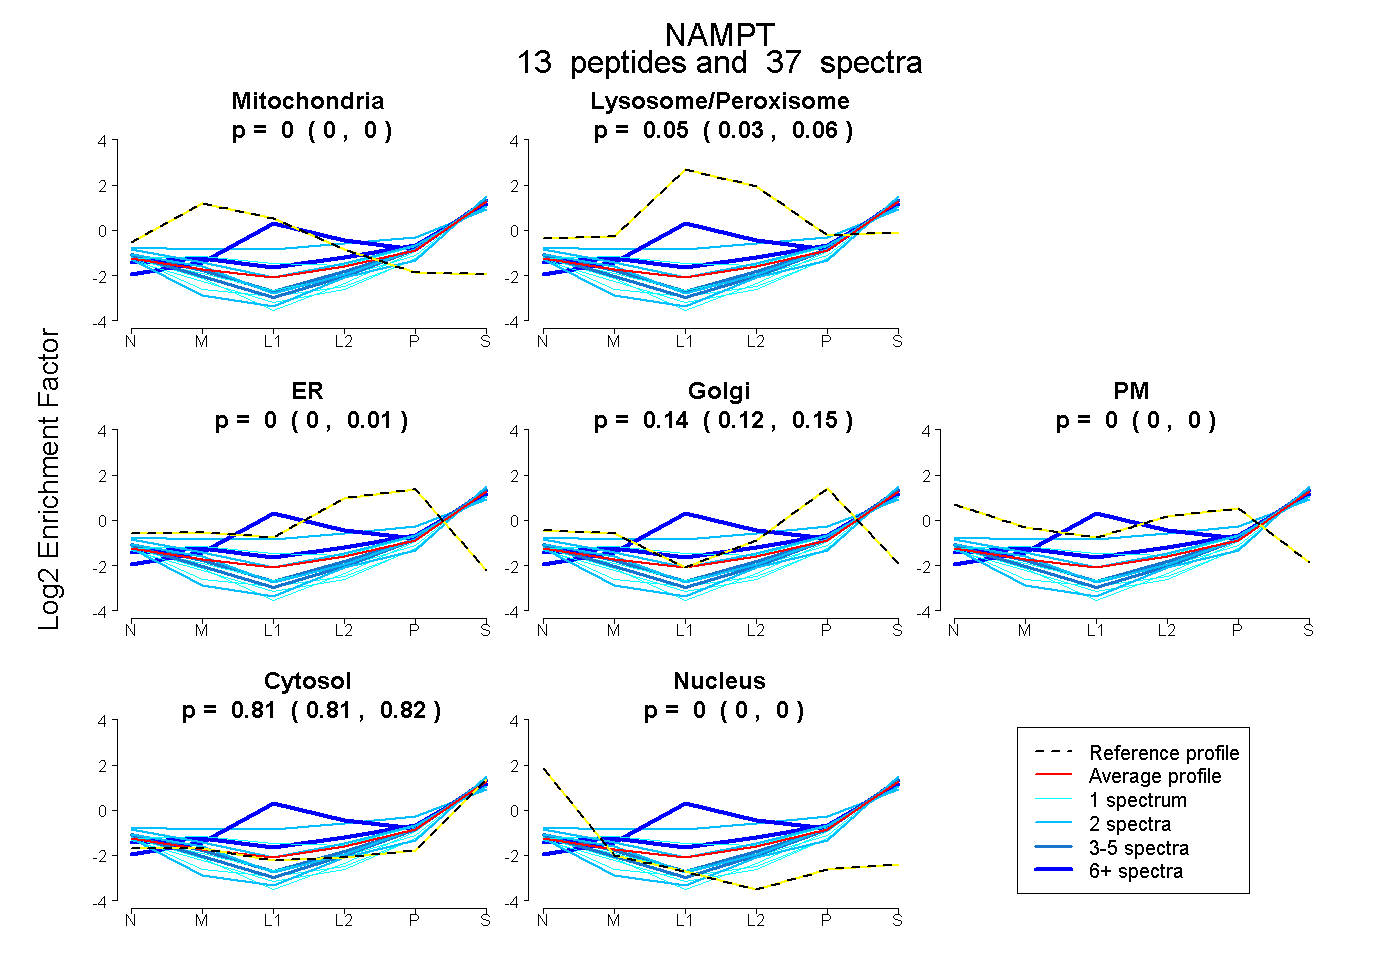 |
0.000 0.000 | 0.000 |
0.047 0.025 | 0.063 |
0.000 0.000 | 0.010 |
0.138 0.121 | 0.148 |
0.000 0.000 | 0.000 |
0.815 0.806 | 0.823 |
0.000 0.000 | 0.000 |
|||
| Plot | Lyso | Other | |||||||||||
| Expt C |
21 peptides |
142 spectra |
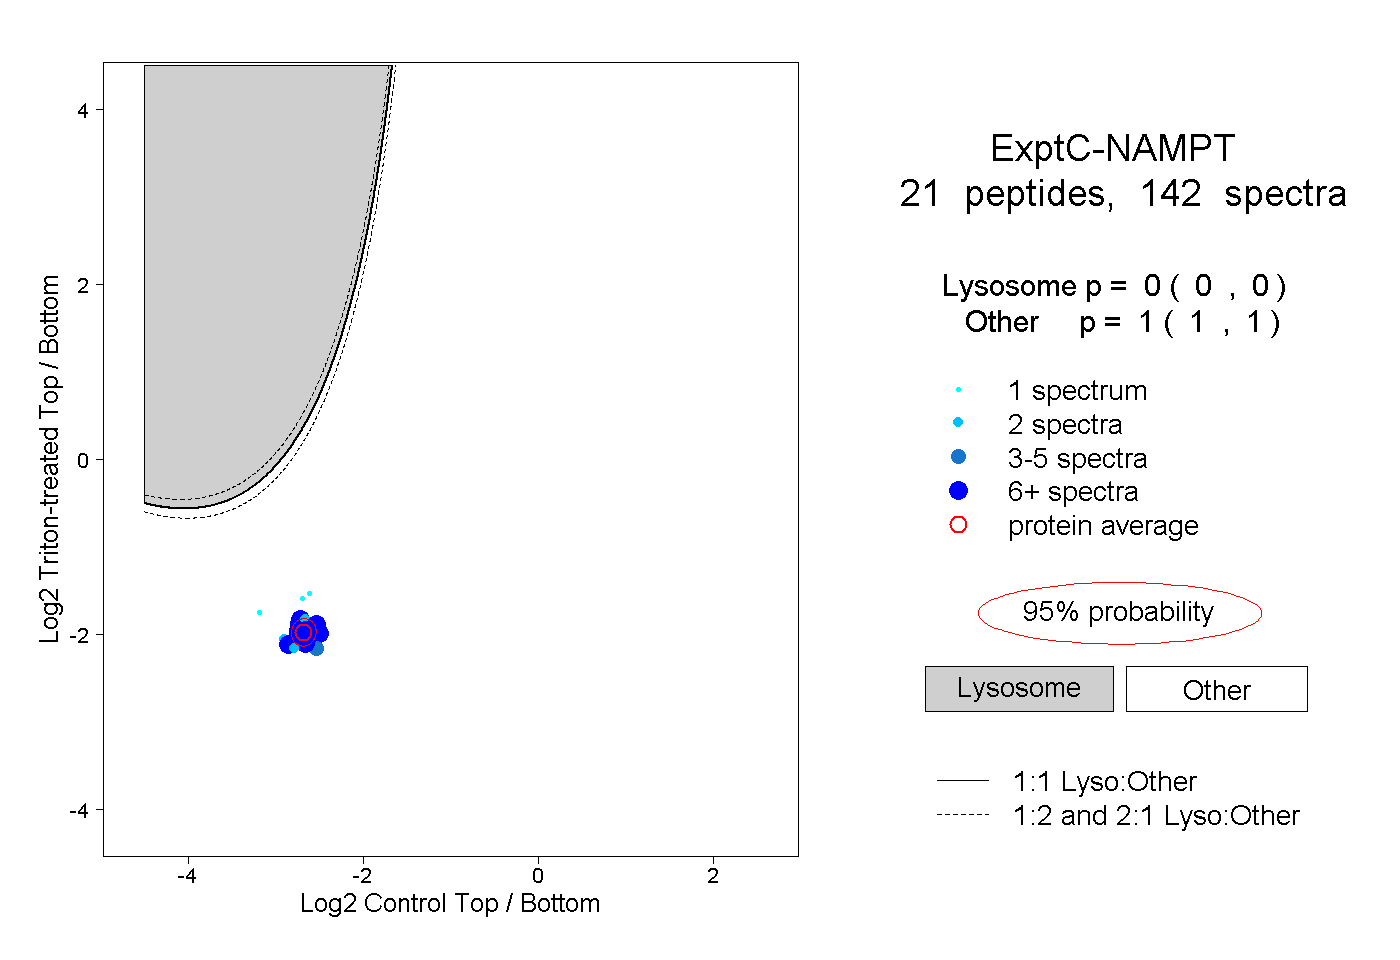 |
0.000 0.000 | 0.000 |
1.000 1.000 | 1.000 |
||||||||
| Plot | Lyso | Other | |||||||||||
| Expt D |
4 peptides |
10 spectra |
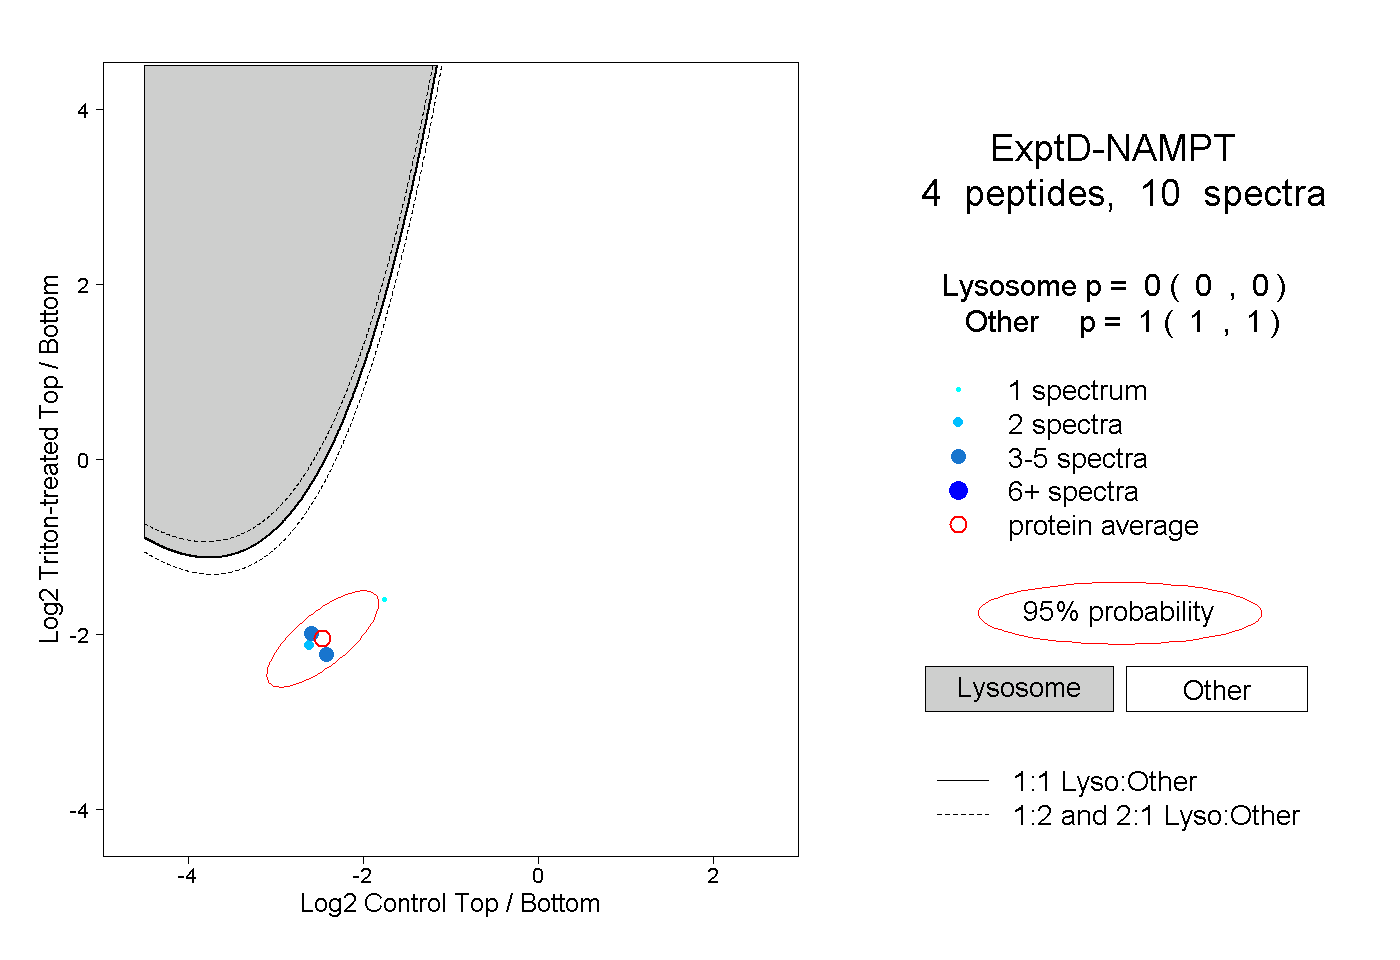 |
0.000 0.000 | 0.000 |
1.000 1.000 | 1.000 |