 16
16peptides
spectra
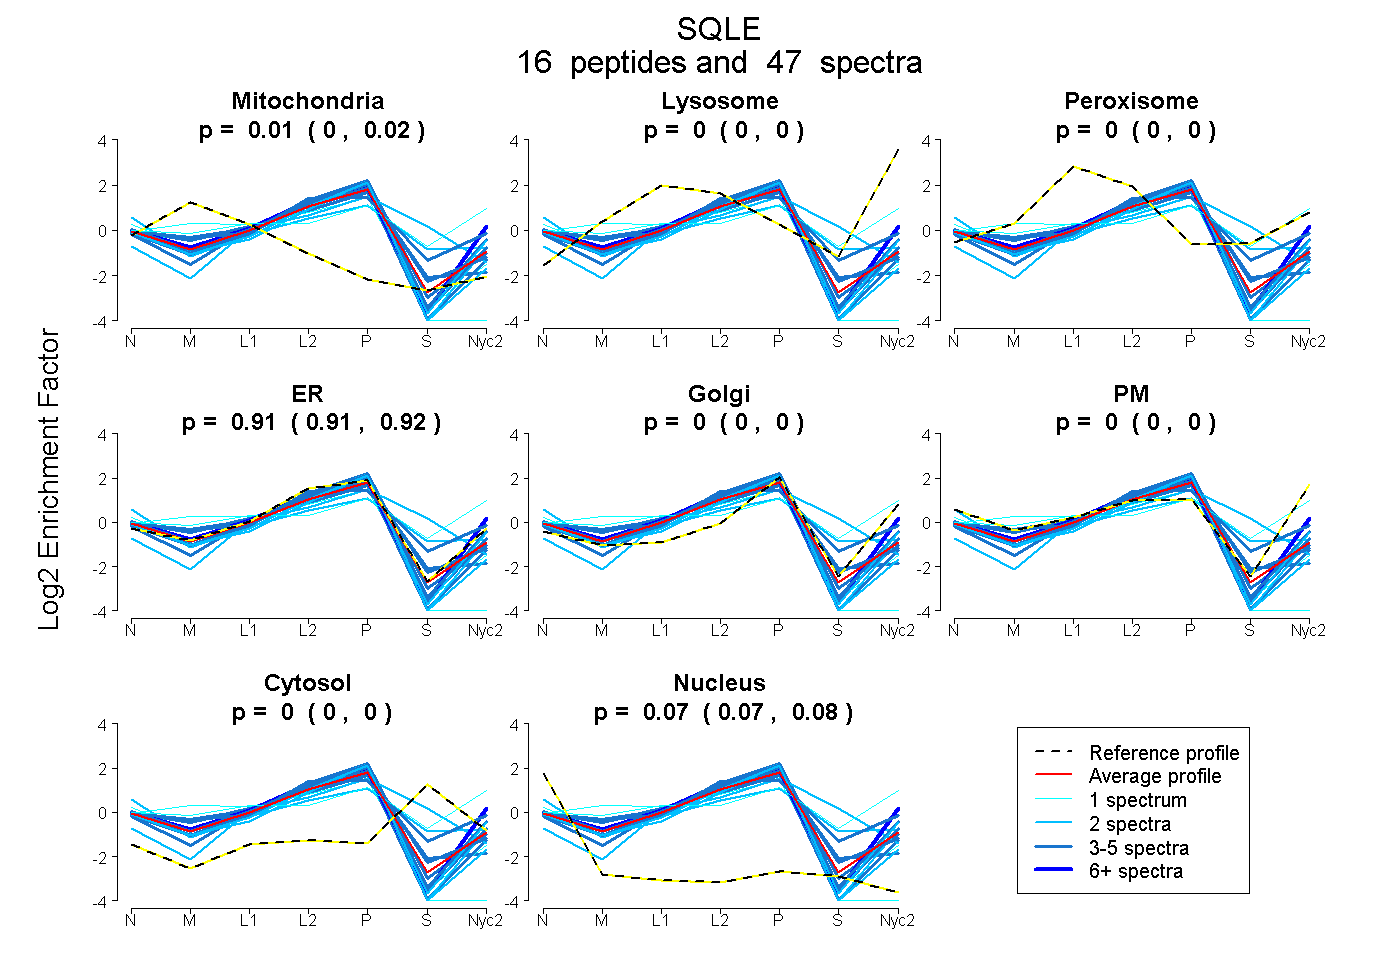
0.004 | 0.018
0.000 | 0.000
0.000 | 0.000
0.908 | 0.919
0.000 | 0.000
0.000 | 0.000
0.000 | 0.000
0.069 | 0.078
10peptides
spectra
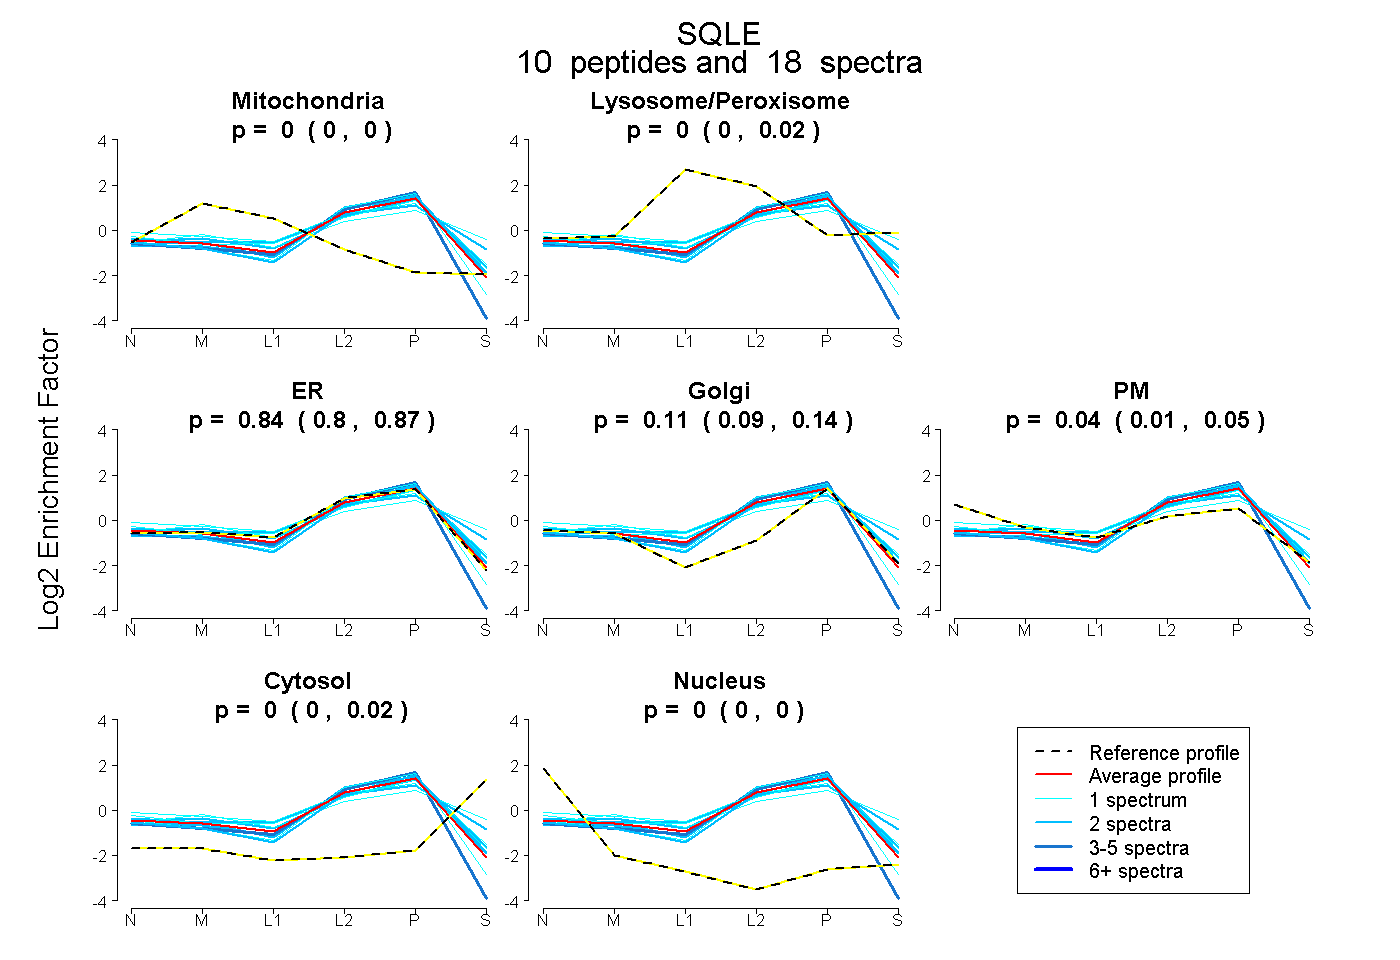
0.000 | 0.000
0.000 | 0.020
0.800 | 0.866
0.089 | 0.141
0.007 | 0.054
0.000 | 0.017
0.000 | 0.001
15peptides
spectra
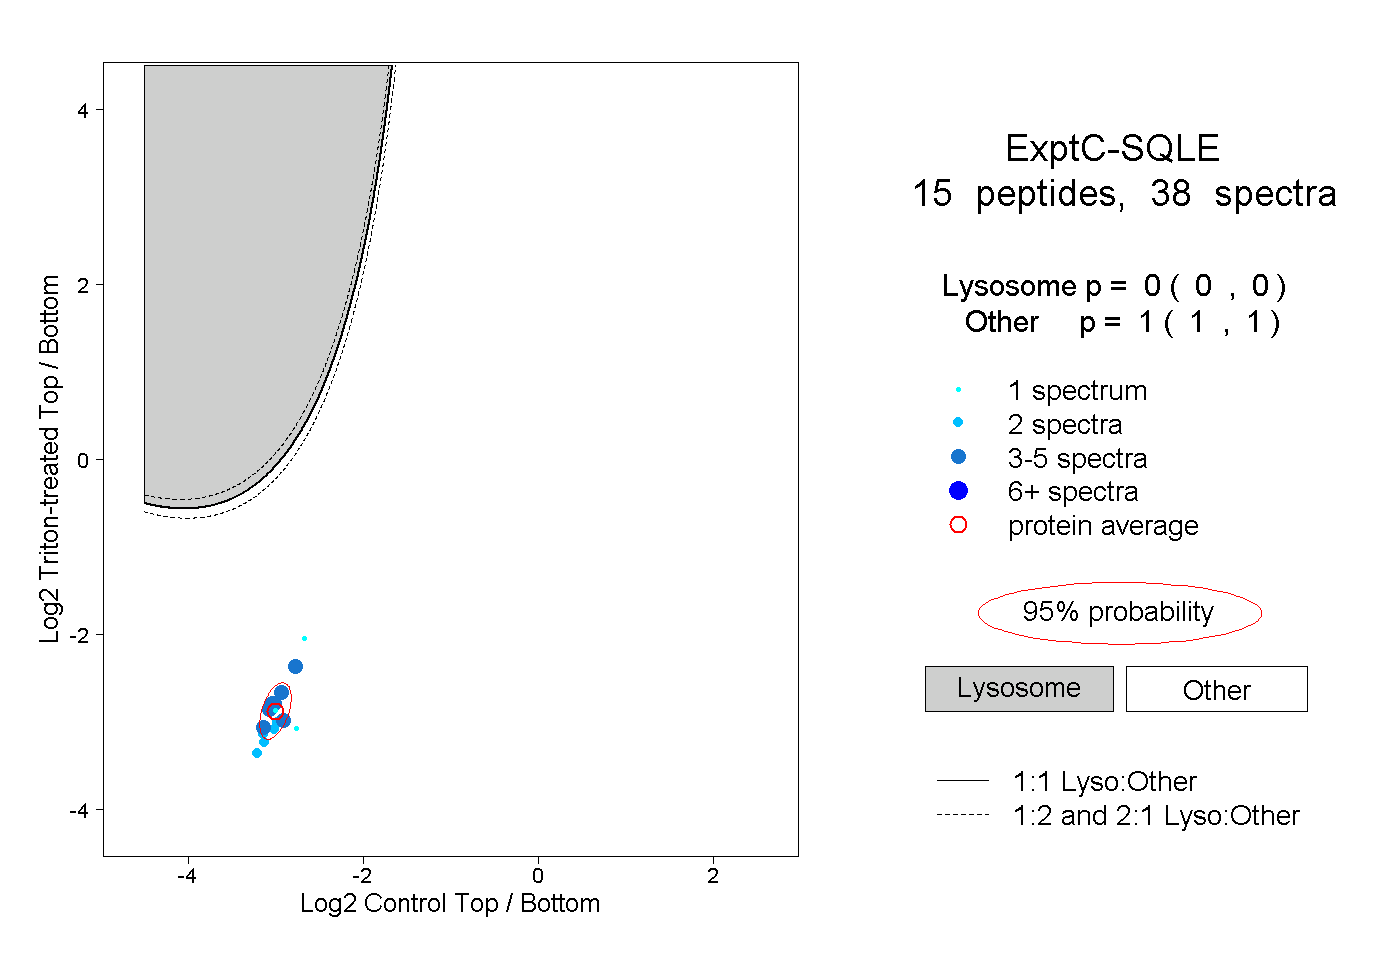
0.000 | 0.000
1.000 | 1.000
3peptides
spectra
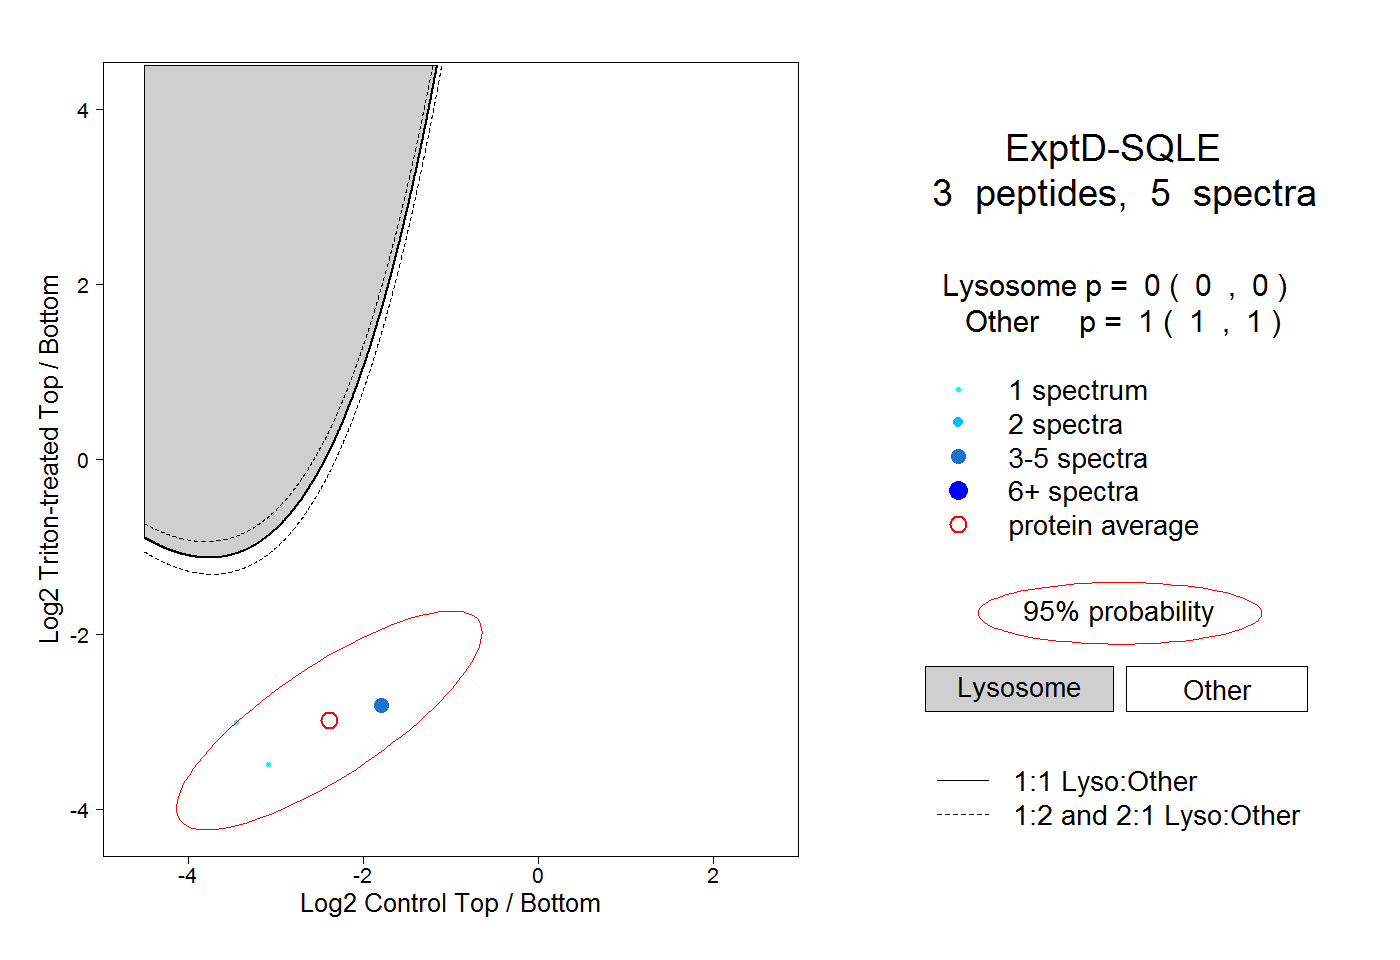
0.000 | 0.000
1.000 | 1.000