 16
16peptides
spectra
0.004 | 0.018
0.000 | 0.000
0.000 | 0.000
0.908 | 0.919
0.000 | 0.000
0.000 | 0.000
0.000 | 0.000
0.069 | 0.078
| Plot | Mito | Lyso | Perox | ER | Golgi | PM | Cytosol | Nucleus | |||||
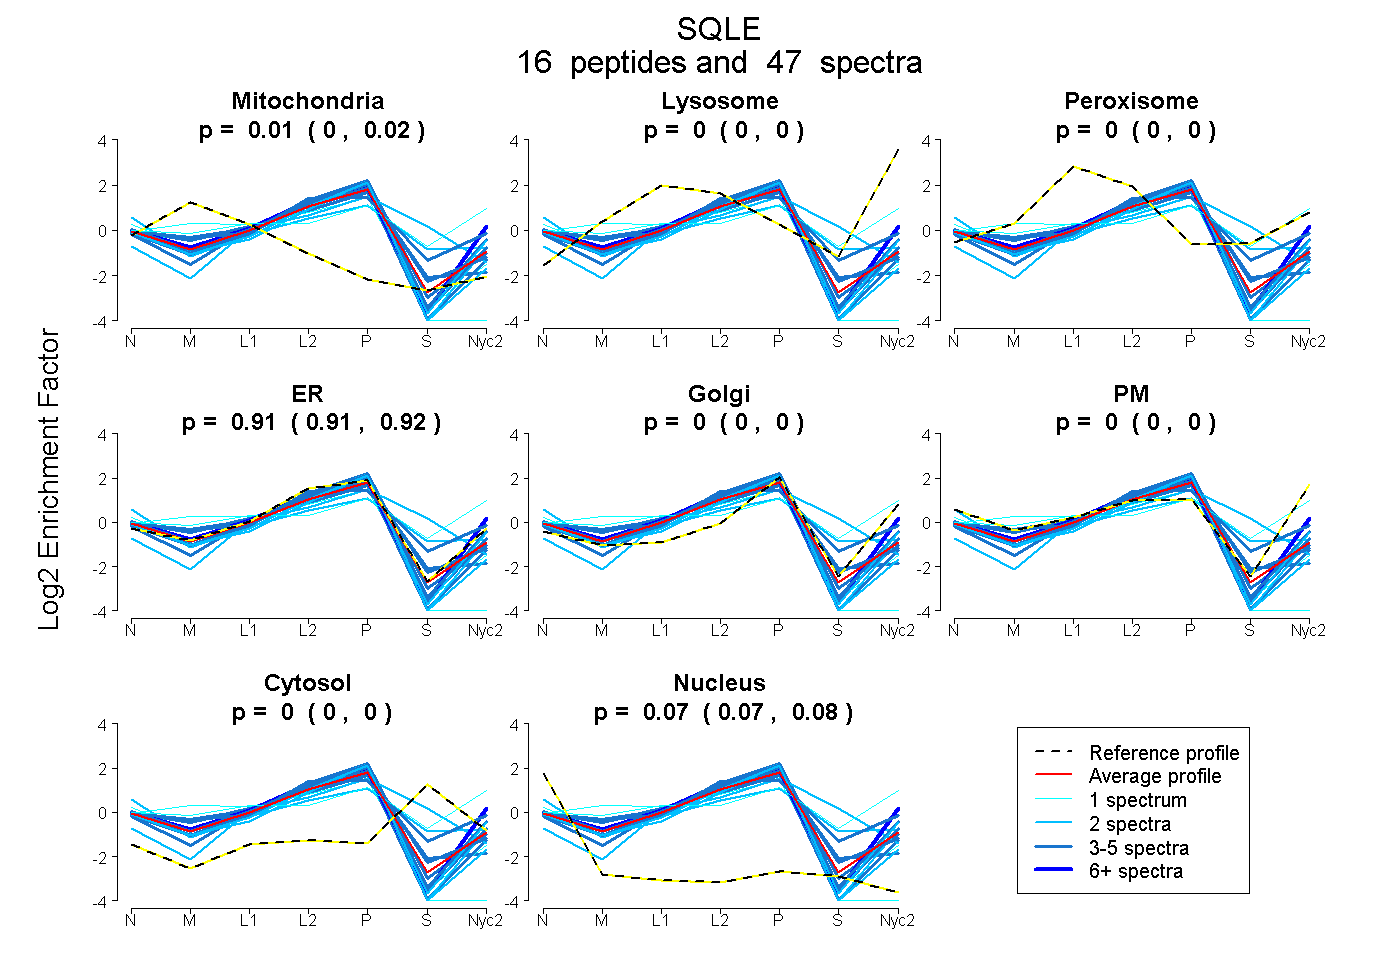
| Expt A |
16 peptides |
47 spectra |
|
0.012 0.004 | 0.018 |
0.000 0.000 | 0.000 |
0.000 0.000 | 0.000 |
0.914 0.908 | 0.919 |
0.000 0.000 | 0.000 |
0.000 0.000 | 0.000 |
0.000 0.000 | 0.000 |
0.074 0.069 | 0.078 |
| 2 spectra, EYMTEQIYPQIPDHLK | 0.000 | 0.000 | 0.005 | 0.550 | 0.000 | 0.000 | 0.445 | 0.000 | ||
| 1 spectrum, ACSIIFPLIYSEMK | 0.027 | 0.000 | 0.000 | 0.749 | 0.000 | 0.000 | 0.000 | 0.224 | ||
| 3 spectra, NLISNK | 0.000 | 0.000 | 0.114 | 0.671 | 0.000 | 0.091 | 0.124 | 0.000 | ||
| 4 spectra, ACFLYFK | 0.140 | 0.000 | 0.000 | 0.796 | 0.000 | 0.000 | 0.002 | 0.062 | ||
| 4 spectra, HPLTGGGMTVALK | 0.004 | 0.000 | 0.000 | 0.909 | 0.000 | 0.000 | 0.013 | 0.074 | ||
| 3 spectra, DIPDLYDDAAIFQAK | 0.000 | 0.000 | 0.000 | 0.946 | 0.000 | 0.000 | 0.000 | 0.054 | ||
| 1 spectrum, ALFSSGAILYK | 0.267 | 0.000 | 0.000 | 0.733 | 0.000 | 0.000 | 0.000 | 0.000 | ||
| 3 spectra, SEPWATKPR | 0.000 | 0.000 | 0.000 | 0.944 | 0.000 | 0.000 | 0.000 | 0.056 | ||
| 2 spectra, TVTVIER | 0.000 | 0.000 | 0.000 | 0.862 | 0.090 | 0.000 | 0.000 | 0.048 | ||
| 2 spectra, GVLLLGDAYNLR | 0.000 | 0.000 | 0.000 | 0.956 | 0.000 | 0.000 | 0.000 | 0.044 | ||
| 2 spectra, ILGECLQPGGYR | 0.000 | 0.000 | 0.000 | 0.876 | 0.000 | 0.000 | 0.000 | 0.124 | ||
| 2 spectra, AAMAEPNVK | 0.000 | 0.000 | 0.084 | 0.566 | 0.000 | 0.046 | 0.228 | 0.076 | ||
| 1 spectrum, VSVSSHFVGFIMK | 0.000 | 0.043 | 0.257 | 0.000 | 0.363 | 0.207 | 0.129 | 0.000 | ||
| 5 spectra, SFFWSR | 0.000 | 0.000 | 0.000 | 0.940 | 0.031 | 0.000 | 0.000 | 0.029 | ||
| 4 spectra, ESFLEACQNAR | 0.118 | 0.000 | 0.000 | 0.855 | 0.000 | 0.000 | 0.000 | 0.027 | ||
| 8 spectra, FIEGVVLR | 0.000 | 0.000 | 0.000 | 0.794 | 0.031 | 0.171 | 0.000 | 0.004 |
| Plot | Mito | Lyso or Perox | ER | Golgi | PM | Cytosol | Nucleus | ||||||
| Expt B |
10 peptides |
18 spectra |
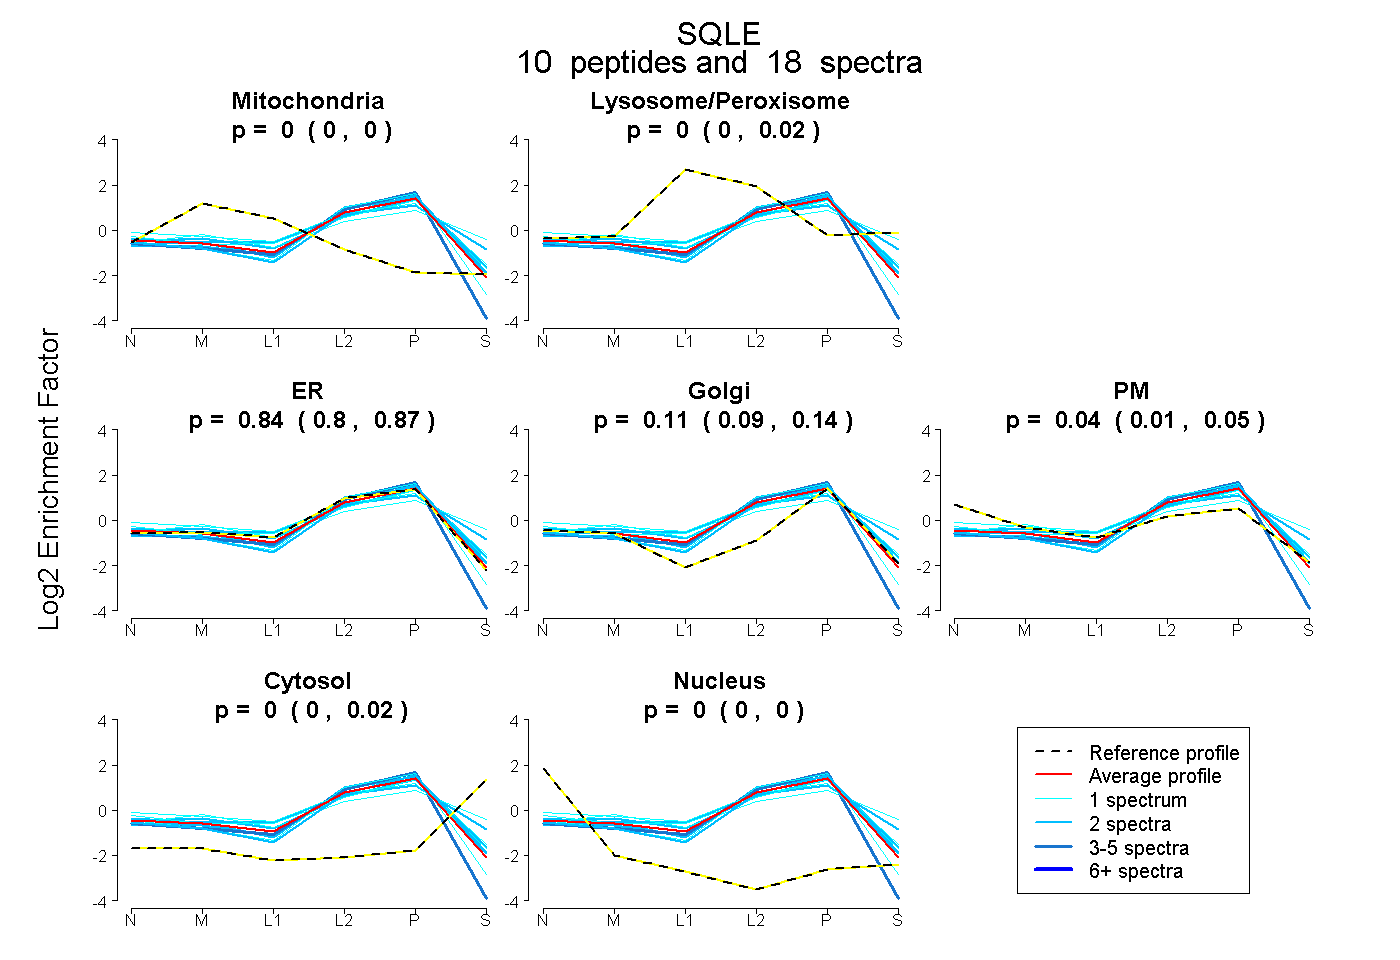 |
0.000 0.000 | 0.000 |
0.000 0.000 | 0.020 |
0.843 0.800 | 0.866 |
0.112 0.089 | 0.141 |
0.043 0.007 | 0.054 |
0.002 0.000 | 0.017 |
0.000 0.000 | 0.001 |
|||
| Plot | Lyso | Other | |||||||||||
| Expt C |
15 peptides |
38 spectra |
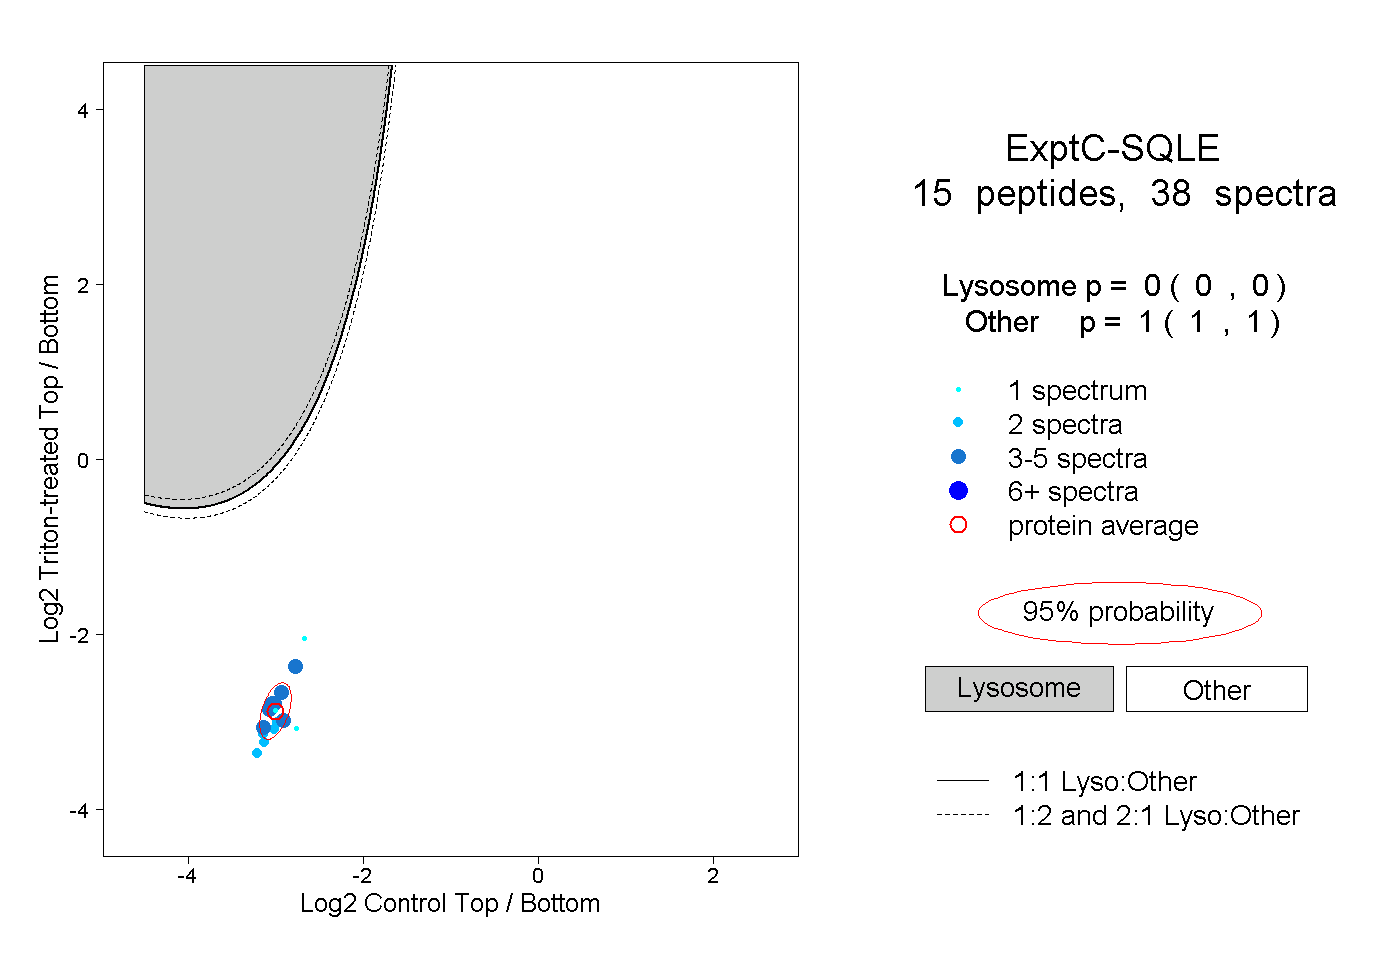 |
0.000 0.000 | 0.000 |
1.000 1.000 | 1.000 |
||||||||
| Plot | Lyso | Other | |||||||||||
| Expt D |
3 peptides |
5 spectra |
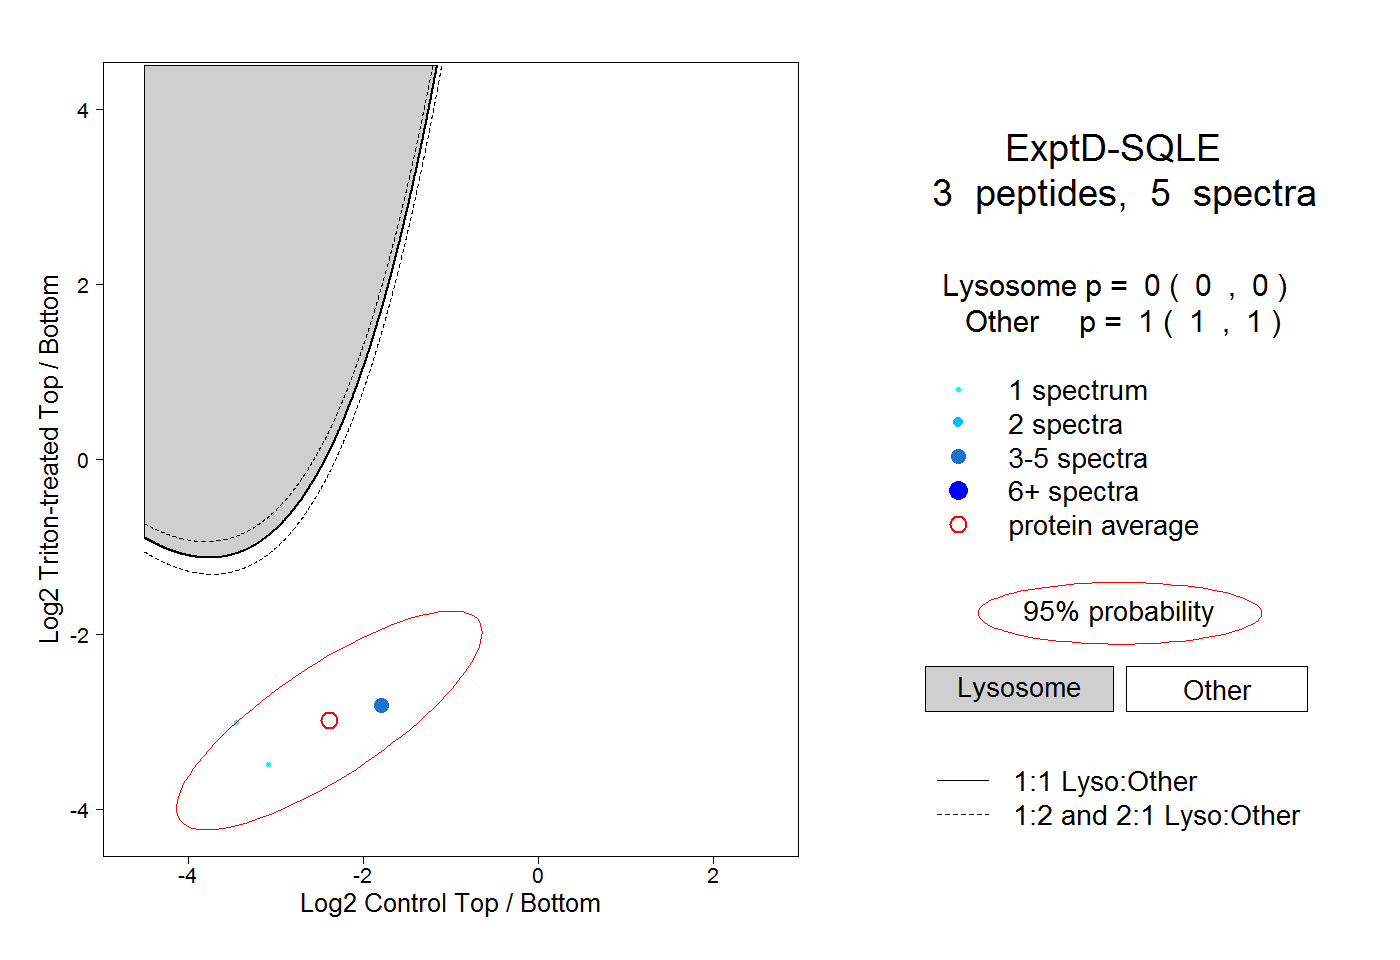 |
0.000 0.000 | 0.000 |
1.000 1.000 | 1.000 |