 9
9peptides
spectra
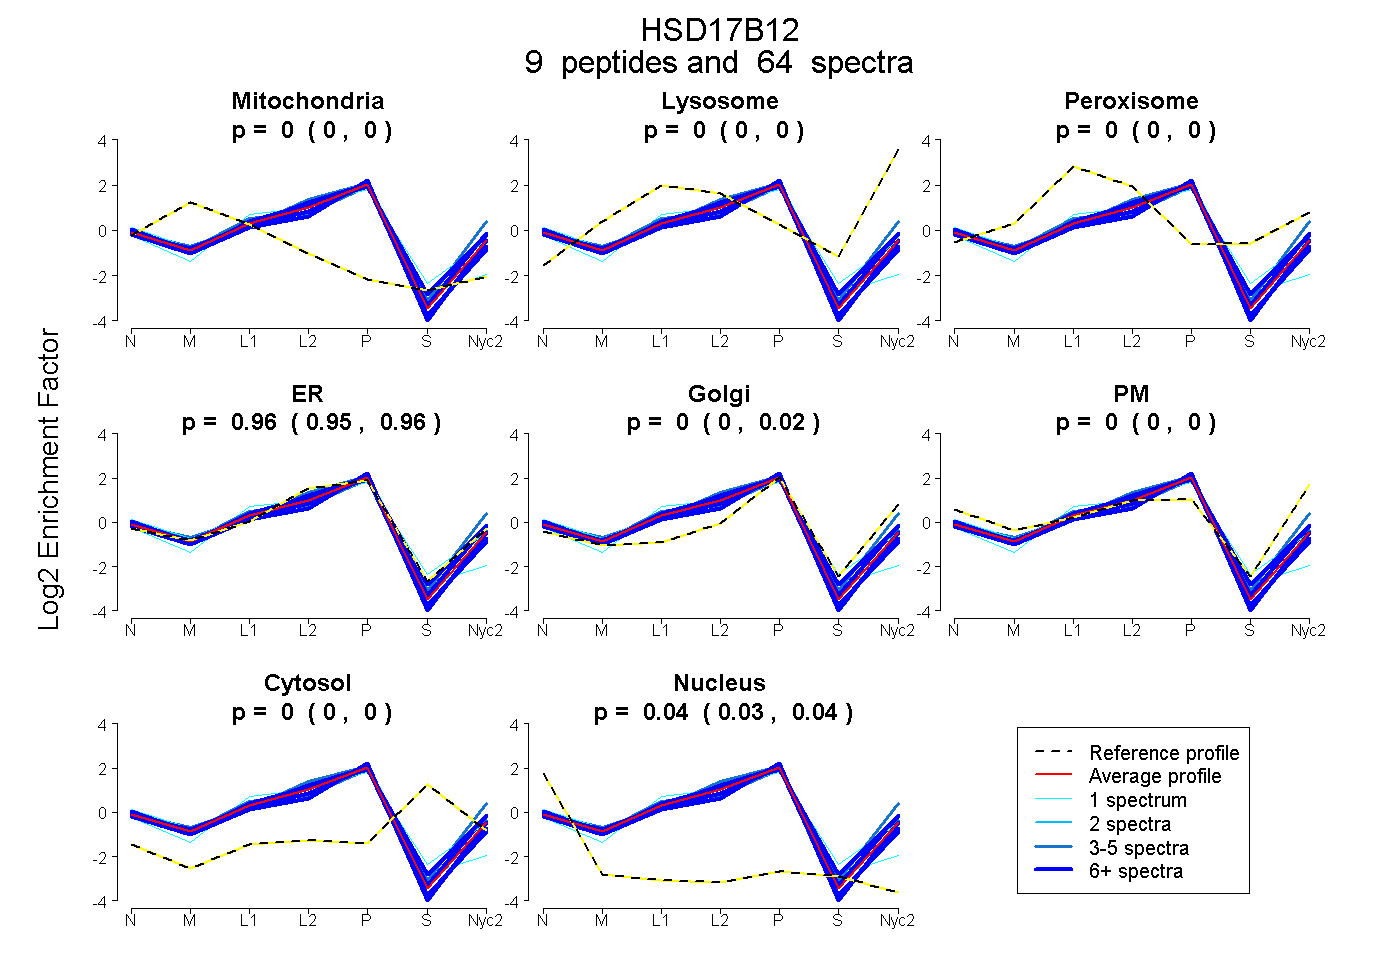
0.000 | 0.002
0.000 | 0.000
0.000 | 0.000
0.947 | 0.965
0.000 | 0.017
0.000 | 0.000
0.000 | 0.000
0.032 | 0.038
11peptides
spectra
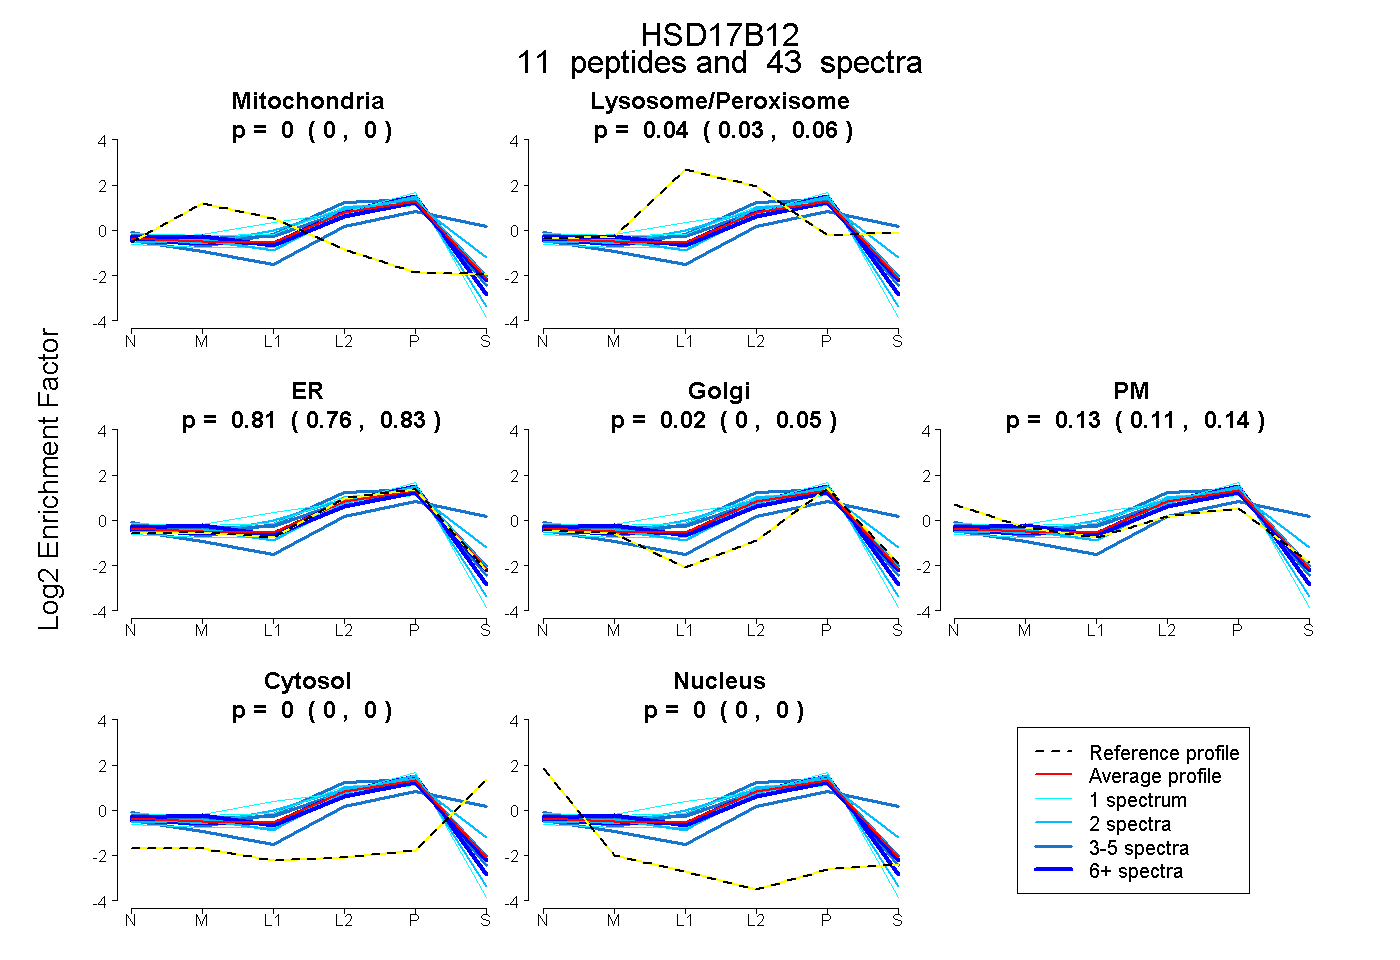
0.000 | 0.000
0.025 | 0.064
0.764 | 0.833
0.000 | 0.052
0.105 | 0.144
0.000 | 0.000
0.000 | 0.000
14peptides
spectra
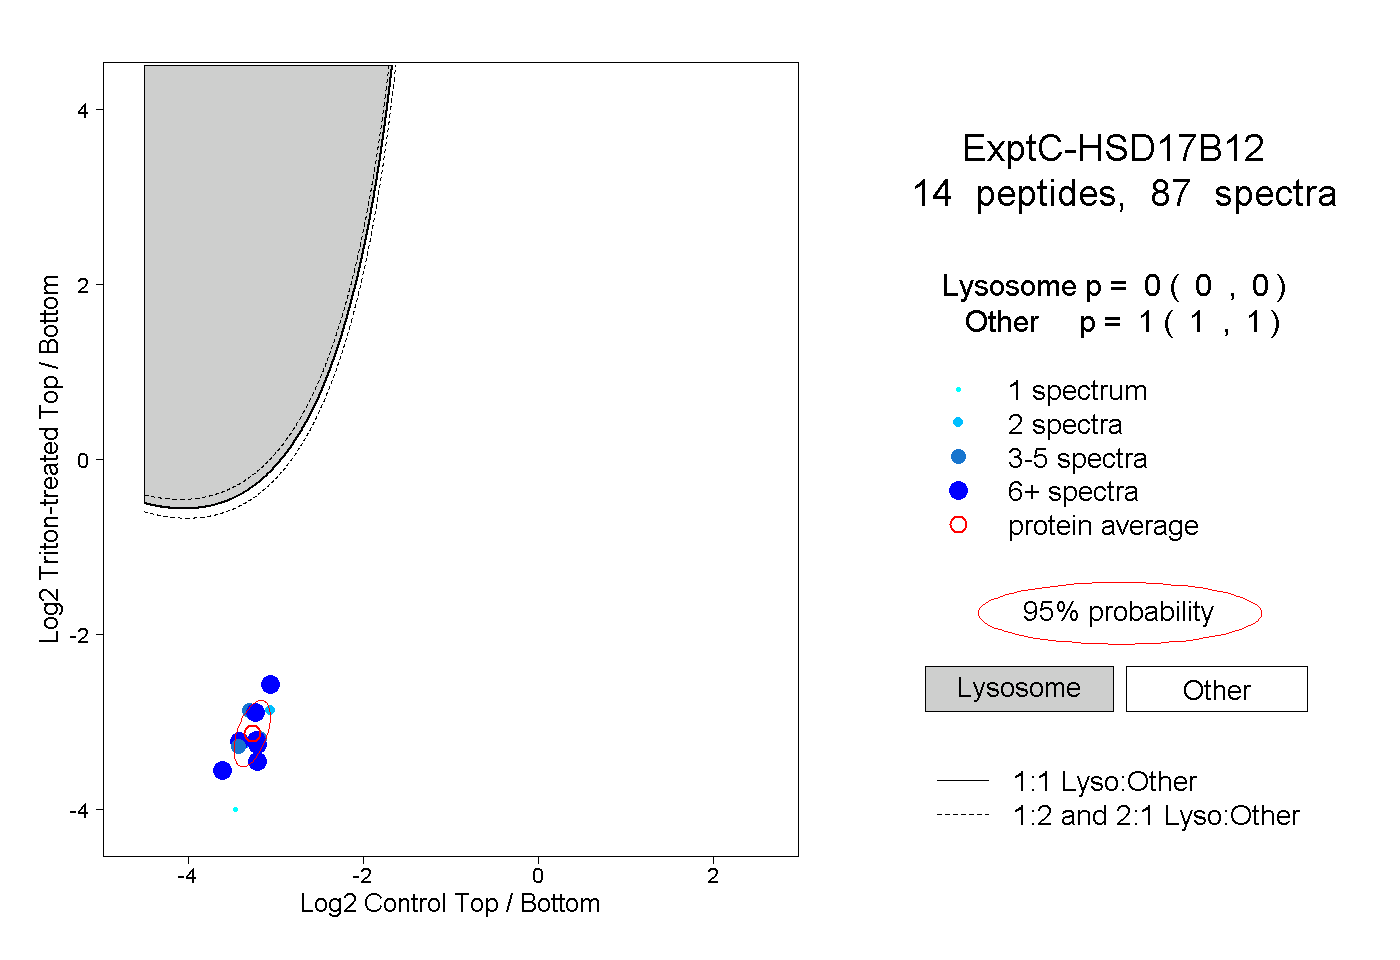
0.000 | 0.000
1.000 | 1.000
6peptides
spectra
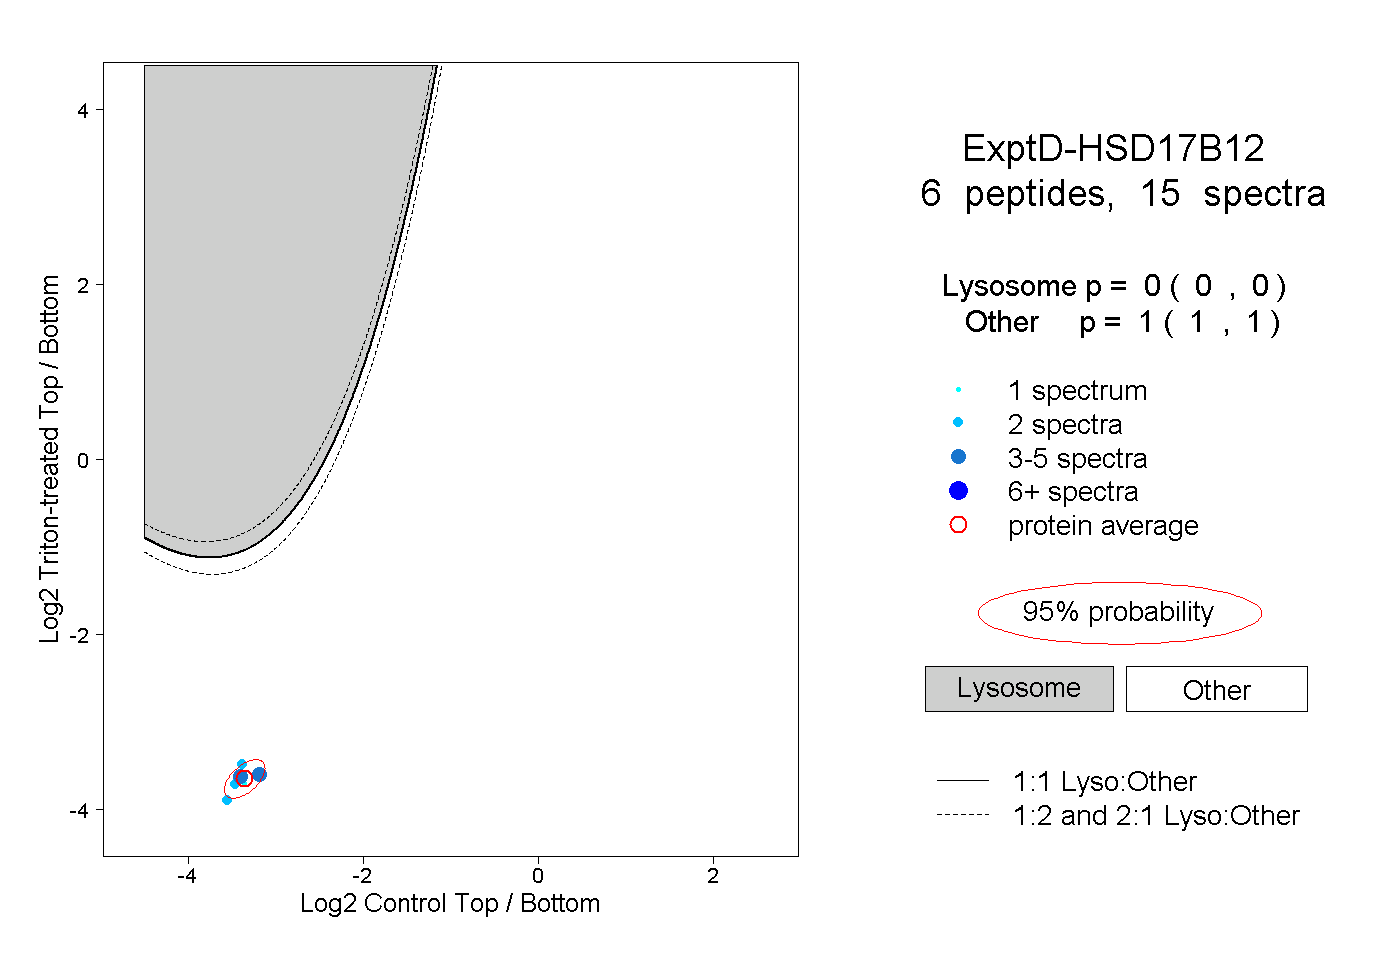
0.000 | 0.000
1.000 | 1.000