 9
9peptides
spectra
0.000 | 0.002
0.000 | 0.000
0.000 | 0.000
0.947 | 0.965
0.000 | 0.017
0.000 | 0.000
0.000 | 0.000
0.032 | 0.038
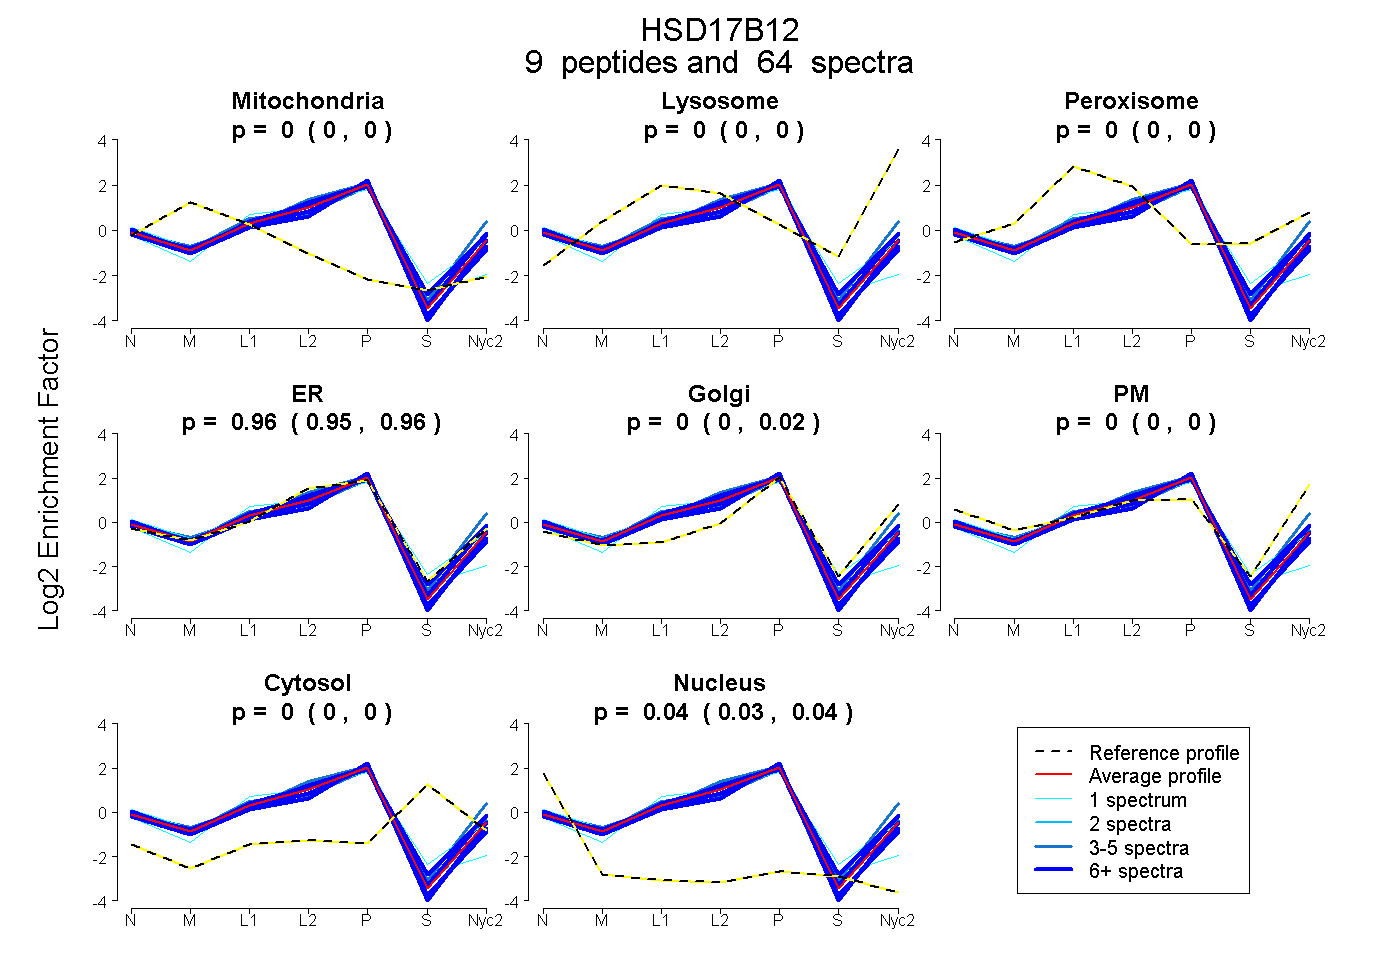
| Plot | Mito | Lyso | Perox | ER | Golgi | PM | Cytosol | Nucleus | |||||
| Expt A |
9 peptides |
64 spectra |
|
0.000 0.000 | 0.002 |
0.000 0.000 | 0.000 |
0.000 0.000 | 0.000 |
0.960 0.947 | 0.965 |
0.004 0.000 | 0.017 |
0.000 0.000 | 0.000 |
0.000 0.000 | 0.000 |
0.035 0.032 | 0.038 |
| 6 spectra, IVLISR | 0.002 | 0.000 | 0.000 | 0.911 | 0.054 | 0.033 | 0.000 | 0.000 | ||
| 11 spectra, LVLPGMVER | 0.000 | 0.000 | 0.000 | 0.874 | 0.017 | 0.093 | 0.000 | 0.016 | ||
| 5 spectra, ASYSLFR | 0.000 | 0.000 | 0.000 | 0.582 | 0.162 | 0.256 | 0.000 | 0.000 | ||
| 1 spectrum, LININVLSICK | 0.000 | 0.000 | 0.077 | 0.869 | 0.011 | 0.002 | 0.000 | 0.042 | ||
| 1 spectrum, AFVDFFSQCLHEEYK | 0.000 | 0.000 | 0.000 | 0.914 | 0.000 | 0.000 | 0.000 | 0.086 | ||
| 4 spectra, FNVETR | 0.000 | 0.000 | 0.000 | 0.991 | 0.000 | 0.000 | 0.000 | 0.009 | ||
| 13 spectra, SYAEELAK | 0.012 | 0.000 | 0.000 | 0.948 | 0.000 | 0.000 | 0.000 | 0.040 | ||
| 17 spectra, TVGLQTR | 0.000 | 0.000 | 0.000 | 0.932 | 0.000 | 0.000 | 0.000 | 0.068 | ||
| 6 spectra, TIMGFNK | 0.000 | 0.000 | 0.000 | 0.812 | 0.142 | 0.000 | 0.000 | 0.046 |
| Plot | Mito | Lyso or Perox | ER | Golgi | PM | Cytosol | Nucleus | ||||||
| Expt B |
11 peptides |
43 spectra |
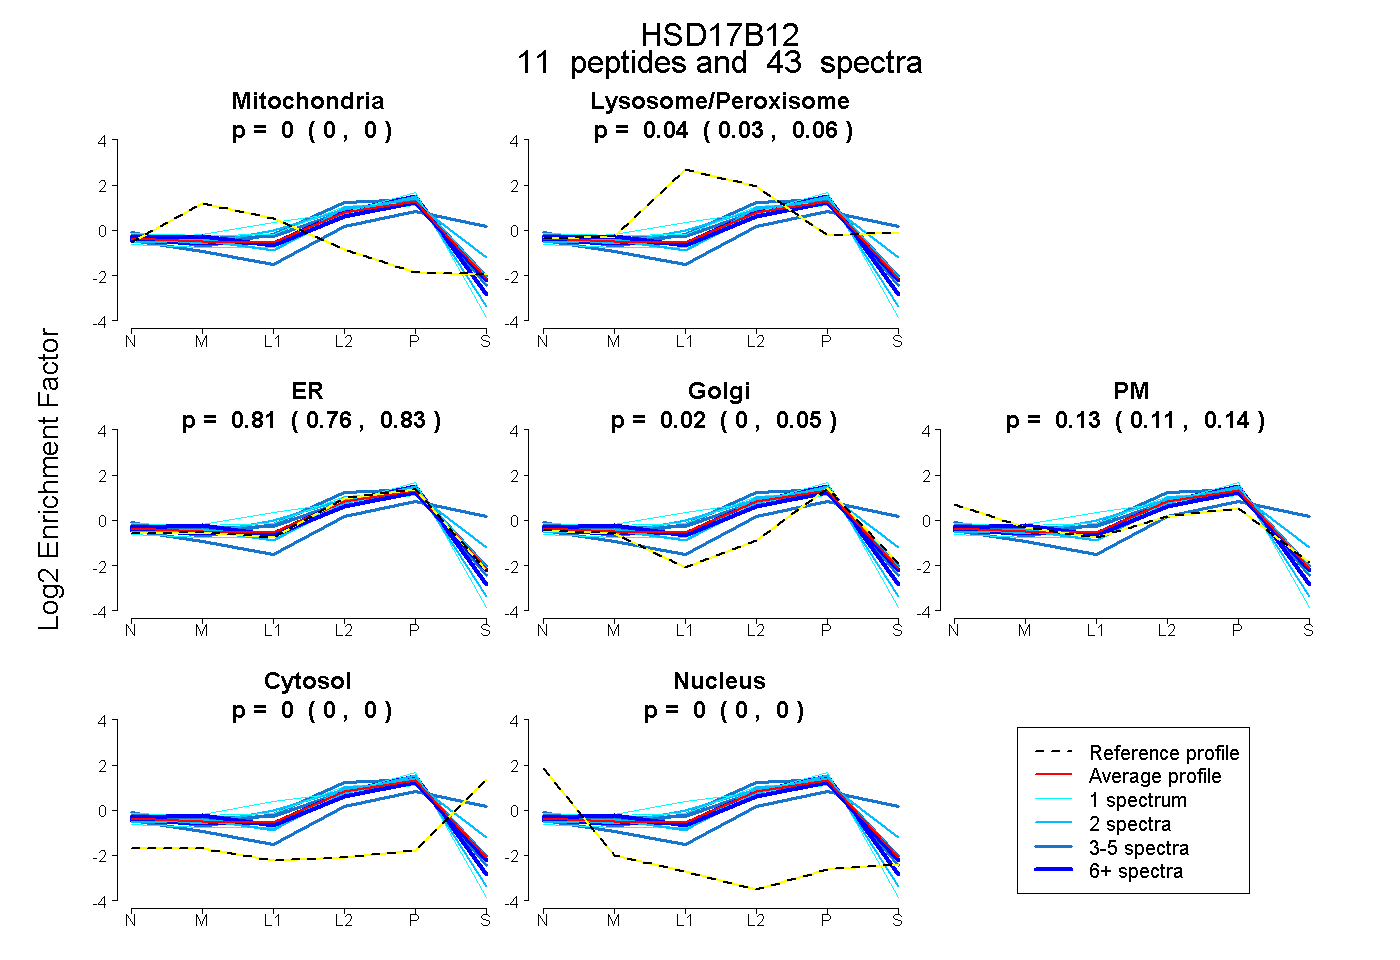 |
0.000 0.000 | 0.000 |
0.044 0.025 | 0.064 |
0.805 0.764 | 0.833 |
0.020 0.000 | 0.052 |
0.130 0.105 | 0.144 |
0.000 0.000 | 0.000 |
0.000 0.000 | 0.000 |
|||
| Plot | Lyso | Other | |||||||||||
| Expt C |
14 peptides |
87 spectra |
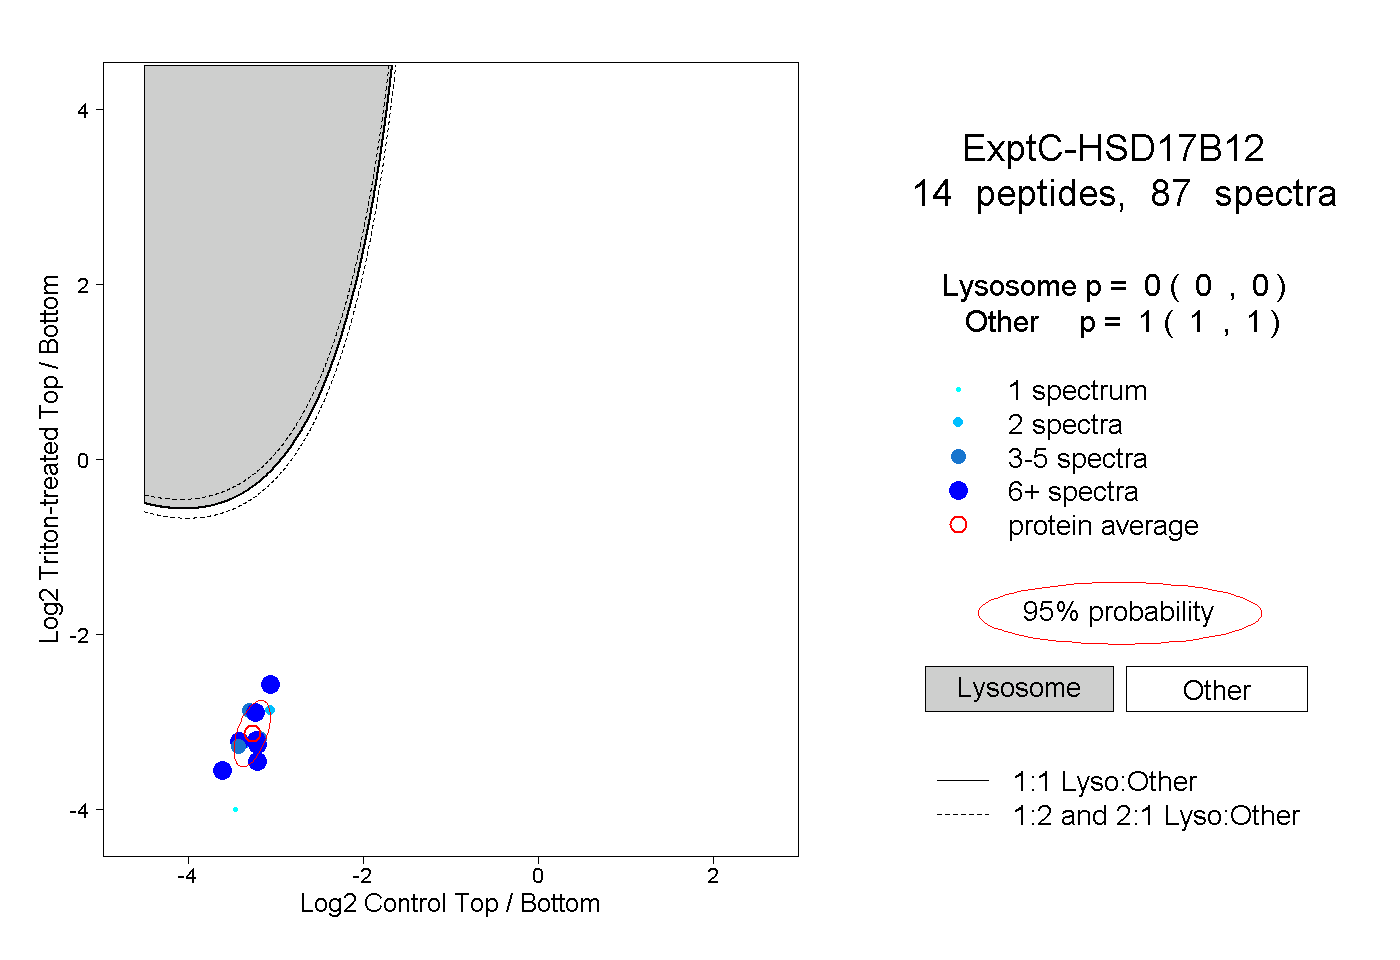 |
0.000 0.000 | 0.000 |
1.000 1.000 | 1.000 |
||||||||
| Plot | Lyso | Other | |||||||||||
| Expt D |
6 peptides |
15 spectra |
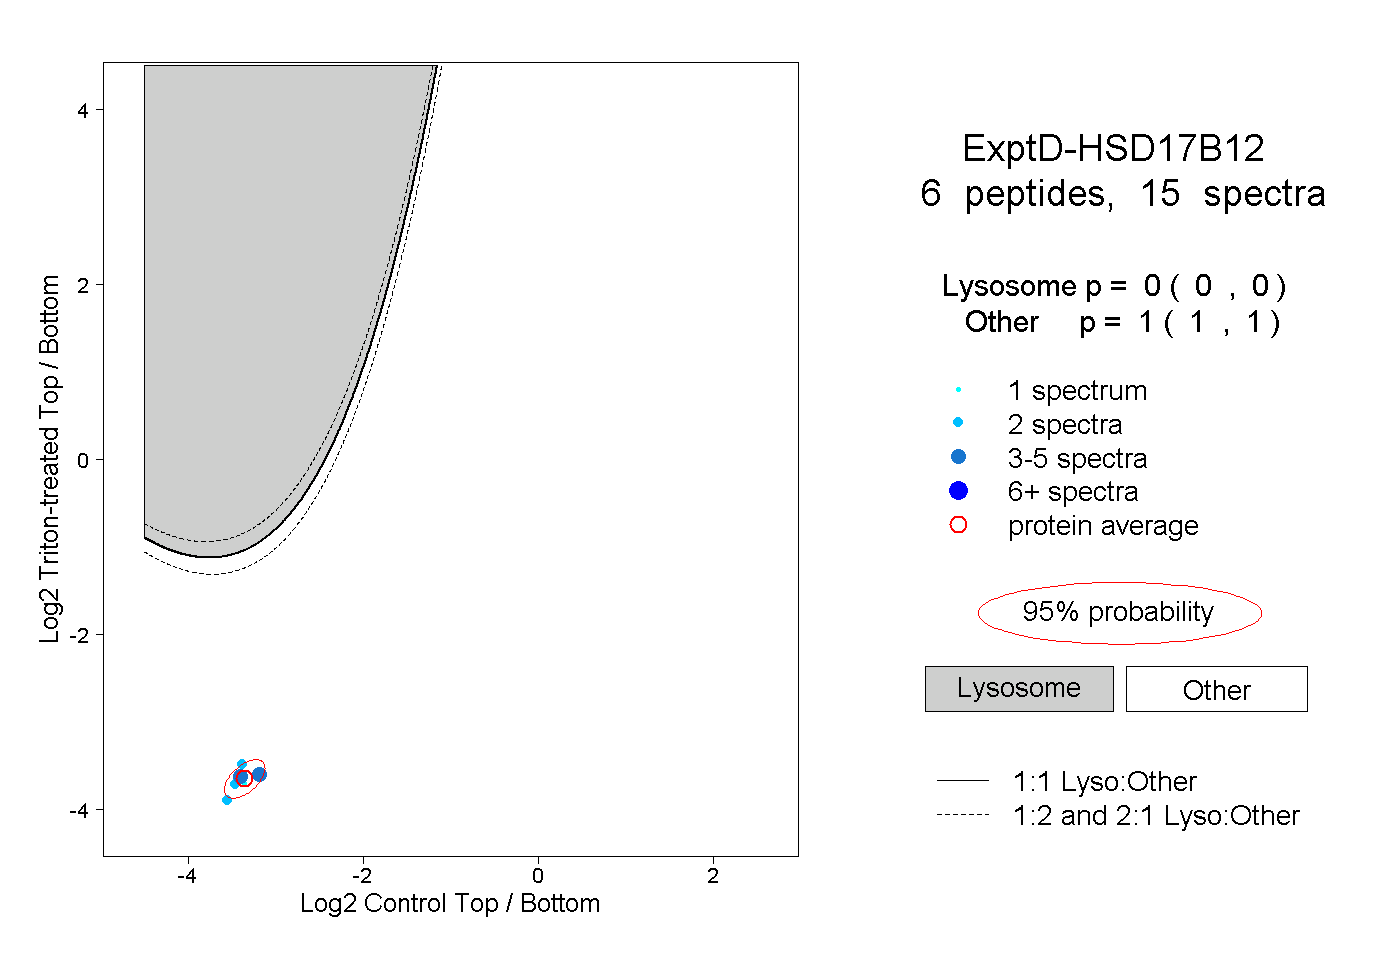 |
0.000 0.000 | 0.000 |
1.000 1.000 | 1.000 |