 8
8peptides
spectra
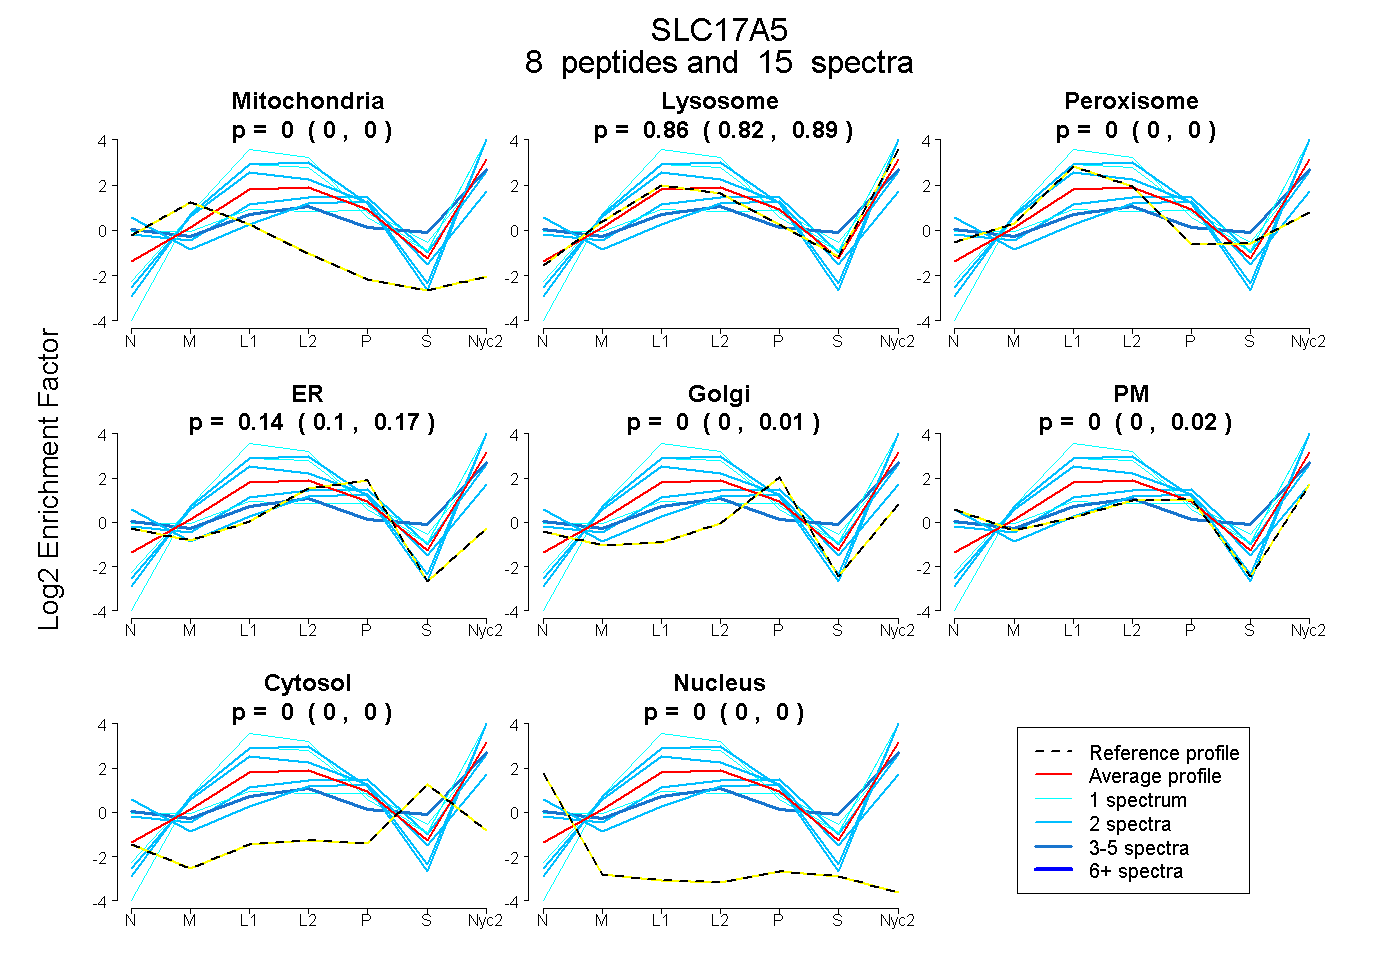
0.000 | 0.000
0.816 | 0.888
0.000 | 0.000
0.096 | 0.167
0.000 | 0.009
0.000 | 0.019
0.000 | 0.000
0.000 | 0.000
3peptides
spectra
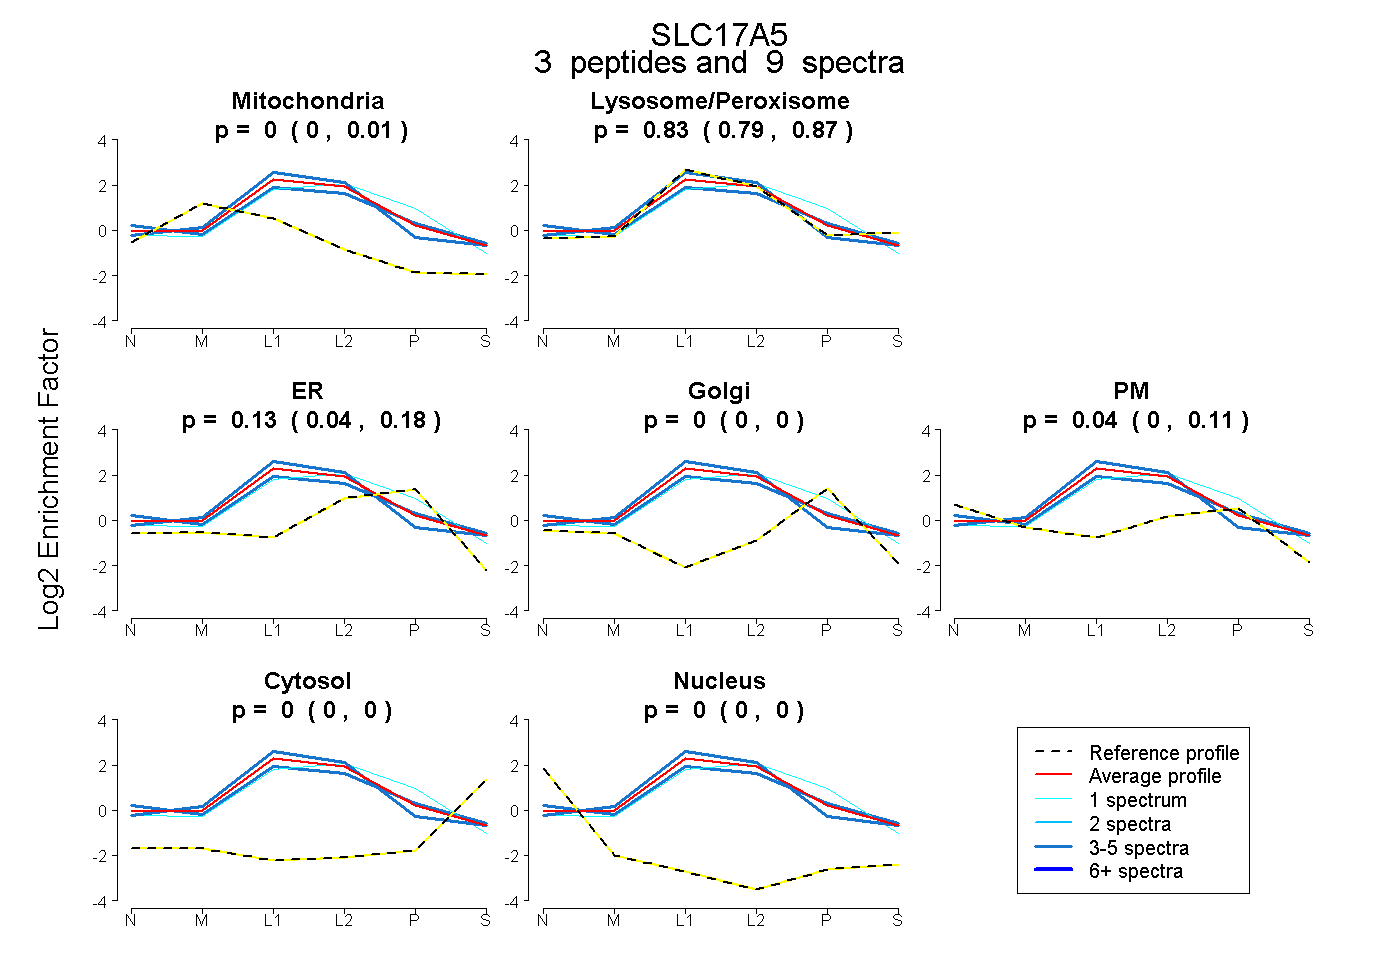
0.000 | 0.010
0.791 | 0.866
0.039 | 0.181
0.000 | 0.000
0.000 | 0.109
0.000 | 0.000
0.000 | 0.000
9peptides
spectra
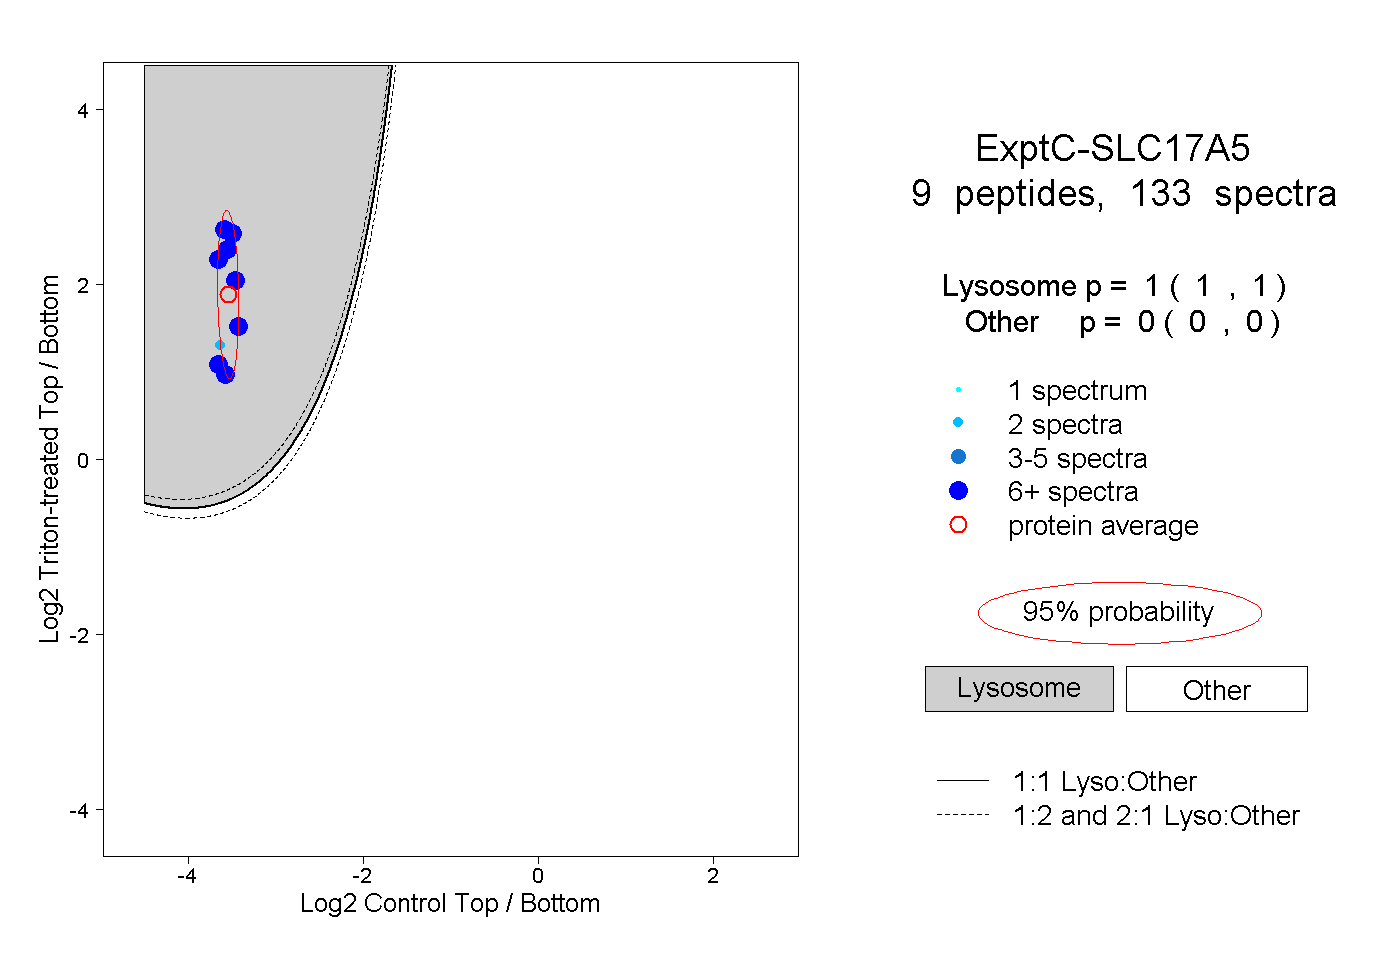
1.000 | 1.000
0.000 | 0.000
6peptides
spectra
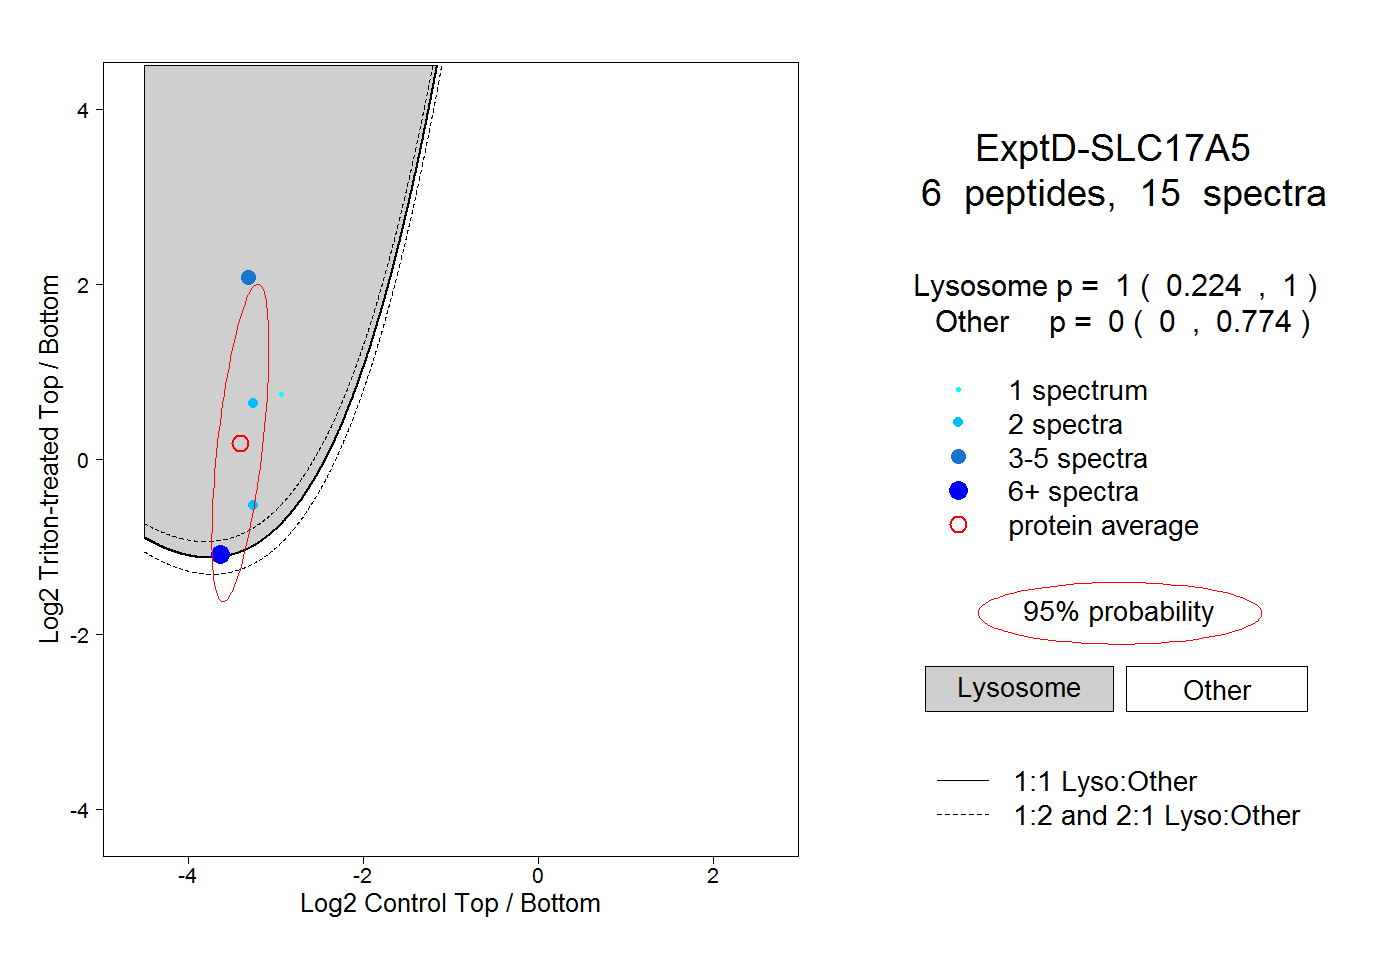
0.224 | 1.000
0.000 | 0.774