SLC17A5
[ENSRNOP00000012474]
Main page
| | | Plot |
Mito |
Lyso |
|
Perox |
ER |
Golgi |
PM |
Cytosol |
Nucleus |
|
| Expt A |
 8
8
peptides |
15
spectra |
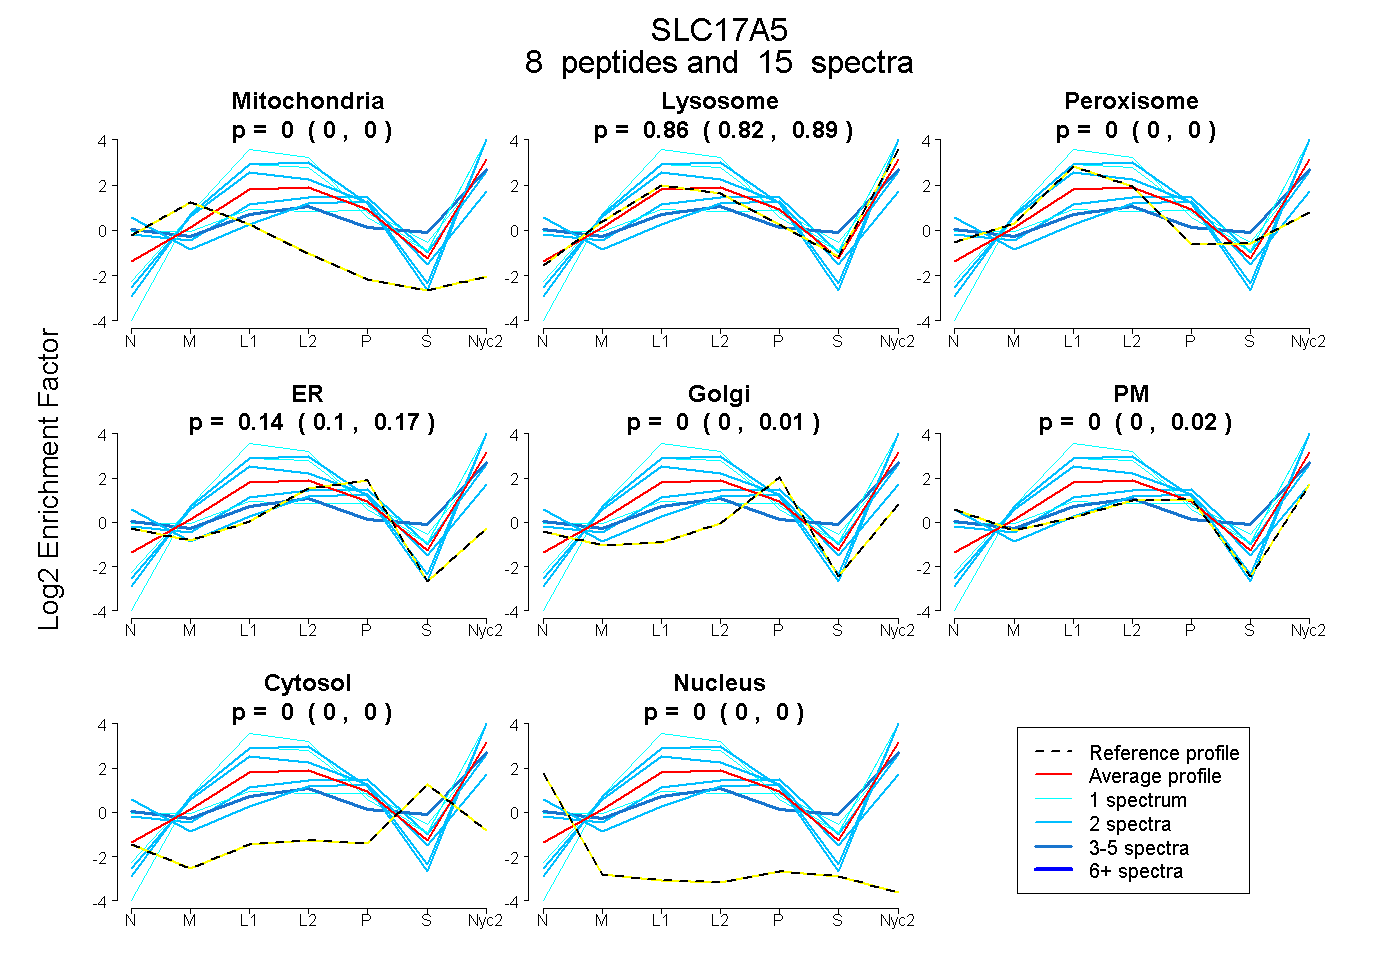 |
0.000
0.000 | 0.000 |
0.860
0.816 | 0.888 |
|
0.000
0.000 | 0.000 |
0.140
0.096 | 0.167 |
0.000
0.000 | 0.009 |
0.000
0.000 | 0.019 |
0.000
0.000 | 0.000 |
0.000
0.000 | 0.000 |
|
| | | Plot |
Mito |
|
Lyso or Perox |
|
ER |
Golgi |
PM |
Cytosol |
Nucleus |
|
| Expt B |
3
peptides |
9
spectra |
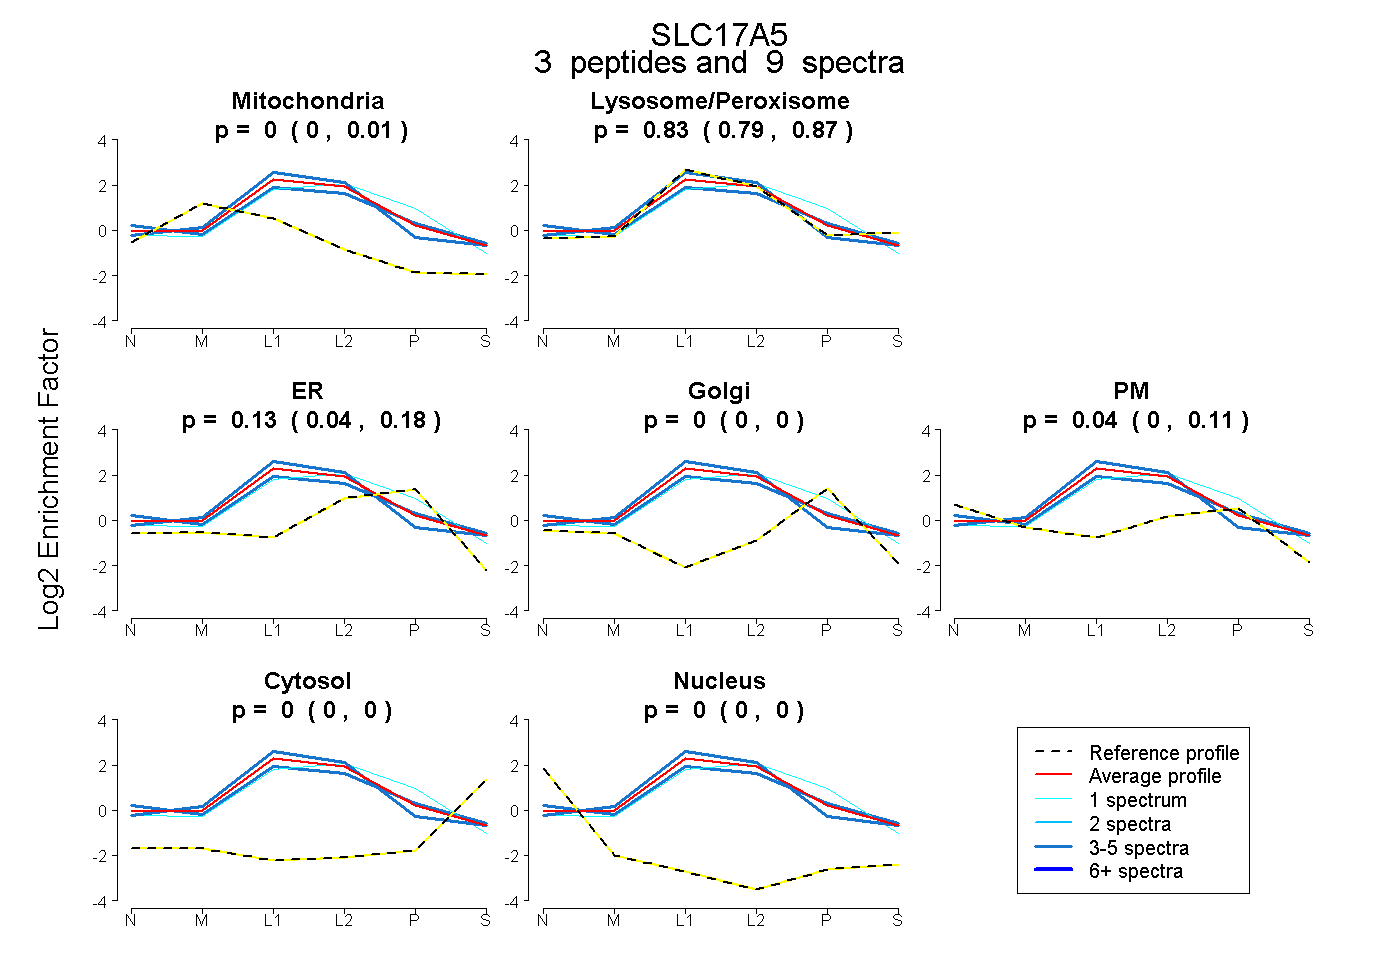 |
0.000
0.000 | 0.010 |
|
0.835
0.791 | 0.866 |
|
0.129
0.039 | 0.181 |
0.000
0.000 | 0.000 |
0.036
0.000 | 0.109 |
0.000
0.000 | 0.000 |
0.000
0.000 | 0.000 |
|
| 5 spectra, VVPWVSILK |
0.062 |
|
0.914 |
|
0.024 |
0.000 |
0.000 |
0.000 |
0.000 |
|
| 1 spectrum, TISHYEK |
0.000 |
|
0.663 |
|
0.337 |
0.000 |
0.000 |
0.000 |
0.000 |
|
| 3 spectra, ECAEHSAPVK |
0.000 |
|
0.744 |
|
0.001 |
0.000 |
0.255 |
0.000 |
0.000 |
|
| | | Plot |
|
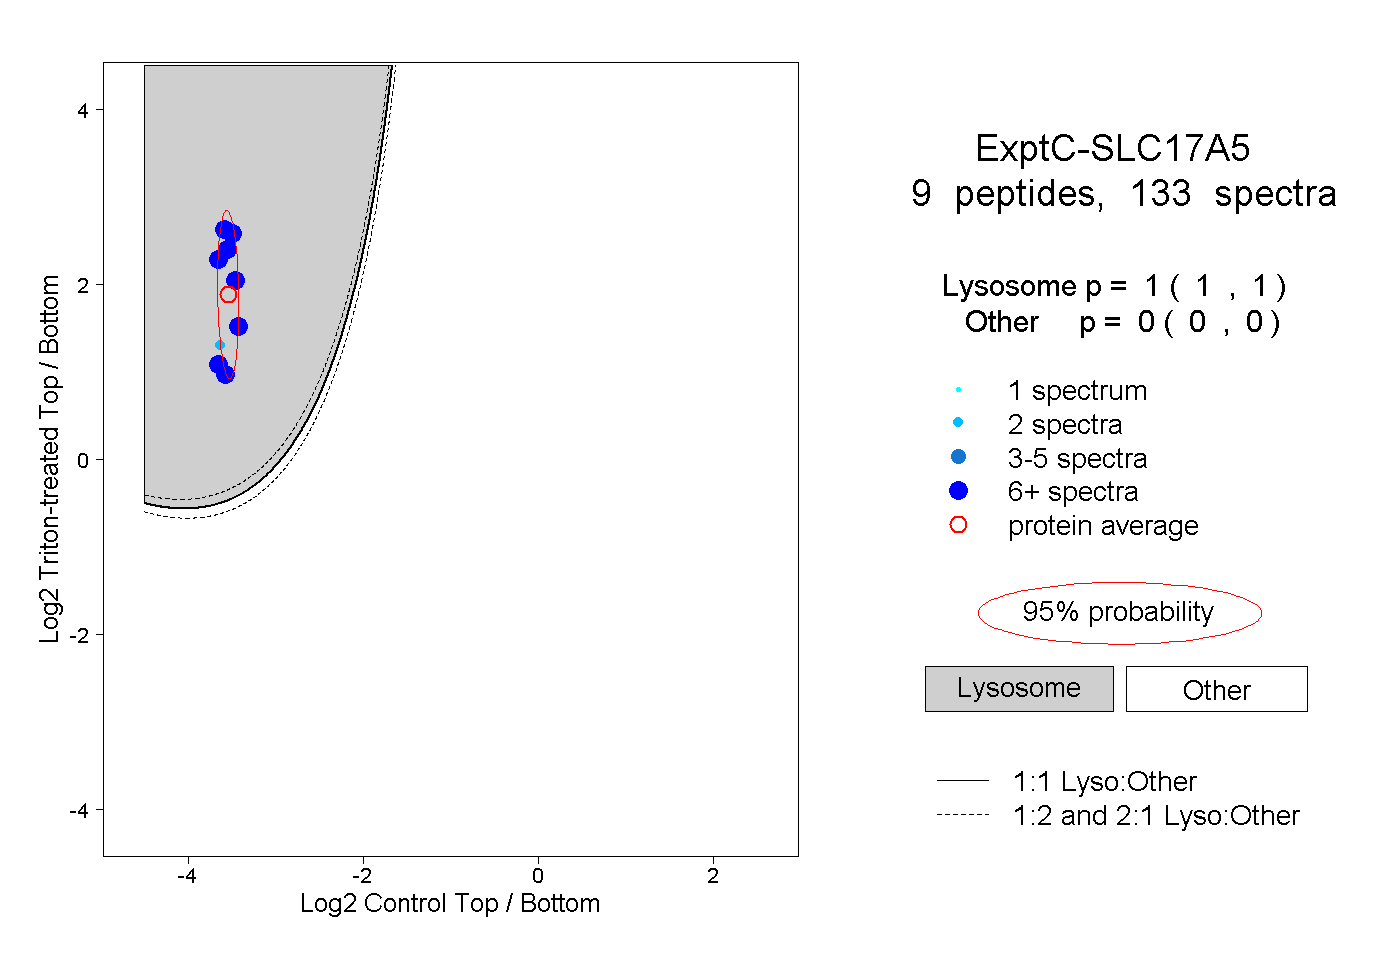
Lyso |
|
|
|
|
|
|
|
Other |
| Expt C |
9
peptides |
133
spectra |
 |
|
1.000
1.000 | 1.000 |
|
|
|
|
|
|
|
0.000
0.000 | 0.000 |
| | | Plot |
|
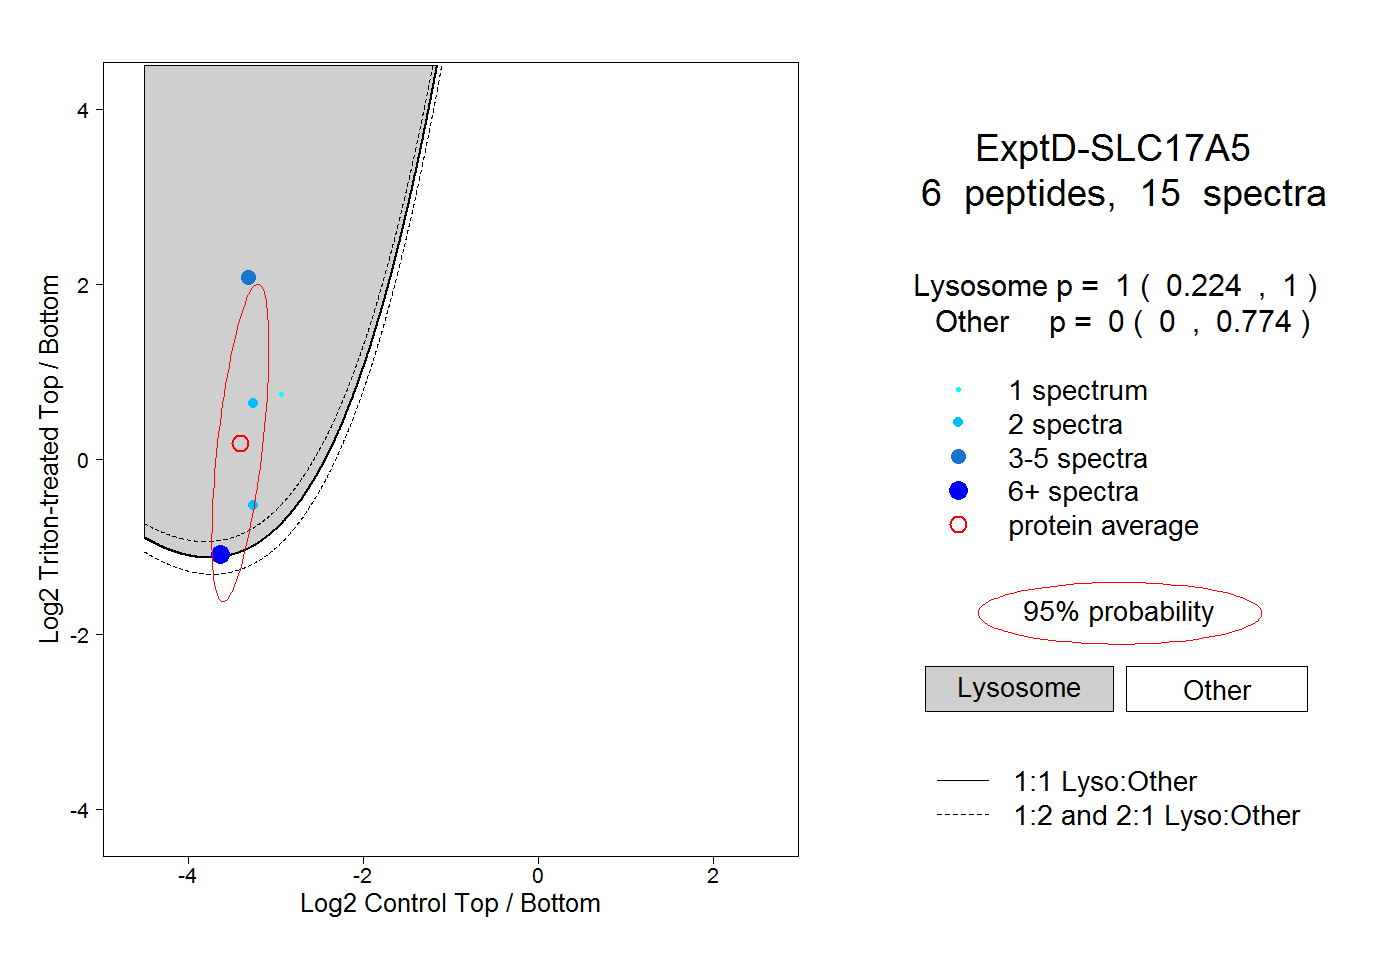
Lyso |
|
|
|
|
|
|
|
Other |
| Expt D |
6
peptides |
15
spectra |
 |
|
1.000
0.224 | 1.000 |
|
|
|
|
|
|
|
0.000
0.000 | 0.774 |