 8
8peptides
spectra
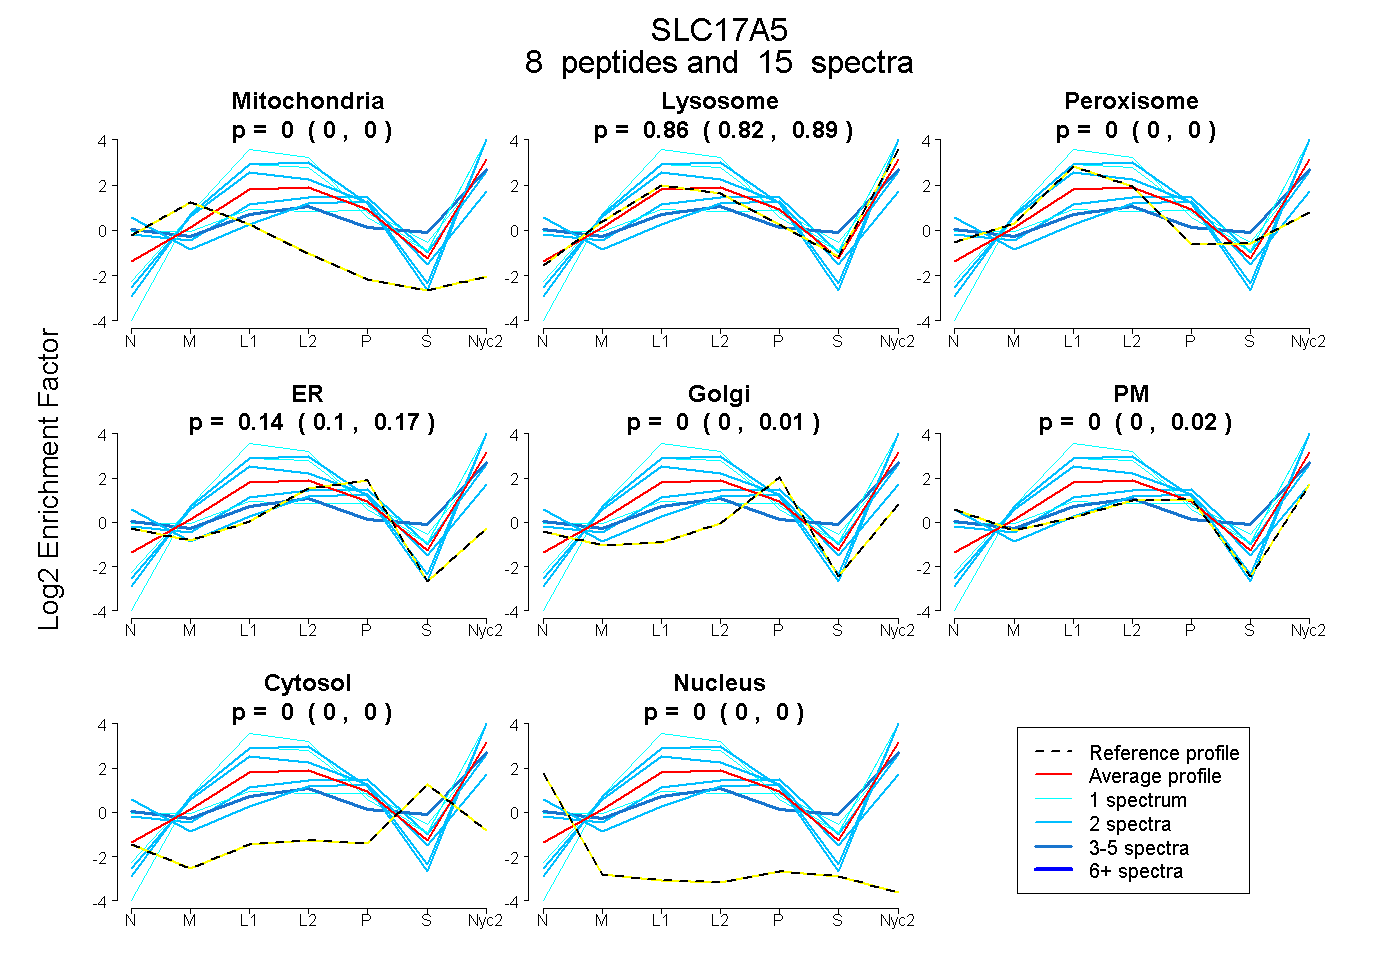
0.000 | 0.000
0.816 | 0.888
0.000 | 0.000
0.096 | 0.167
0.000 | 0.009
0.000 | 0.019
0.000 | 0.000
0.000 | 0.000
| Plot | Mito | Lyso | Perox | ER | Golgi | PM | Cytosol | Nucleus | |||||
| Expt A |
8 peptides |
15 spectra |
|
0.000 0.000 | 0.000 |
0.860 0.816 | 0.888 |
0.000 0.000 | 0.000 |
0.140 0.096 | 0.167 |
0.000 0.000 | 0.009 |
0.000 0.000 | 0.019 |
0.000 0.000 | 0.000 |
0.000 0.000 | 0.000 |
| 2 spectra, RPLLR | 0.000 | 0.061 | 0.009 | 0.027 | 0.000 | 0.826 | 0.078 | 0.000 | ||
| 1 spectrum, MRPLLR | 0.000 | 0.510 | 0.000 | 0.000 | 0.000 | 0.385 | 0.105 | 0.000 | ||
| 1 spectrum, SLTPDNTIK | 0.000 | 1.000 | 0.000 | 0.000 | 0.000 | 0.000 | 0.000 | 0.000 | ||
| 4 spectra, NQLSSQK | 0.000 | 0.529 | 0.015 | 0.000 | 0.000 | 0.264 | 0.192 | 0.000 | ||
| 2 spectra, WNFSTISVR | 0.000 | 1.000 | 0.000 | 0.000 | 0.000 | 0.000 | 0.000 | 0.000 | ||
| 1 spectrum, QIEAAPACCSAR | 0.000 | 1.000 | 0.000 | 0.000 | 0.000 | 0.000 | 0.000 | 0.000 | ||
| 2 spectra, EYIVSSLK | 0.000 | 0.496 | 0.011 | 0.039 | 0.095 | 0.355 | 0.004 | 0.000 | ||
| 2 spectra, VVPWVSILK | 0.000 | 1.000 | 0.000 | 0.000 | 0.000 | 0.000 | 0.000 | 0.000 |
| Plot | Mito | Lyso or Perox | ER | Golgi | PM | Cytosol | Nucleus | ||||||
| Expt B |
3 peptides |
9 spectra |
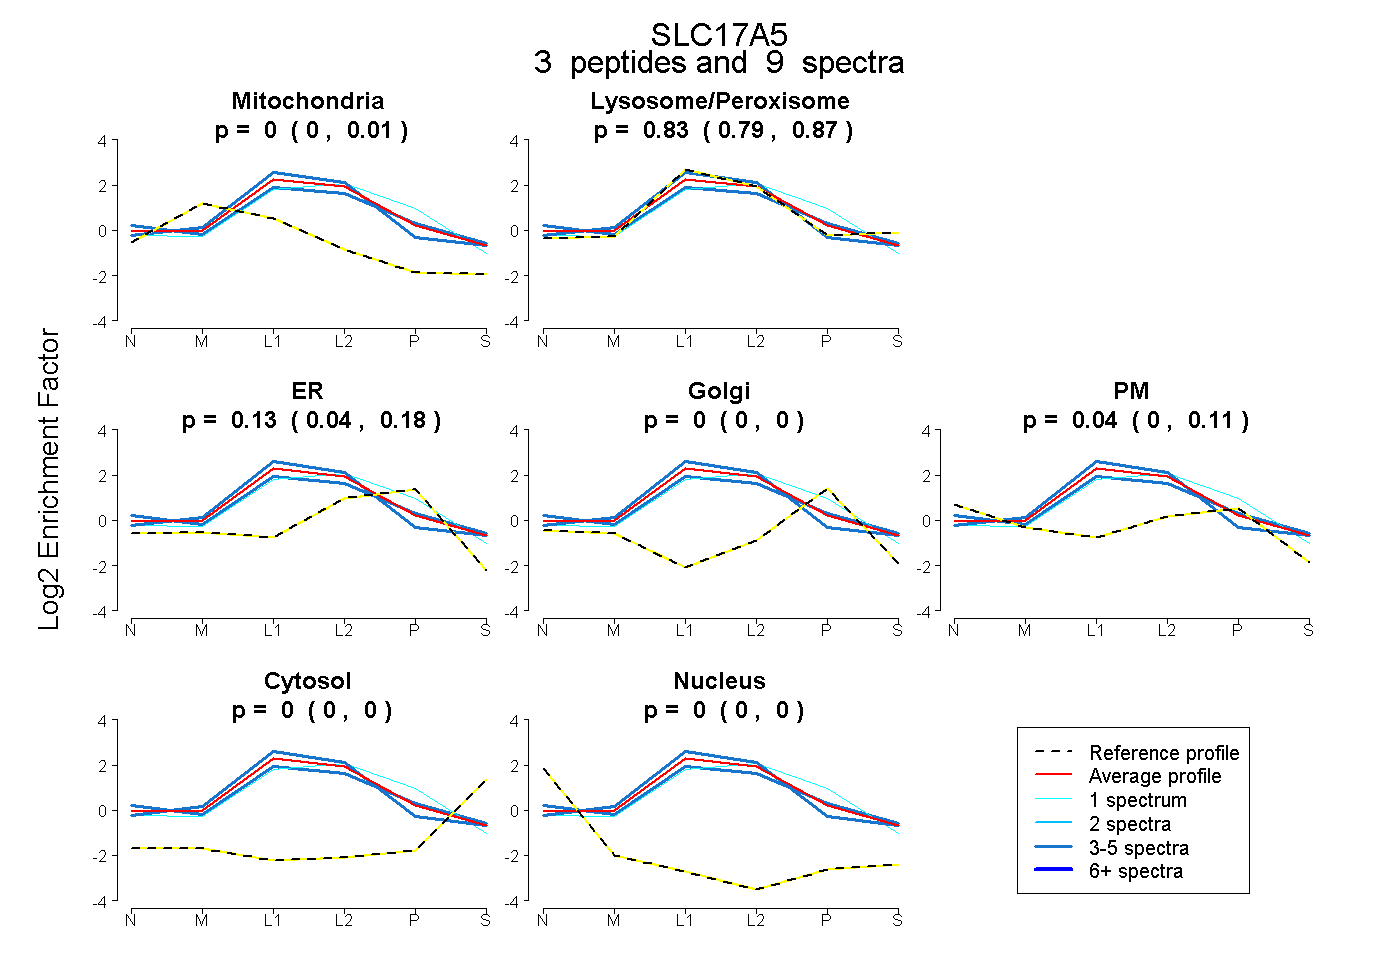 |
0.000 0.000 | 0.010 |
0.835 0.791 | 0.866 |
0.129 0.039 | 0.181 |
0.000 0.000 | 0.000 |
0.036 0.000 | 0.109 |
0.000 0.000 | 0.000 |
0.000 0.000 | 0.000 |
|||
| Plot | Lyso | Other | |||||||||||
| Expt C |
9 peptides |
133 spectra |
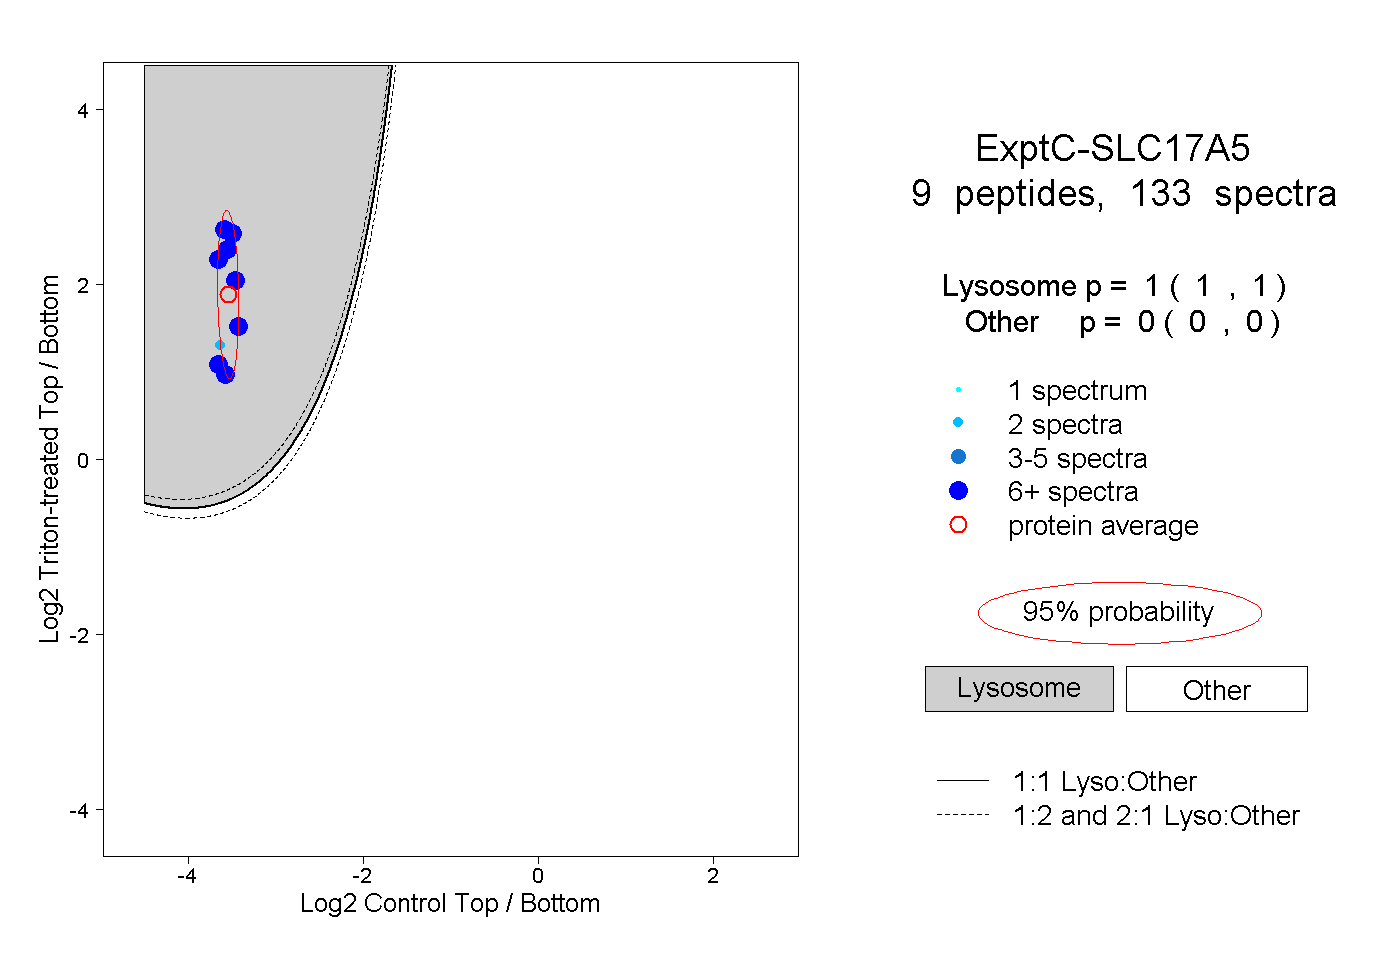 |
1.000 1.000 | 1.000 |
0.000 0.000 | 0.000 |
||||||||
| Plot | Lyso | Other | |||||||||||
| Expt D |
6 peptides |
15 spectra |
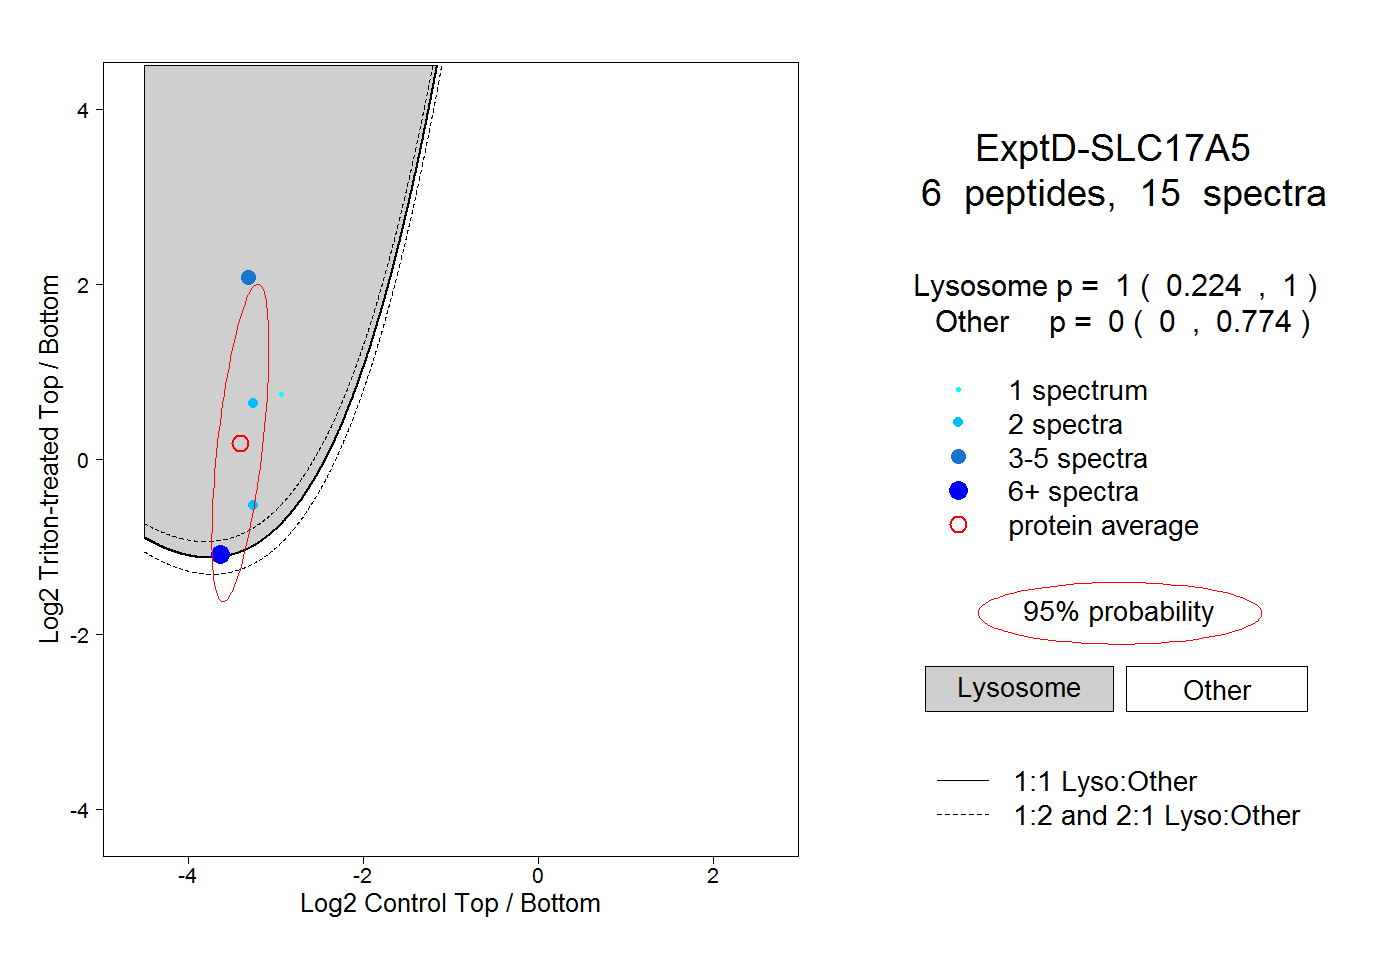 |
1.000 0.224 | 1.000 |
0.000 0.000 | 0.774 |