 13
13peptides
spectra
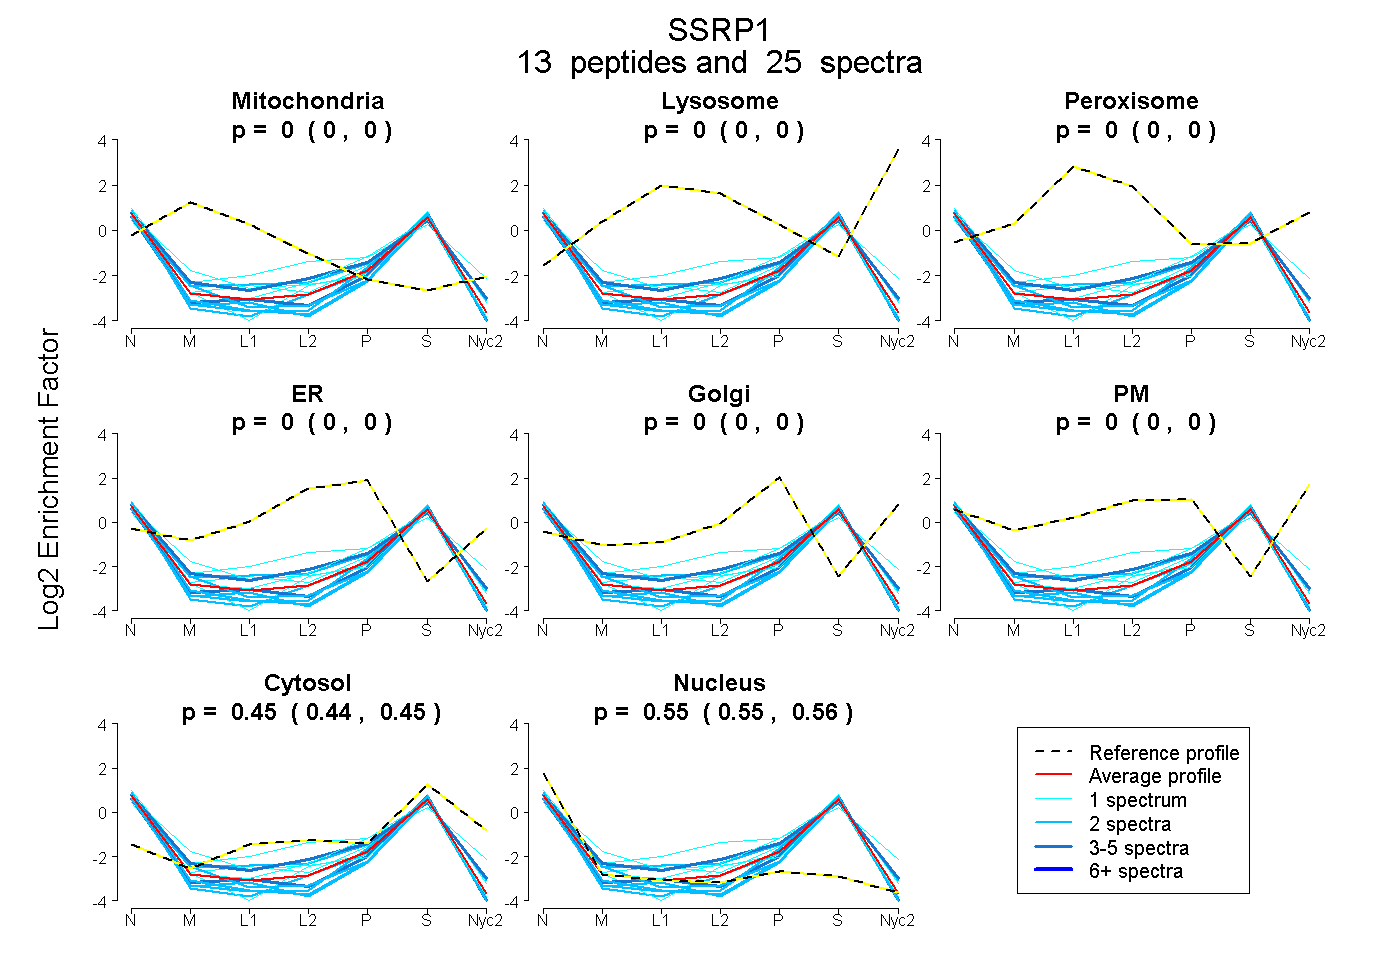
0.000 | 0.000
0.000 | 0.000
0.000 | 0.000
0.000 | 0.000
0.000 | 0.000
0.000 | 0.000
0.442 | 0.453
0.545 | 0.557
3peptides
spectra
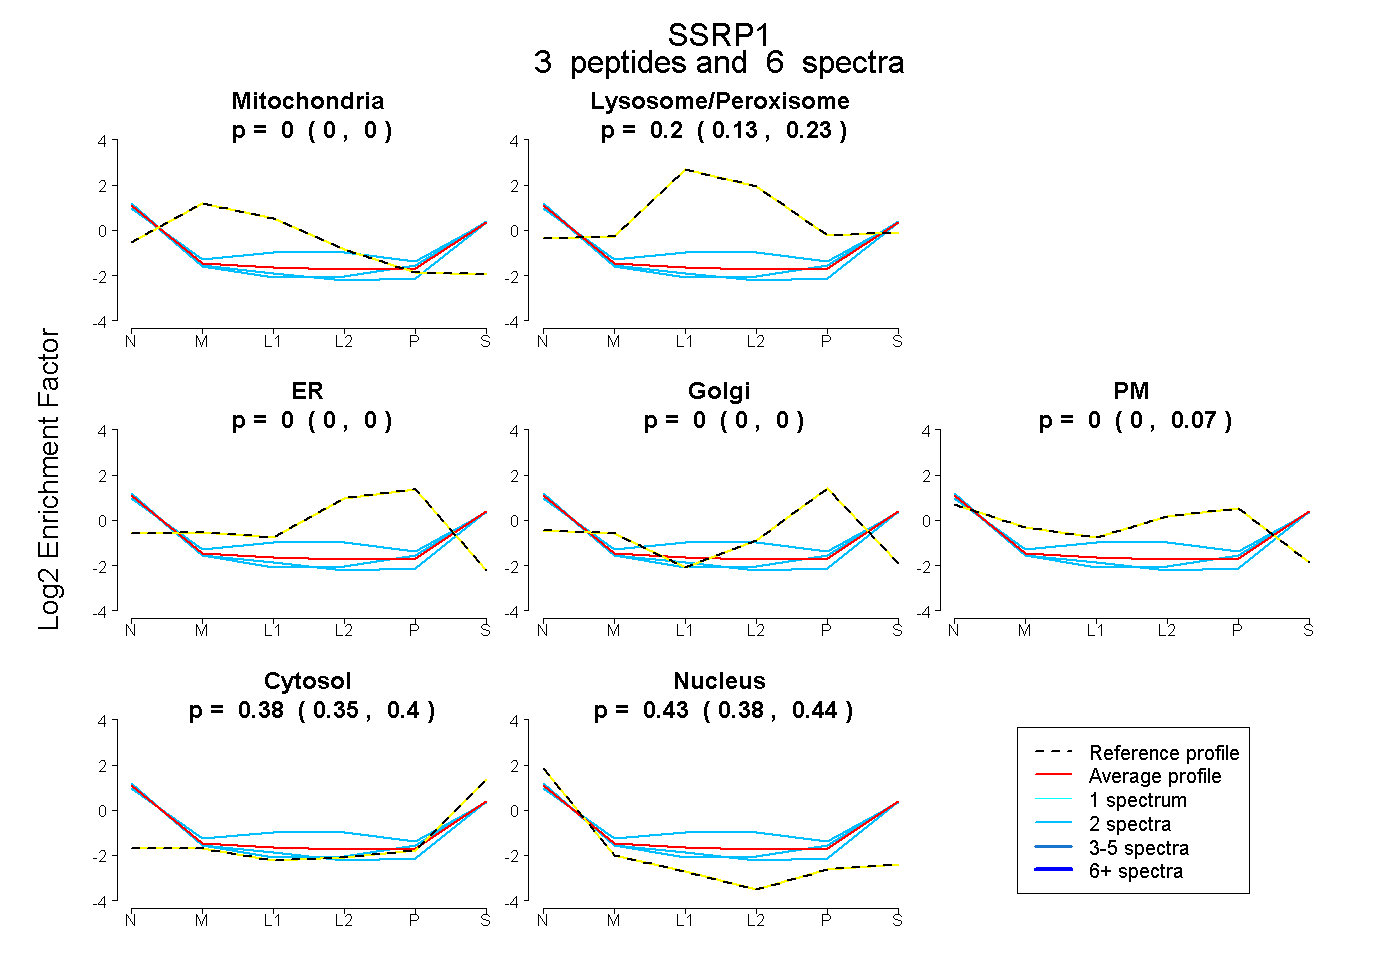
0.000 | 0.000
0.125 | 0.228
0.000 | 0.000
0.000 | 0.000
0.000 | 0.073
0.352 | 0.405
0.376 | 0.440
5peptides
spectra
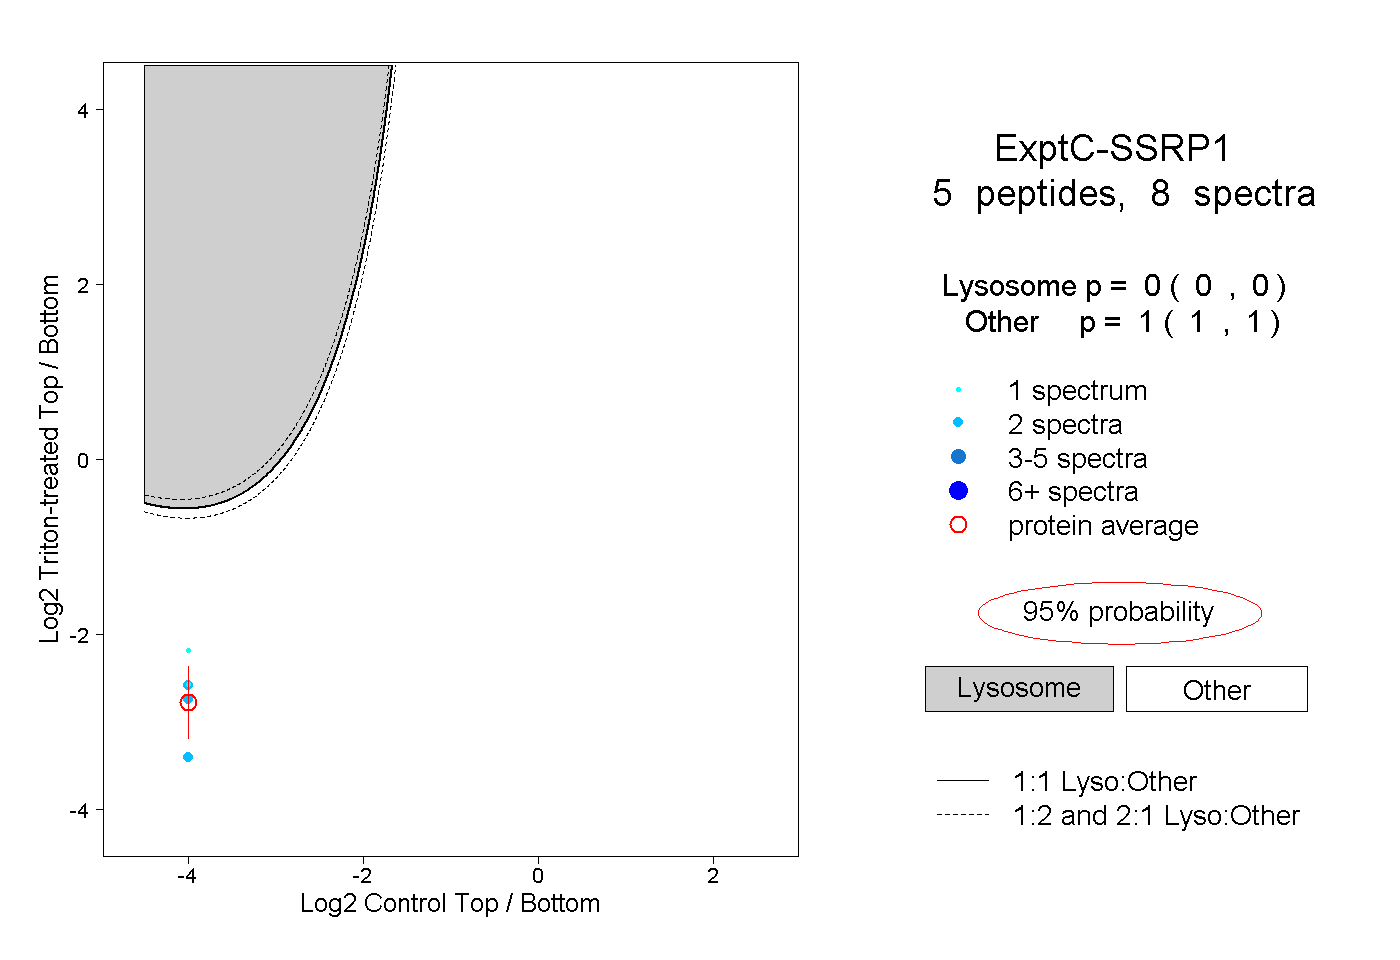
0.000 | 0.000
1.000 | 1.000