 13
13peptides
spectra
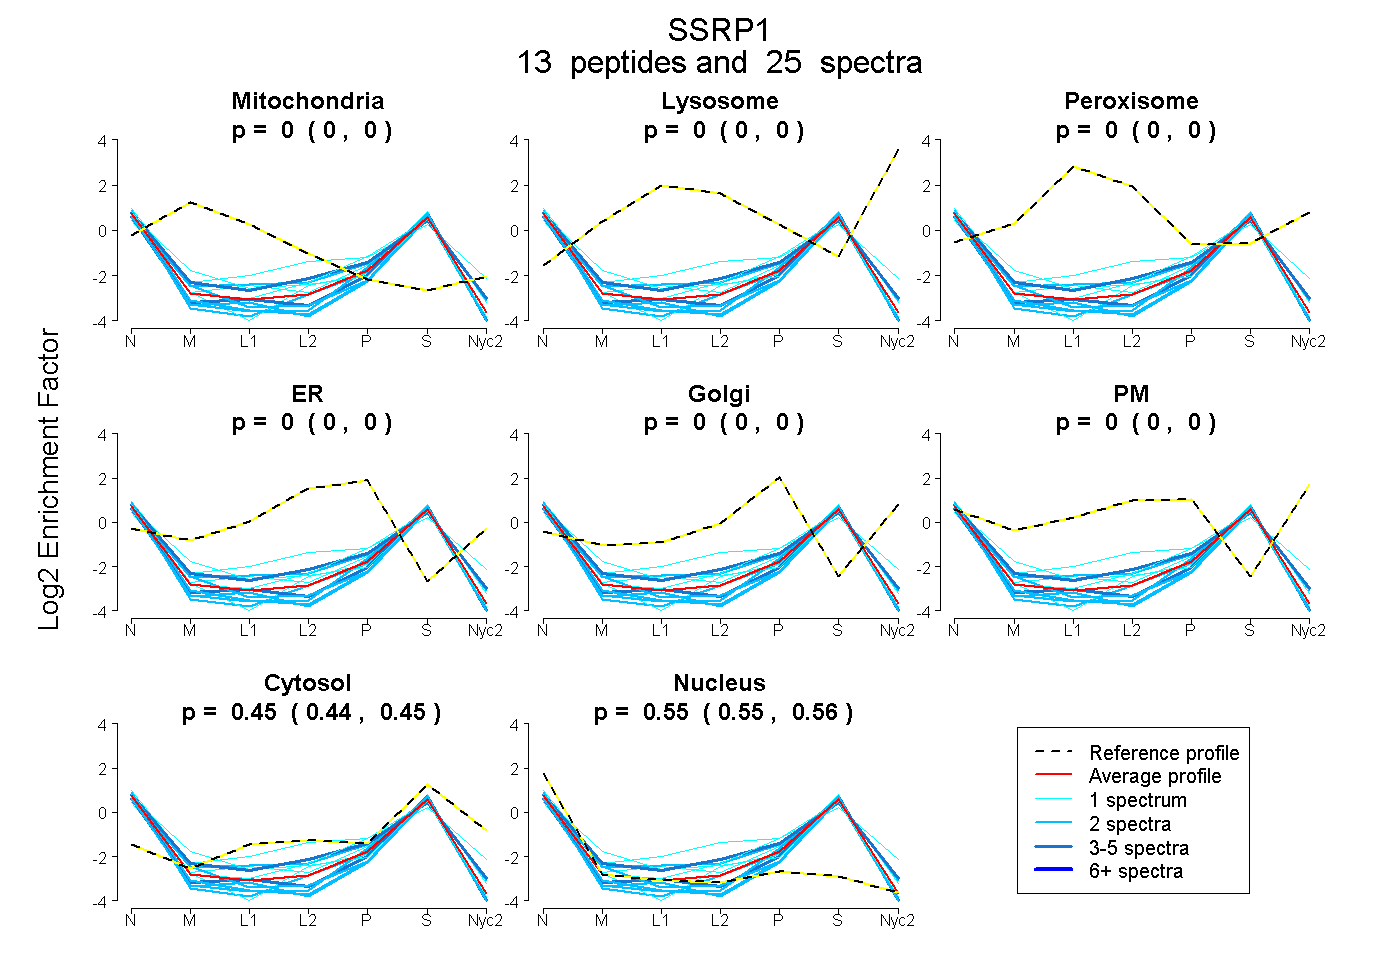
0.000 | 0.000
0.000 | 0.000
0.000 | 0.000
0.000 | 0.000
0.000 | 0.000
0.000 | 0.000
0.442 | 0.453
0.545 | 0.557
| Plot | Mito | Lyso | Perox | ER | Golgi | PM | Cytosol | Nucleus | |||||
| Expt A |
13 peptides |
25 spectra |
|
0.000 0.000 | 0.000 |
0.000 0.000 | 0.000 |
0.000 0.000 | 0.000 |
0.000 0.000 | 0.000 |
0.000 0.000 | 0.000 |
0.000 0.000 | 0.000 |
0.449 0.442 | 0.453 |
0.551 0.545 | 0.557 |
| 2 spectra, IYPTFLHLHGK | 0.000 | 0.000 | 0.000 | 0.000 | 0.000 | 0.000 | 0.408 | 0.592 | ||
| 4 spectra, IPYTTVLR | 0.000 | 0.000 | 0.000 | 0.000 | 0.000 | 0.000 | 0.419 | 0.581 | ||
| 1 spectrum, LFDFVNAK | 0.000 | 0.000 | 0.000 | 0.000 | 0.000 | 0.000 | 0.468 | 0.532 | ||
| 1 spectrum, ESEFEK | 0.000 | 0.000 | 0.021 | 0.077 | 0.000 | 0.000 | 0.531 | 0.371 | ||
| 2 spectra, GWNWGTVK | 0.000 | 0.000 | 0.000 | 0.000 | 0.000 | 0.000 | 0.489 | 0.511 | ||
| 1 spectrum, ADVIQATGDAICIFR | 0.000 | 0.000 | 0.000 | 0.000 | 0.000 | 0.000 | 0.513 | 0.487 | ||
| 2 spectra, LELMEK | 0.000 | 0.000 | 0.000 | 0.000 | 0.000 | 0.000 | 0.394 | 0.606 | ||
| 2 spectra, ASSGLLYPLER | 0.000 | 0.000 | 0.000 | 0.000 | 0.000 | 0.000 | 0.350 | 0.650 | ||
| 2 spectra, FDEISFVNFAR | 0.000 | 0.000 | 0.000 | 0.000 | 0.000 | 0.000 | 0.438 | 0.562 | ||
| 1 spectrum, VDNIQAGELTEGIWR | 0.000 | 0.000 | 0.000 | 0.000 | 0.000 | 0.000 | 0.466 | 0.534 | ||
| 1 spectrum, GFIYVHKPPVHIR | 0.000 | 0.000 | 0.000 | 0.000 | 0.000 | 0.000 | 0.450 | 0.550 | ||
| 2 spectra, LSDFFK | 0.000 | 0.000 | 0.000 | 0.000 | 0.000 | 0.000 | 0.339 | 0.661 | ||
| 4 spectra, LFLLPHK | 0.000 | 0.000 | 0.000 | 0.000 | 0.000 | 0.000 | 0.534 | 0.466 |
| Plot | Mito | Lyso or Perox | ER | Golgi | PM | Cytosol | Nucleus | ||||||
| Expt B |
3 peptides |
6 spectra |
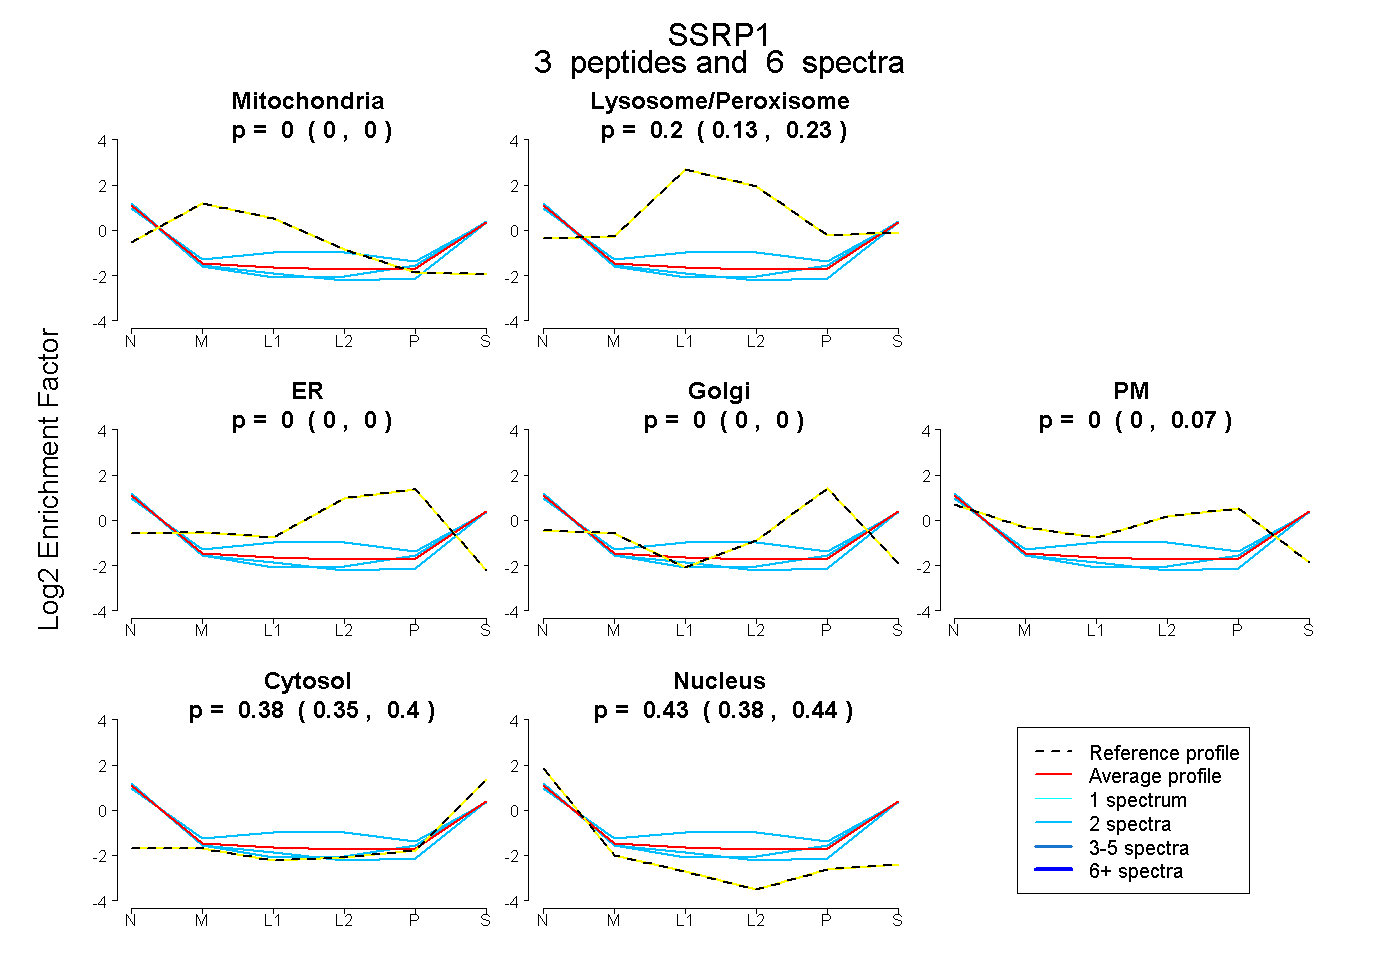 |
0.000 0.000 | 0.000 |
0.196 0.125 | 0.228 |
0.000 0.000 | 0.000 |
0.000 0.000 | 0.000 |
0.000 0.000 | 0.073 |
0.378 0.352 | 0.405 |
0.426 0.376 | 0.440 |
|||
| Plot | Lyso | Other | |||||||||||
| Expt C |
5 peptides |
8 spectra |
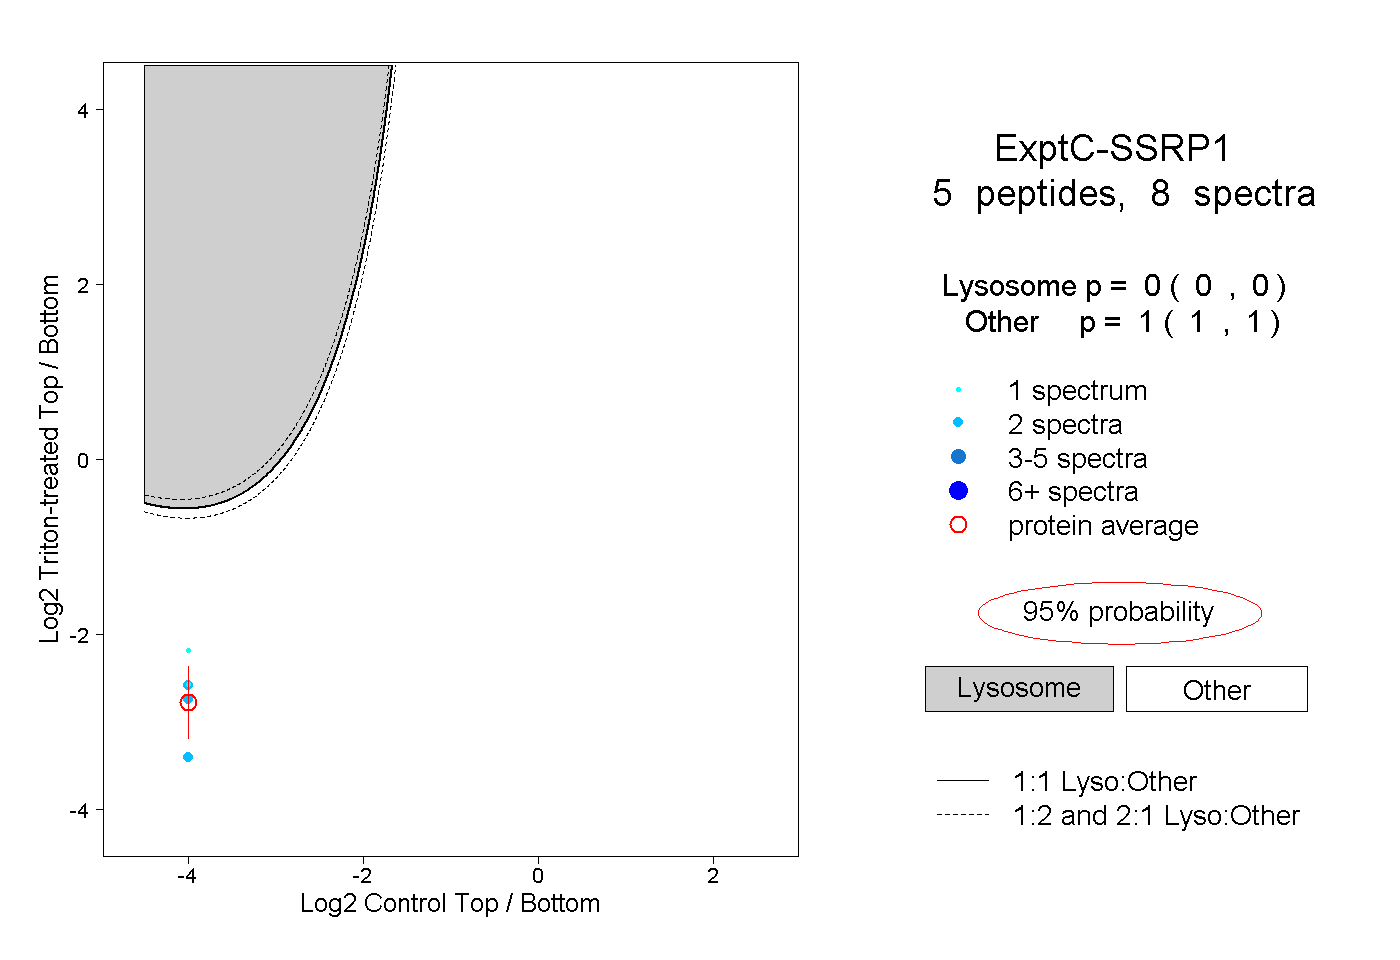 |
0.000 0.000 | 0.000 |
1.000 1.000 | 1.000 |