SSRP1
[ENSRNOP00000012022]
Main page
| | | Plot |
Mito |
Lyso |
|
Perox |
ER |
Golgi |
PM |
Cytosol |
Nucleus |
|
| Expt A |
 13
13
peptides |
25
spectra |
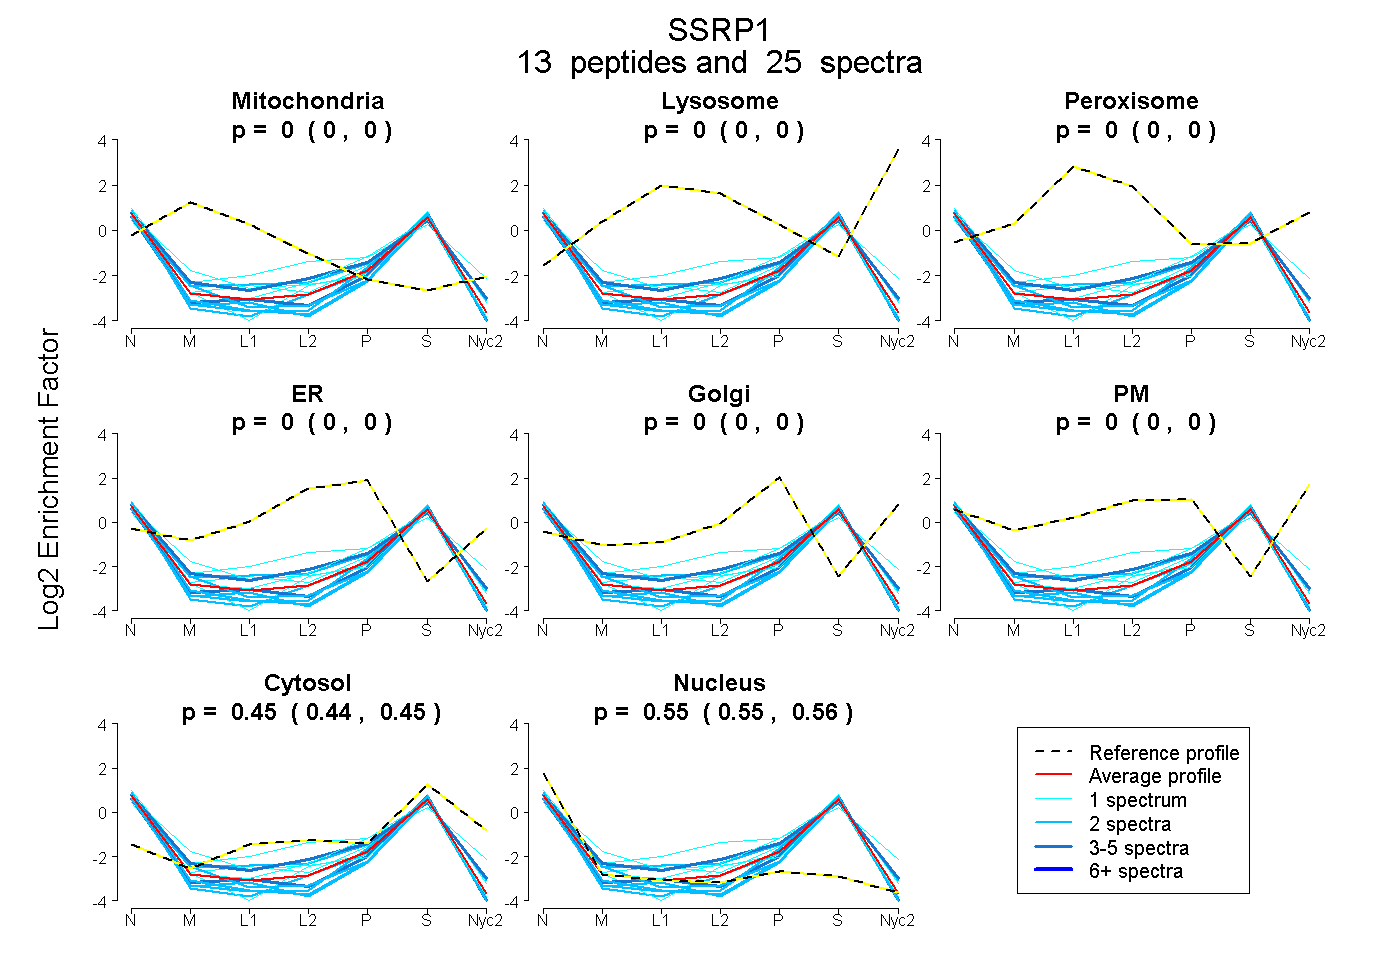 |
0.000
0.000 | 0.000 |
0.000
0.000 | 0.000 |
|
0.000
0.000 | 0.000 |
0.000
0.000 | 0.000 |
0.000
0.000 | 0.000 |
0.000
0.000 | 0.000 |
0.449
0.442 | 0.453 |
0.551
0.545 | 0.557 |
|
| | | Plot |
Mito |
|
Lyso or Perox |
|
ER |
Golgi |
PM |
Cytosol |
Nucleus |
|
| Expt B |
3
peptides |
6
spectra |
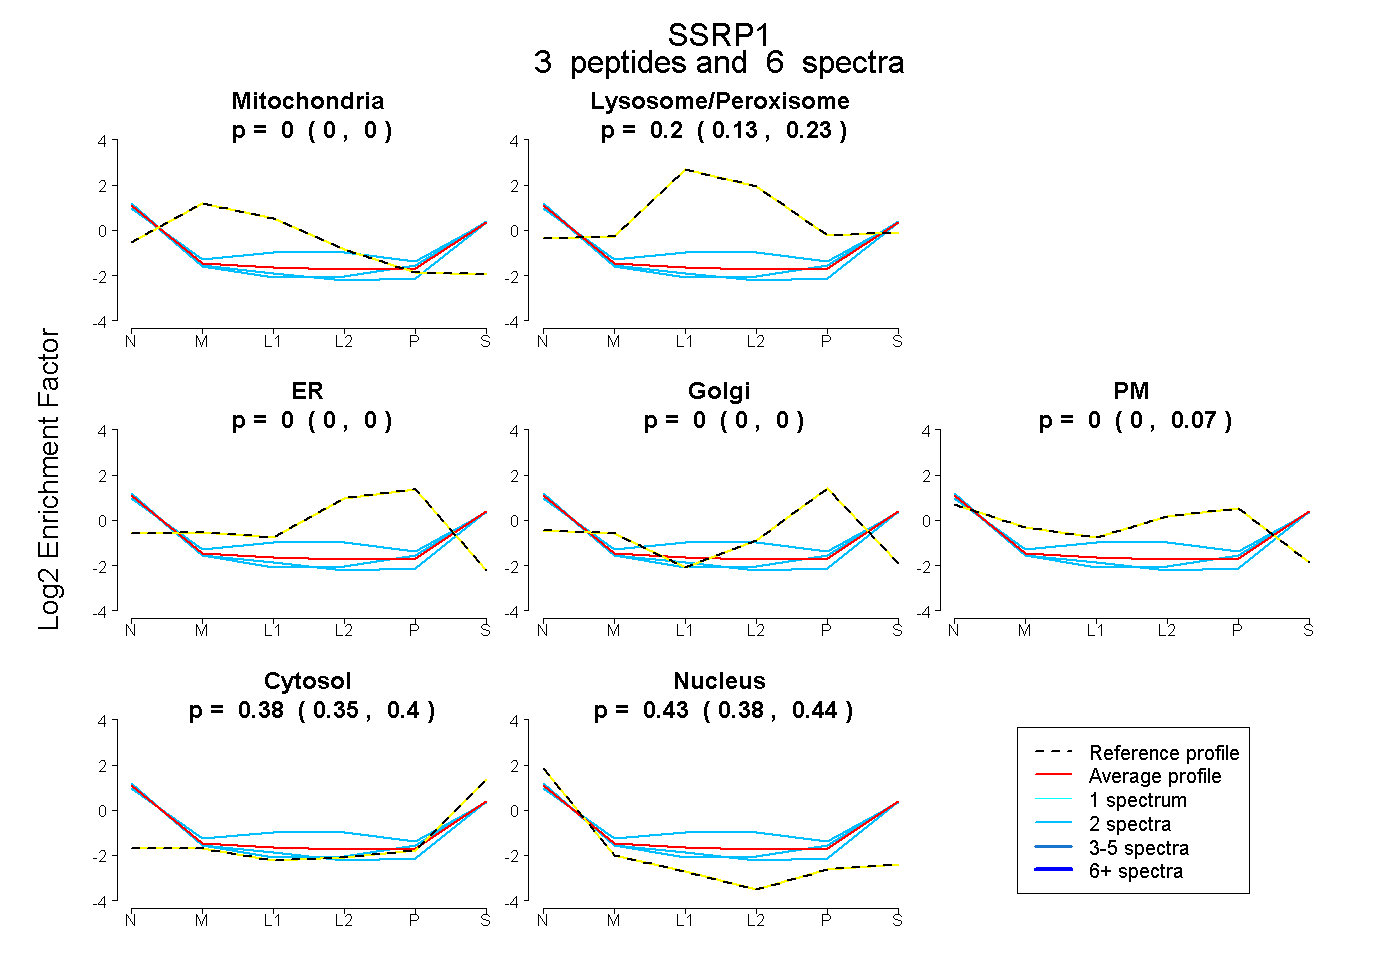 |
0.000
0.000 | 0.000 |
|
0.196
0.125 | 0.228 |
|
0.000
0.000 | 0.000 |
0.000
0.000 | 0.000 |
0.000
0.000 | 0.073 |
0.378
0.352 | 0.405 |
0.426
0.376 | 0.440 |
|
| 2 spectra, IYPTFLHLHGK |
0.000 |
|
0.120 |
|
0.000 |
0.000 |
0.000 |
0.401 |
0.479 |
|
| 2 spectra, IPYTTVLR |
0.000 |
|
0.071 |
|
0.000 |
0.000 |
0.096 |
0.430 |
0.403 |
|
| 2 spectra, LFLLPHK |
0.000 |
|
0.317 |
|
0.000 |
0.000 |
0.035 |
0.313 |
0.334 |
|
| | | Plot |
|
Lyso |
|
|
|
|
|
|
|
Other |
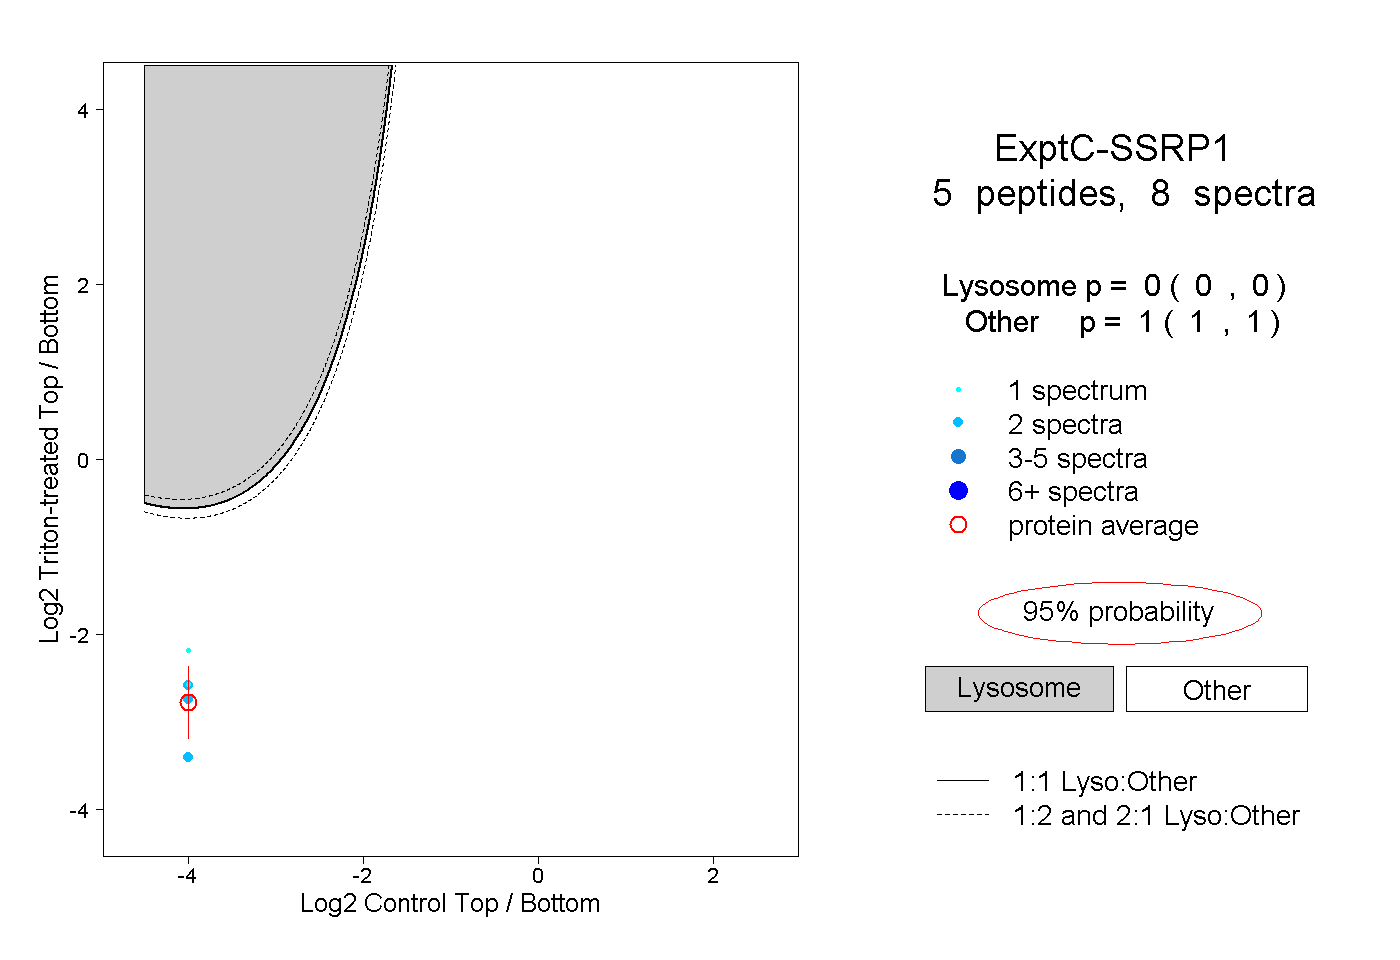
| Expt C |
5
peptides |
8
spectra |
 |
|
0.000
0.000 | 0.000 |
|
|
|
|
|
|
|
1.000
1.000 | 1.000 |