 6
6peptides
spectra
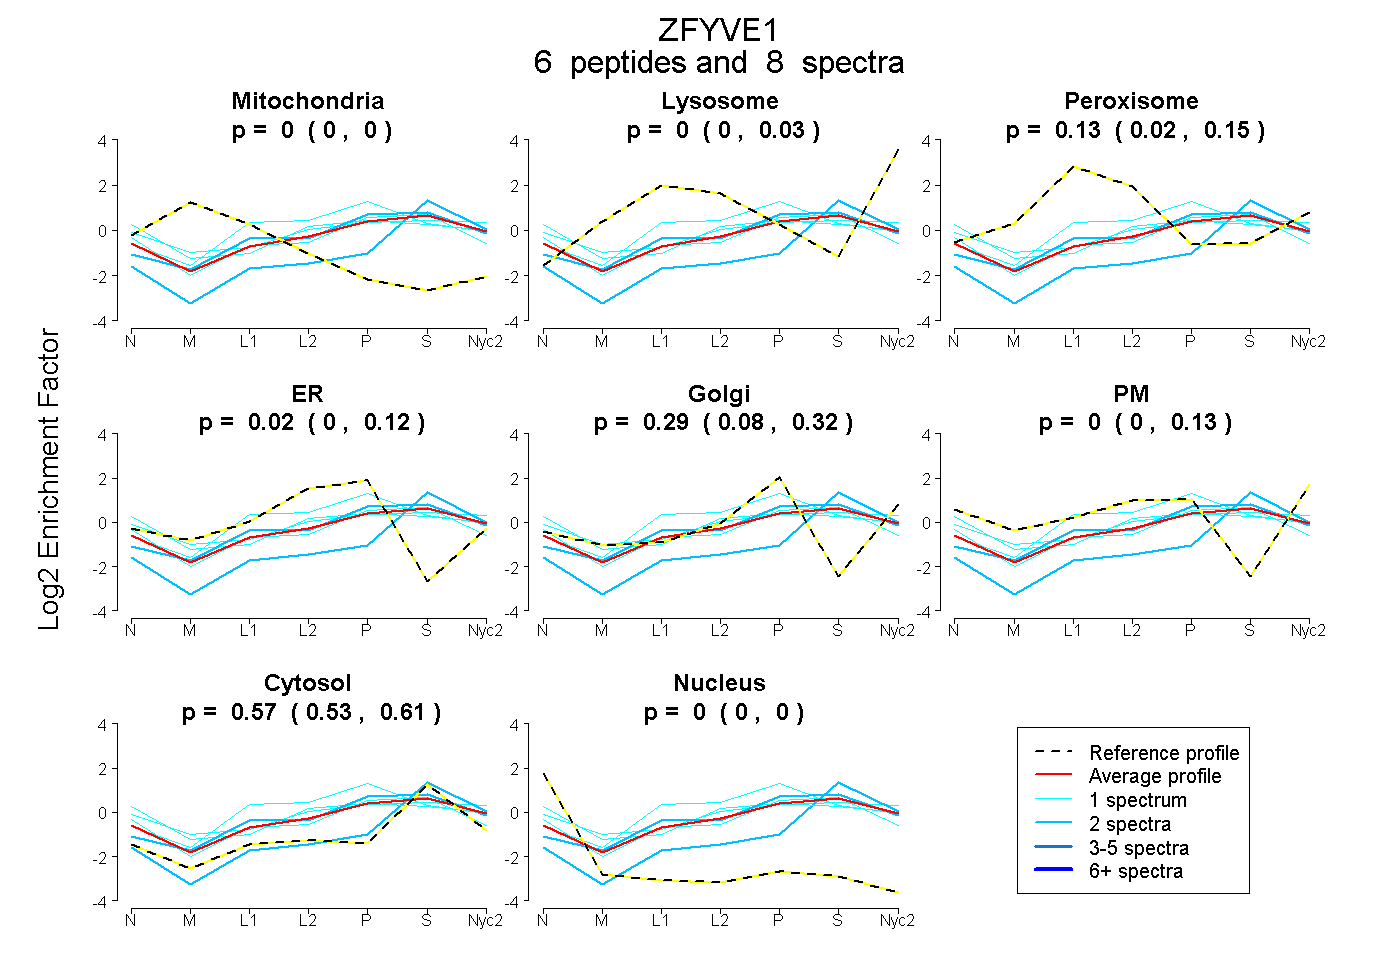
0.000 | 0.000
0.000 | 0.028
0.022 | 0.153
0.000 | 0.124
0.076 | 0.323
0.000 | 0.127
0.534 | 0.610
0.000 | 0.000
3peptides
spectra
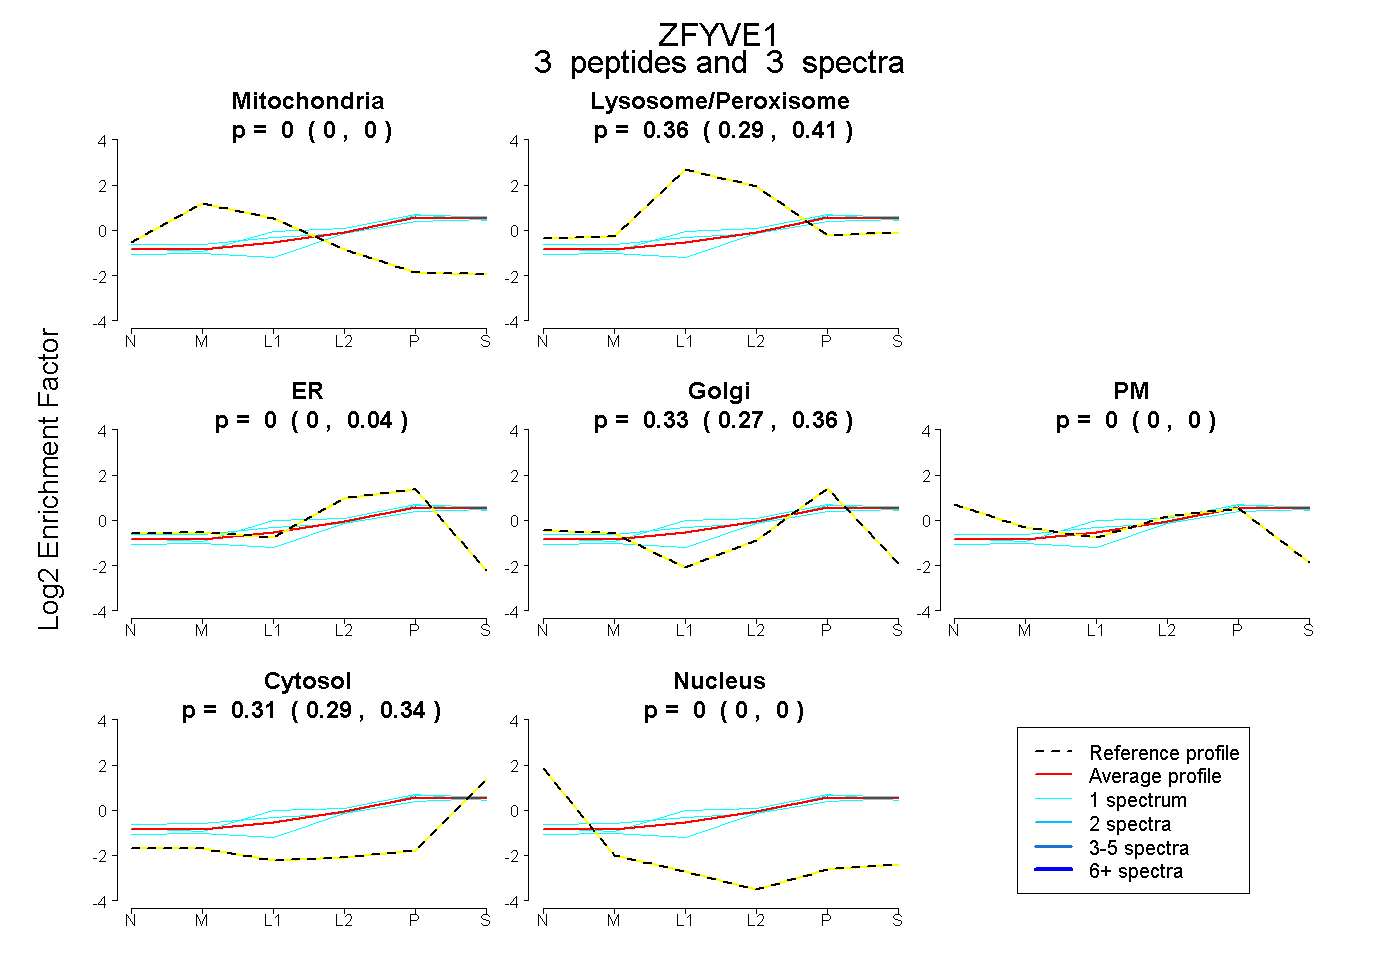
0.000 | 0.000
0.291 | 0.406
0.000 | 0.041
0.271 | 0.357
0.000 | 0.000
0.289 | 0.340
0.000 | 0.000
5peptides
spectra
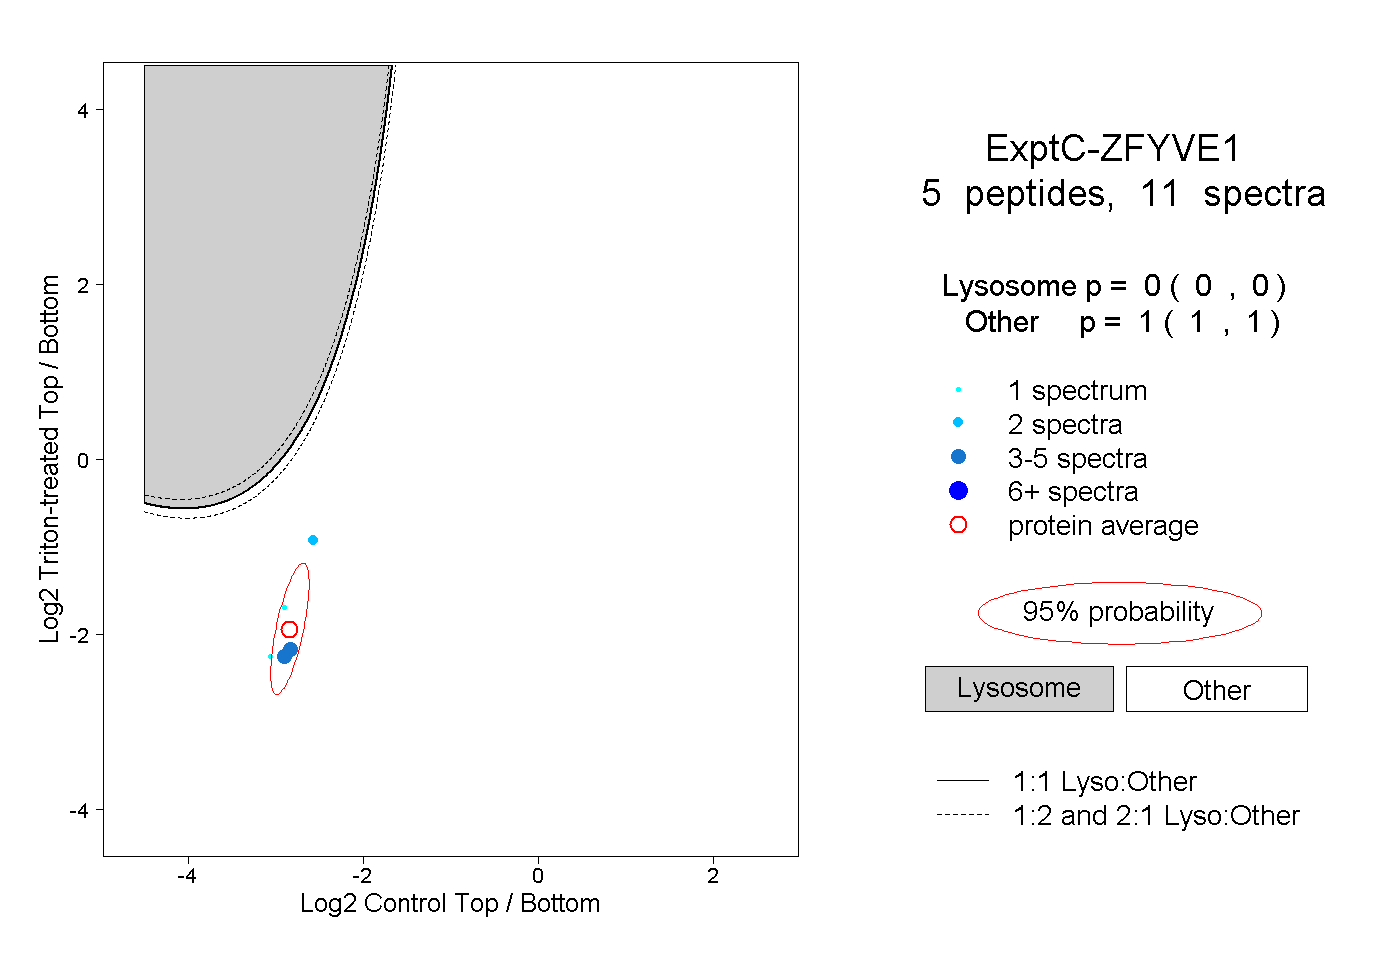
0.000 | 0.000
1.000 | 1.000