 6
6peptides
spectra
0.000 | 0.000
0.000 | 0.028
0.022 | 0.153
0.000 | 0.124
0.076 | 0.323
0.000 | 0.127
0.534 | 0.610
0.000 | 0.000
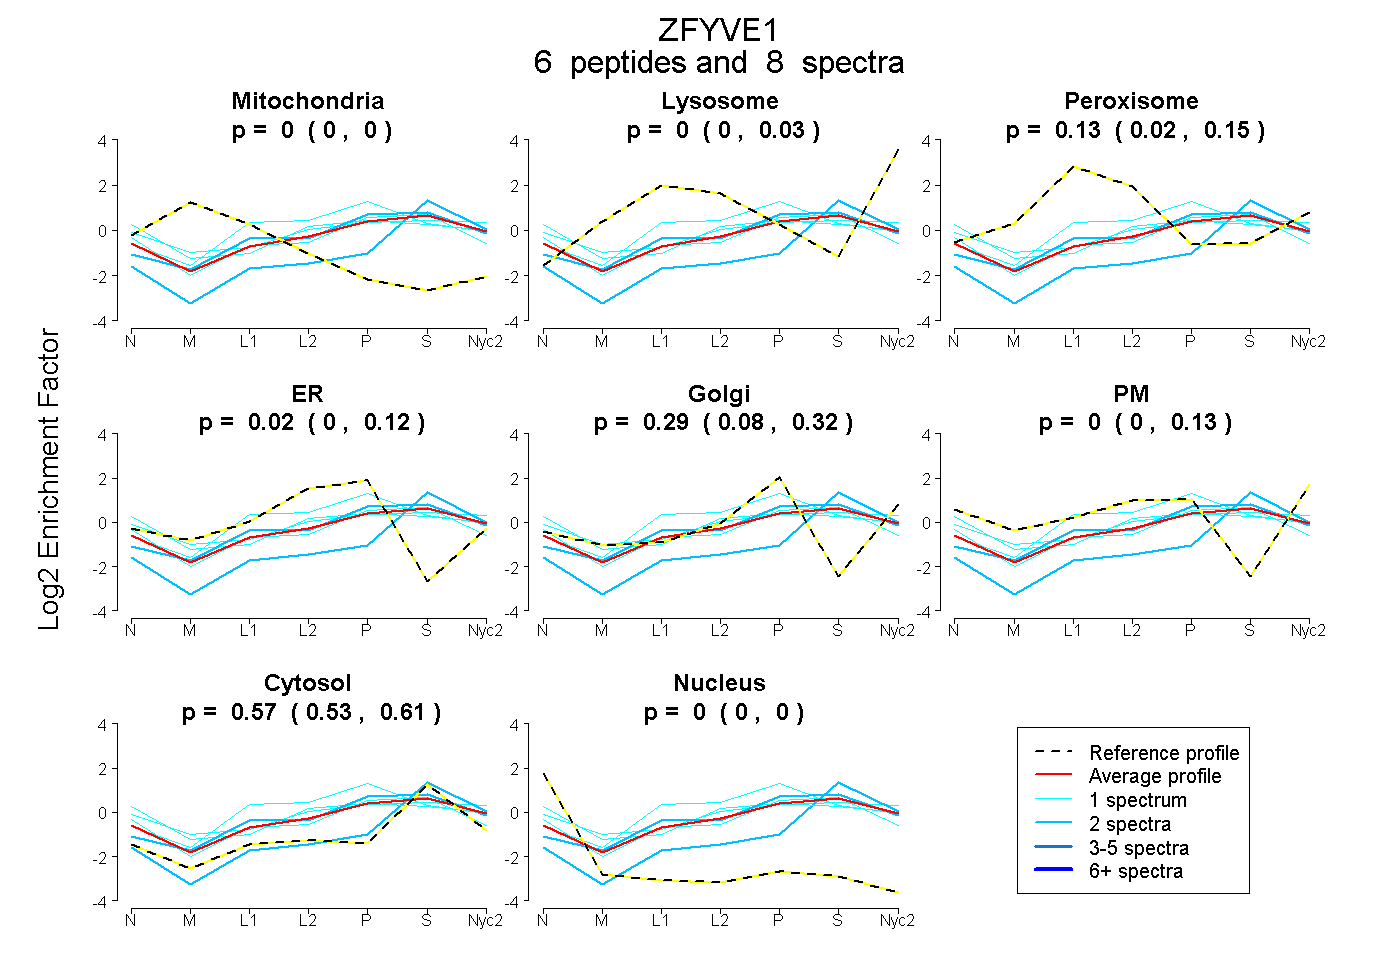
| Plot | Mito | Lyso | Perox | ER | Golgi | PM | Cytosol | Nucleus | |||||
| Expt A |
6 peptides |
8 spectra |
|
0.000 0.000 | 0.000 |
0.000 0.000 | 0.028 |
0.126 0.022 | 0.153 |
0.020 0.000 | 0.124 |
0.288 0.076 | 0.323 |
0.000 0.000 | 0.127 |
0.566 0.534 | 0.610 |
0.000 0.000 | 0.000 |
| 1 spectrum, HPGVIFK | 0.000 | 0.000 | 0.027 | 0.212 | 0.134 | 0.000 | 0.627 | 0.000 | ||
| 1 spectrum, SHTLNHTFFHGR | 0.000 | 0.000 | 0.000 | 0.115 | 0.000 | 0.375 | 0.510 | 0.000 | ||
| 2 spectra, VLAISDLVIYR | 0.000 | 0.033 | 0.119 | 0.042 | 0.240 | 0.000 | 0.566 | 0.000 | ||
| 2 spectra, HSNNK | 0.000 | 0.000 | 0.000 | 0.000 | 0.024 | 0.000 | 0.976 | 0.000 | ||
| 1 spectrum, EGVPHEAK | 0.000 | 0.000 | 0.225 | 0.260 | 0.153 | 0.000 | 0.362 | 0.000 | ||
| 1 spectrum, ACGQGFCDECSHGR | 0.000 | 0.000 | 0.053 | 0.000 | 0.012 | 0.422 | 0.513 | 0.000 |
| Plot | Mito | Lyso or Perox | ER | Golgi | PM | Cytosol | Nucleus | ||||||
| Expt B |
3 peptides |
3 spectra |
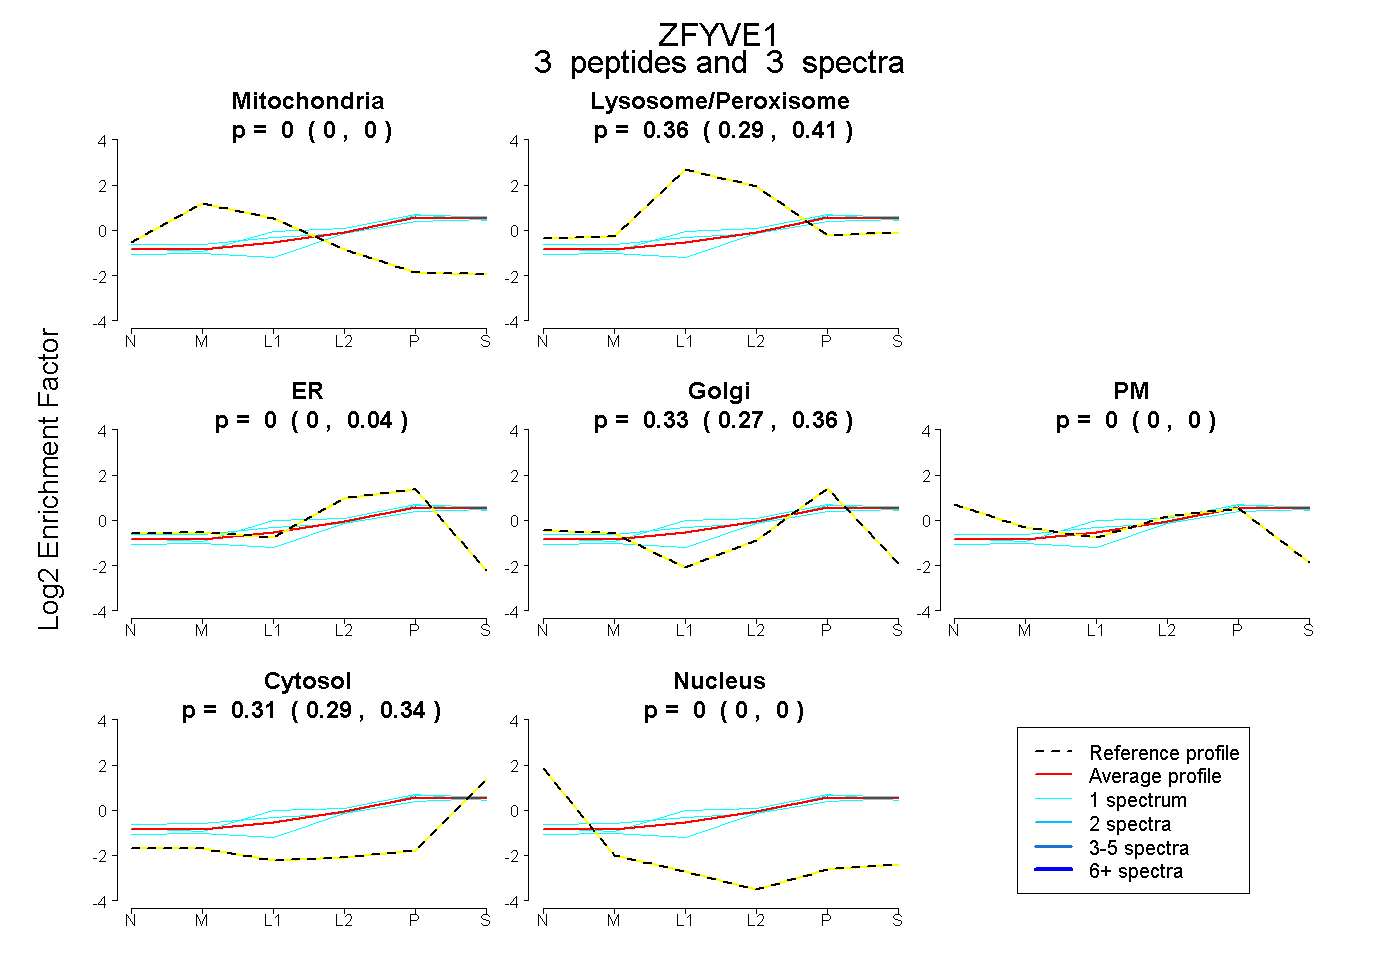 |
0.000 0.000 | 0.000 |
0.361 0.291 | 0.406 |
0.000 0.000 | 0.041 |
0.326 0.271 | 0.357 |
0.000 0.000 | 0.000 |
0.313 0.289 | 0.340 |
0.000 0.000 | 0.000 |
|||
| Plot | Lyso | Other | |||||||||||
| Expt C |
5 peptides |
11 spectra |
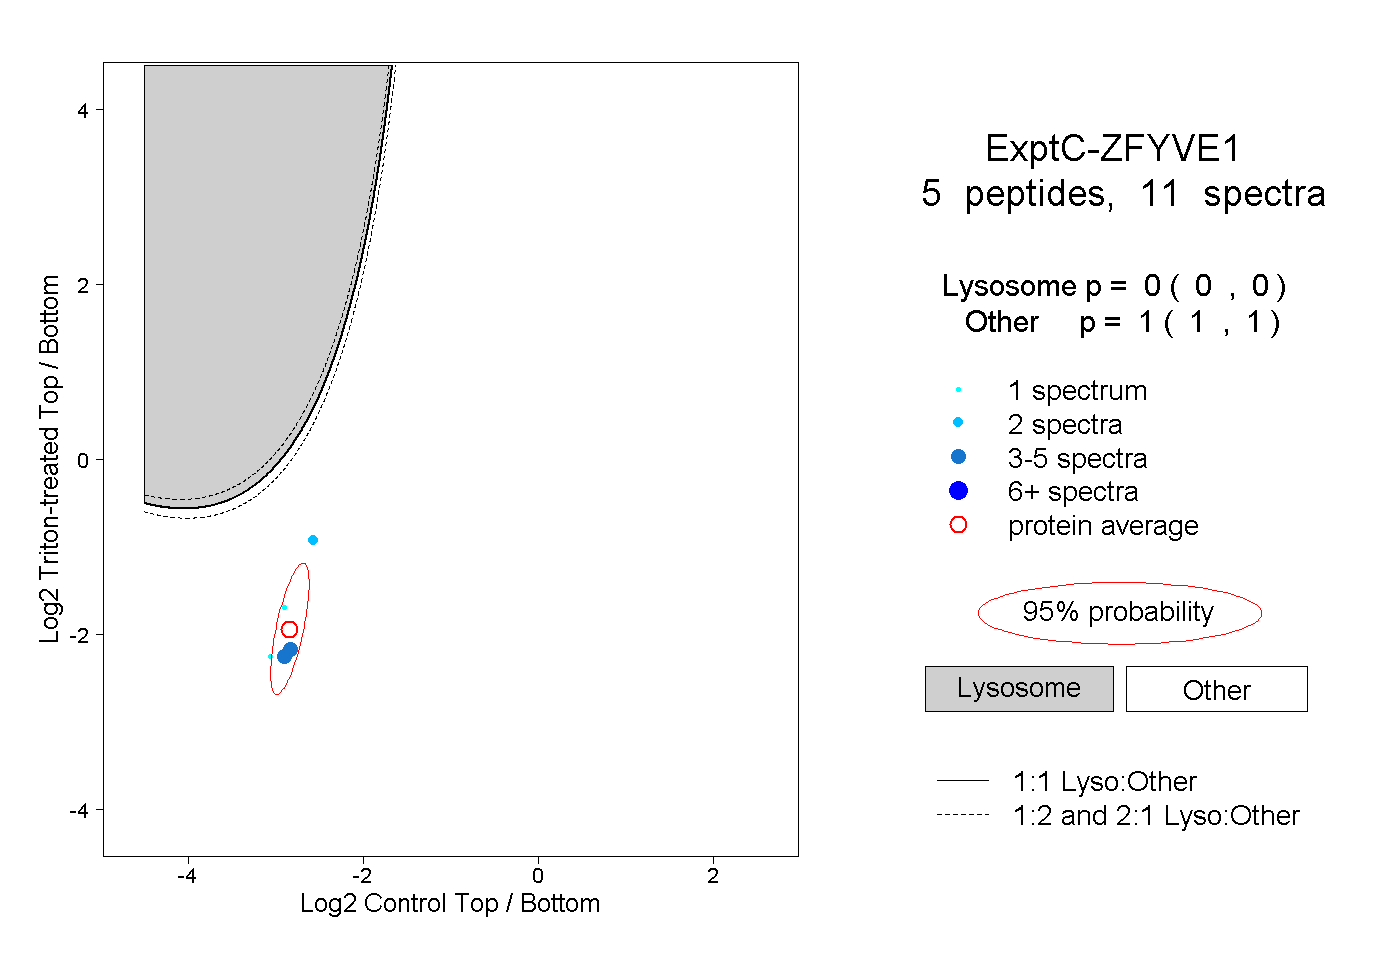 |
0.000 0.000 | 0.000 |
1.000 1.000 | 1.000 |