ZFYVE1
[ENSRNOP00000011662]
Main page
| | | Plot |
Mito |
Lyso |
|
Perox |
ER |
Golgi |
PM |
Cytosol |
Nucleus |
|
| Expt A |
 6
6
peptides |
8
spectra |
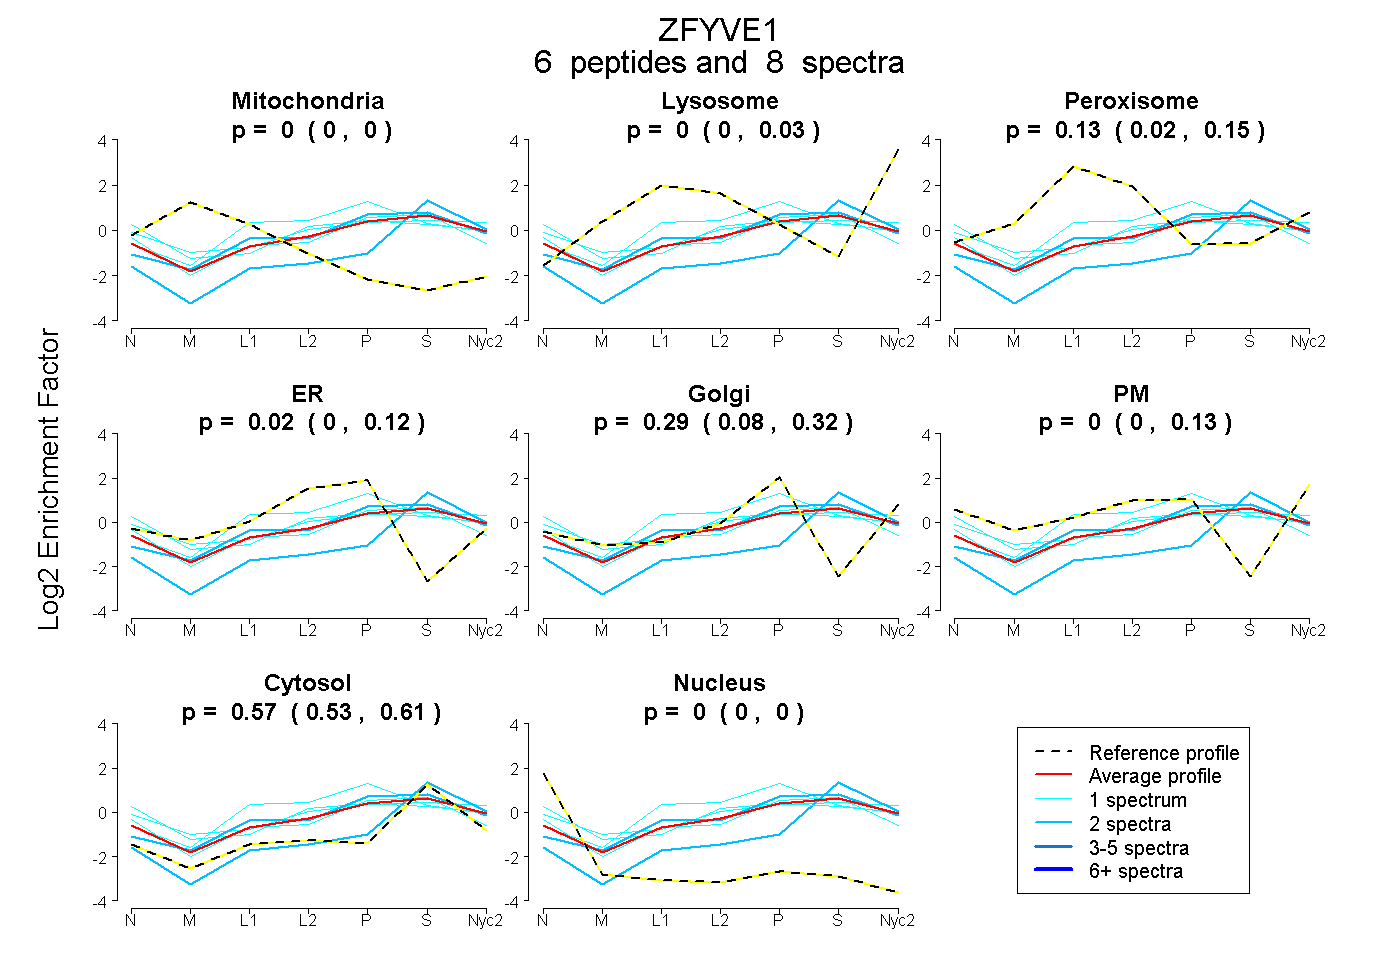 |
0.000
0.000 | 0.000 |
0.000
0.000 | 0.028 |
|
0.126
0.022 | 0.153 |
0.020
0.000 | 0.124 |
0.288
0.076 | 0.323 |
0.000
0.000 | 0.127 |
0.566
0.534 | 0.610 |
0.000
0.000 | 0.000 |
|
| | | Plot |
Mito |
|
Lyso or Perox |
|
ER |
Golgi |
PM |
Cytosol |
Nucleus |
|
| Expt B |
3
peptides |
3
spectra |
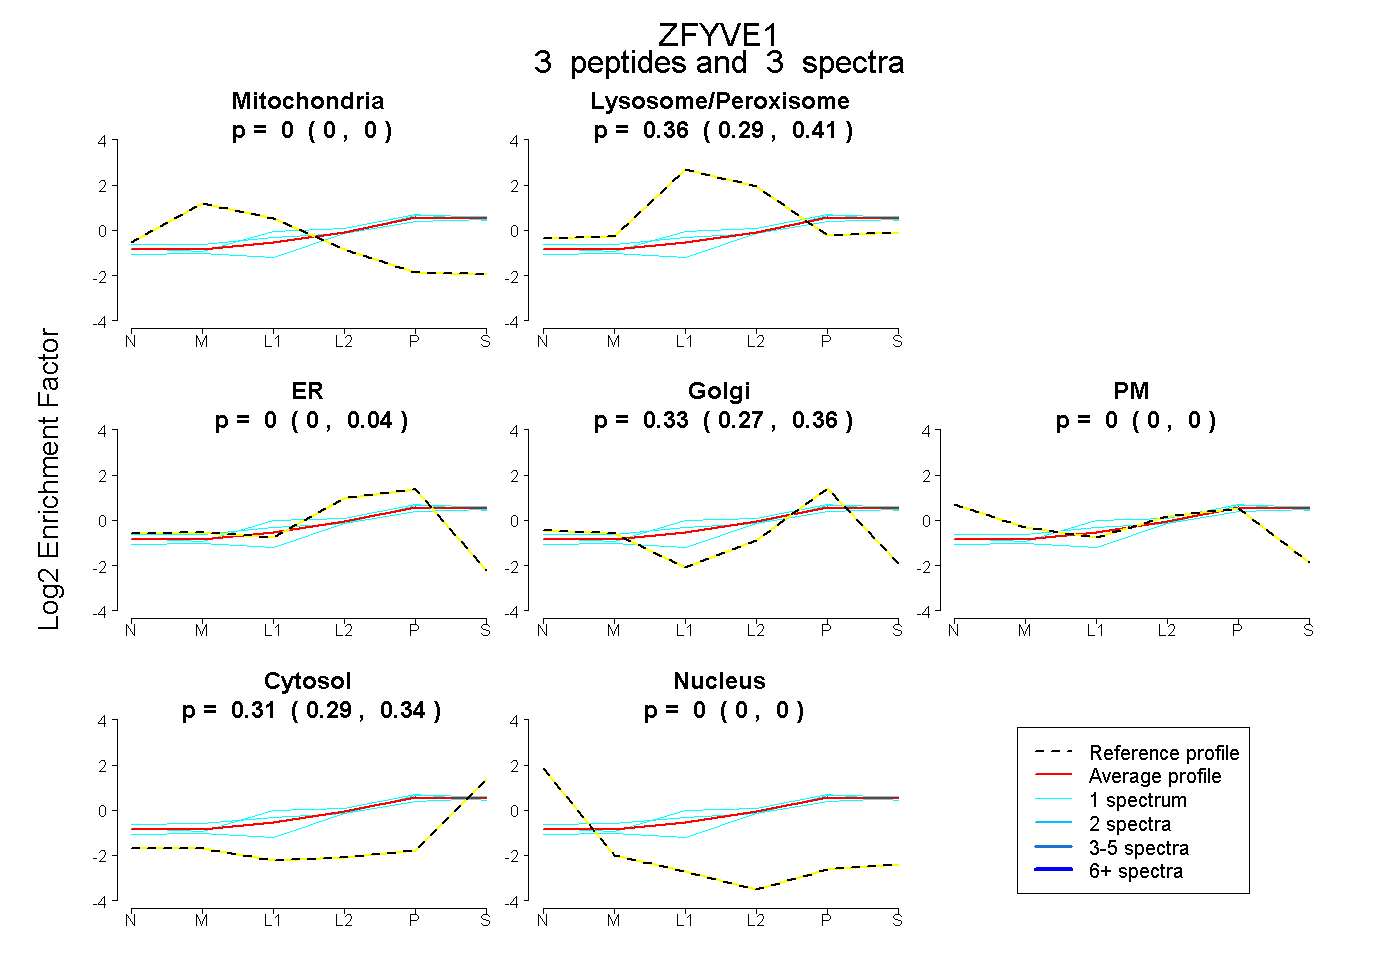 |
0.000
0.000 | 0.000 |
|
0.361
0.291 | 0.406 |
|
0.000
0.000 | 0.041 |
0.326
0.271 | 0.357 |
0.000
0.000 | 0.000 |
0.313
0.289 | 0.340 |
0.000
0.000 | 0.000 |
|
| 1 spectrum, VLAISDLVIYR |
0.000 |
|
0.178 |
|
0.227 |
0.178 |
0.000 |
0.418 |
0.000 |
|
| 1 spectrum, VVSIFGNTGDGK |
0.000 |
|
0.392 |
|
0.000 |
0.298 |
0.000 |
0.309 |
0.000 |
|
| 1 spectrum, EGVPHEAK |
0.000 |
|
0.437 |
|
0.000 |
0.303 |
0.000 |
0.260 |
0.000 |
|
| | | Plot |
|
Lyso |
|
|
|
|
|
|
|
Other |
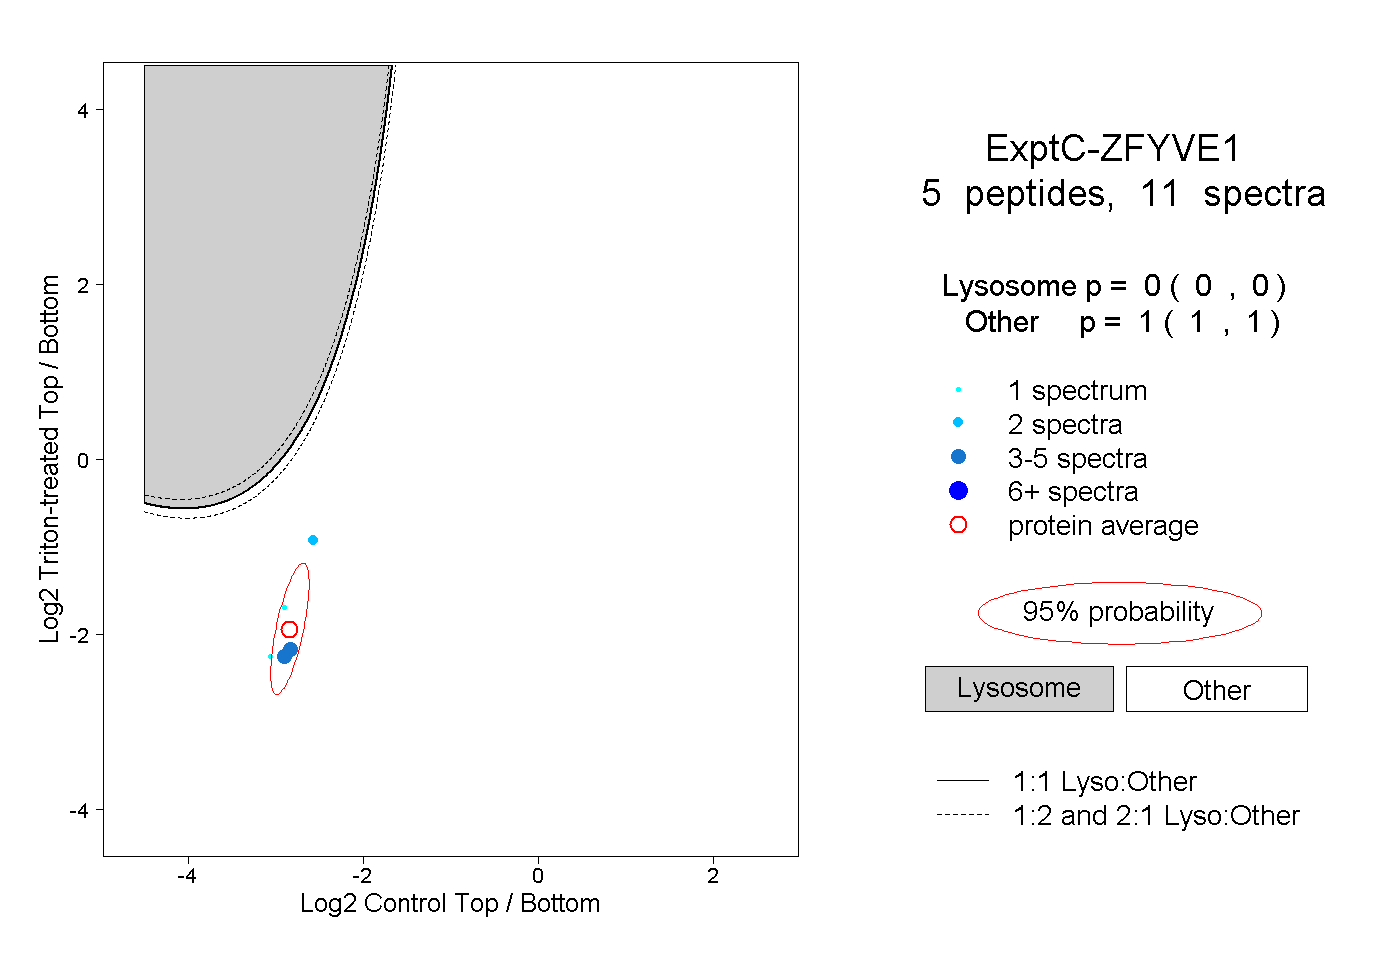
| Expt C |
5
peptides |
11
spectra |
 |
|
0.000
0.000 | 0.000 |
|
|
|
|
|
|
|
1.000
1.000 | 1.000 |