 9
9peptides
spectra
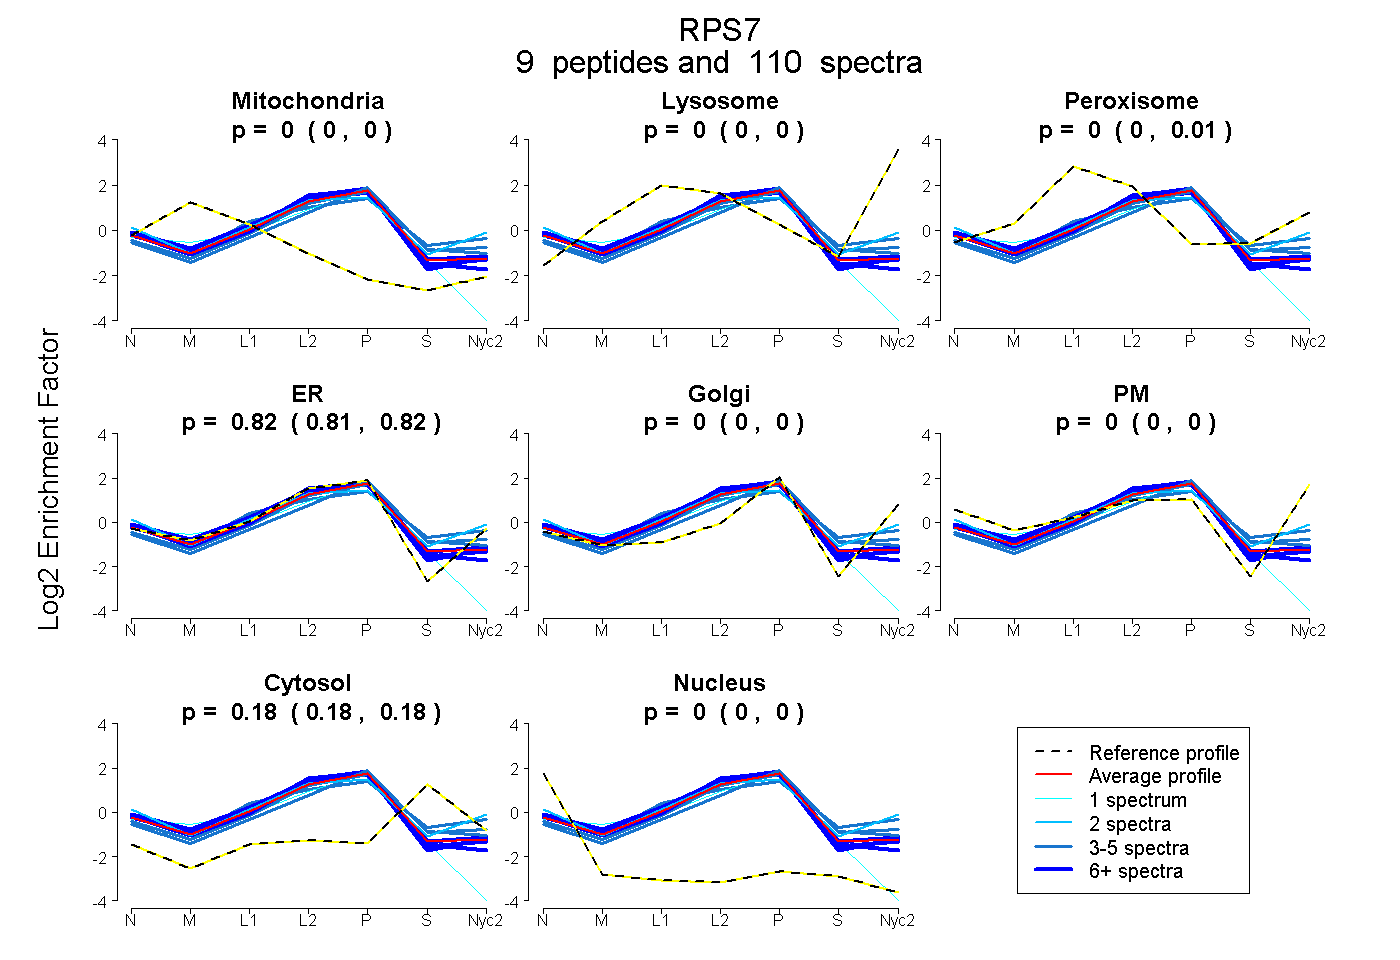
0.000 | 0.000
0.000 | 0.000
0.000 | 0.006
0.811 | 0.818
0.000 | 0.000
0.000 | 0.000
0.179 | 0.183
0.000 | 0.000
8peptides
spectra
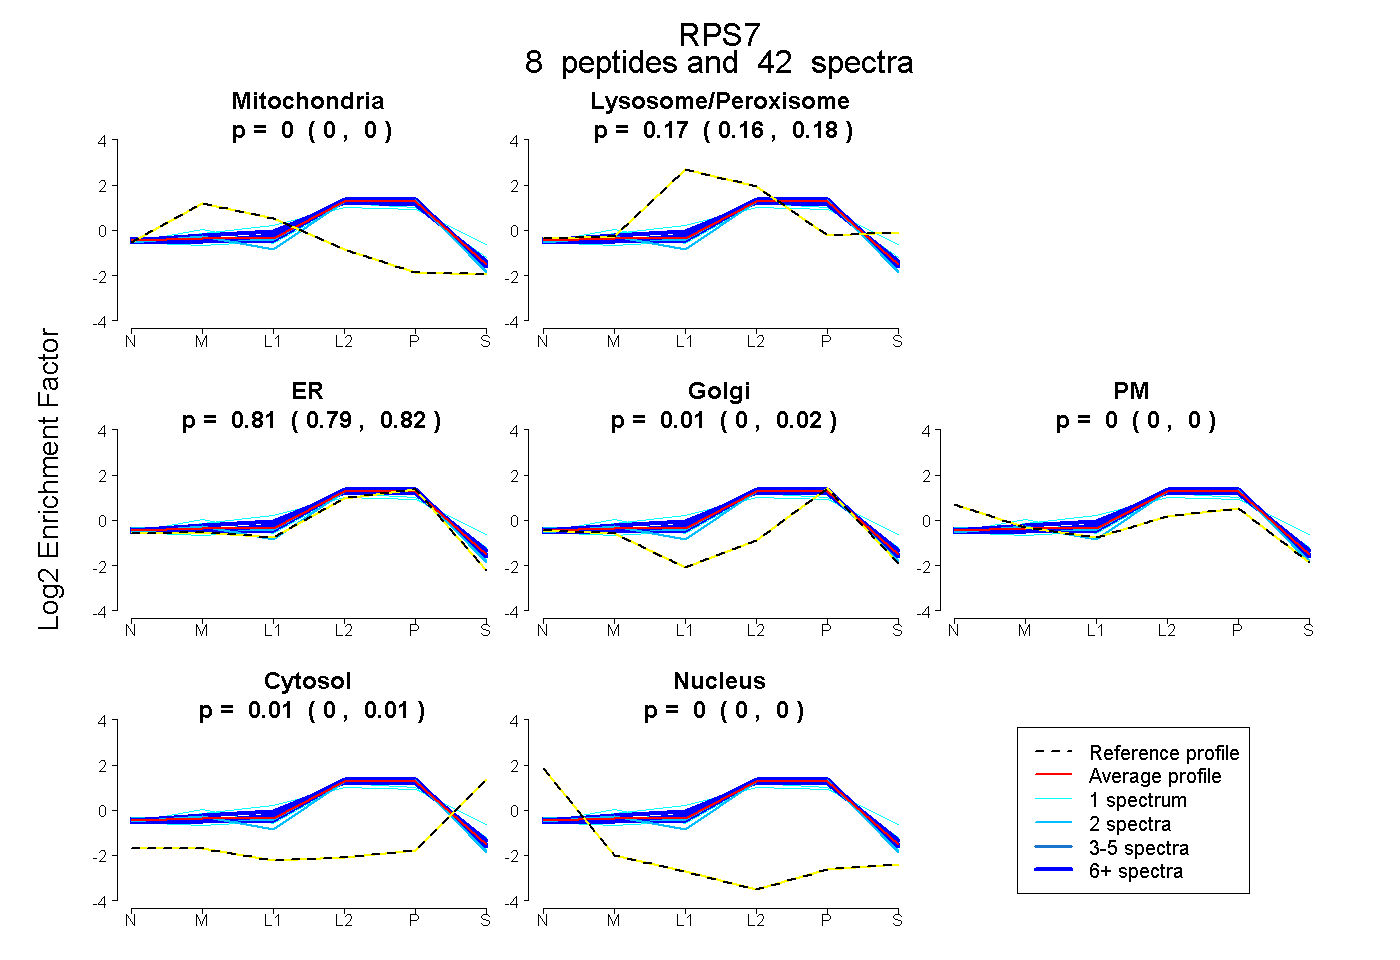
0.000 | 0.000
0.164 | 0.182
0.791 | 0.823
0.000 | 0.021
0.000 | 0.000
0.001 | 0.012
0.000 | 0.000
7peptides
spectra
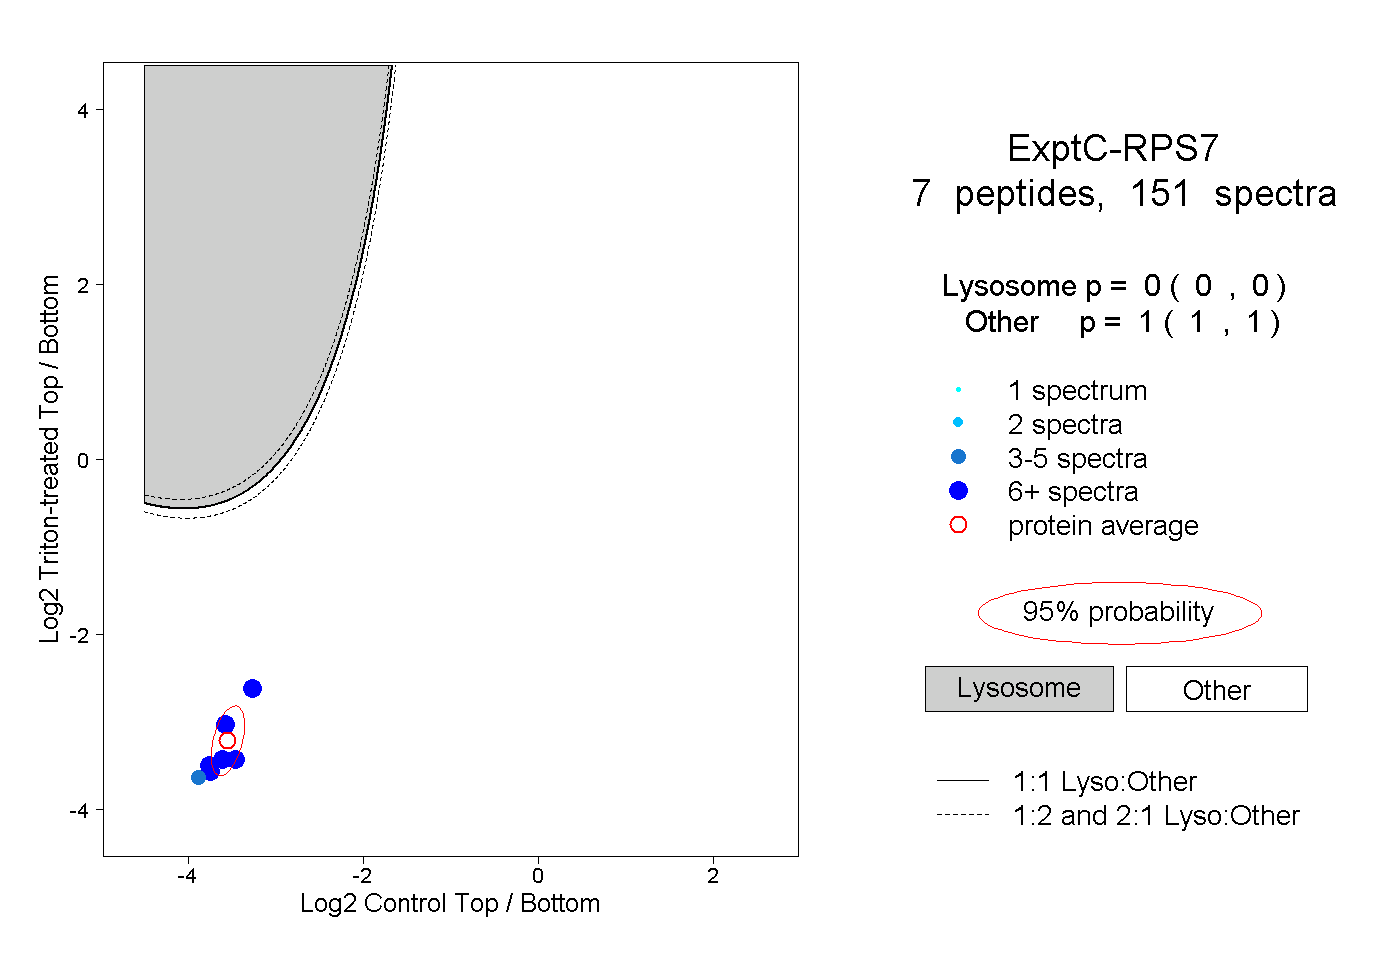
0.000 | 0.000
1.000 | 1.000
5peptides
spectra
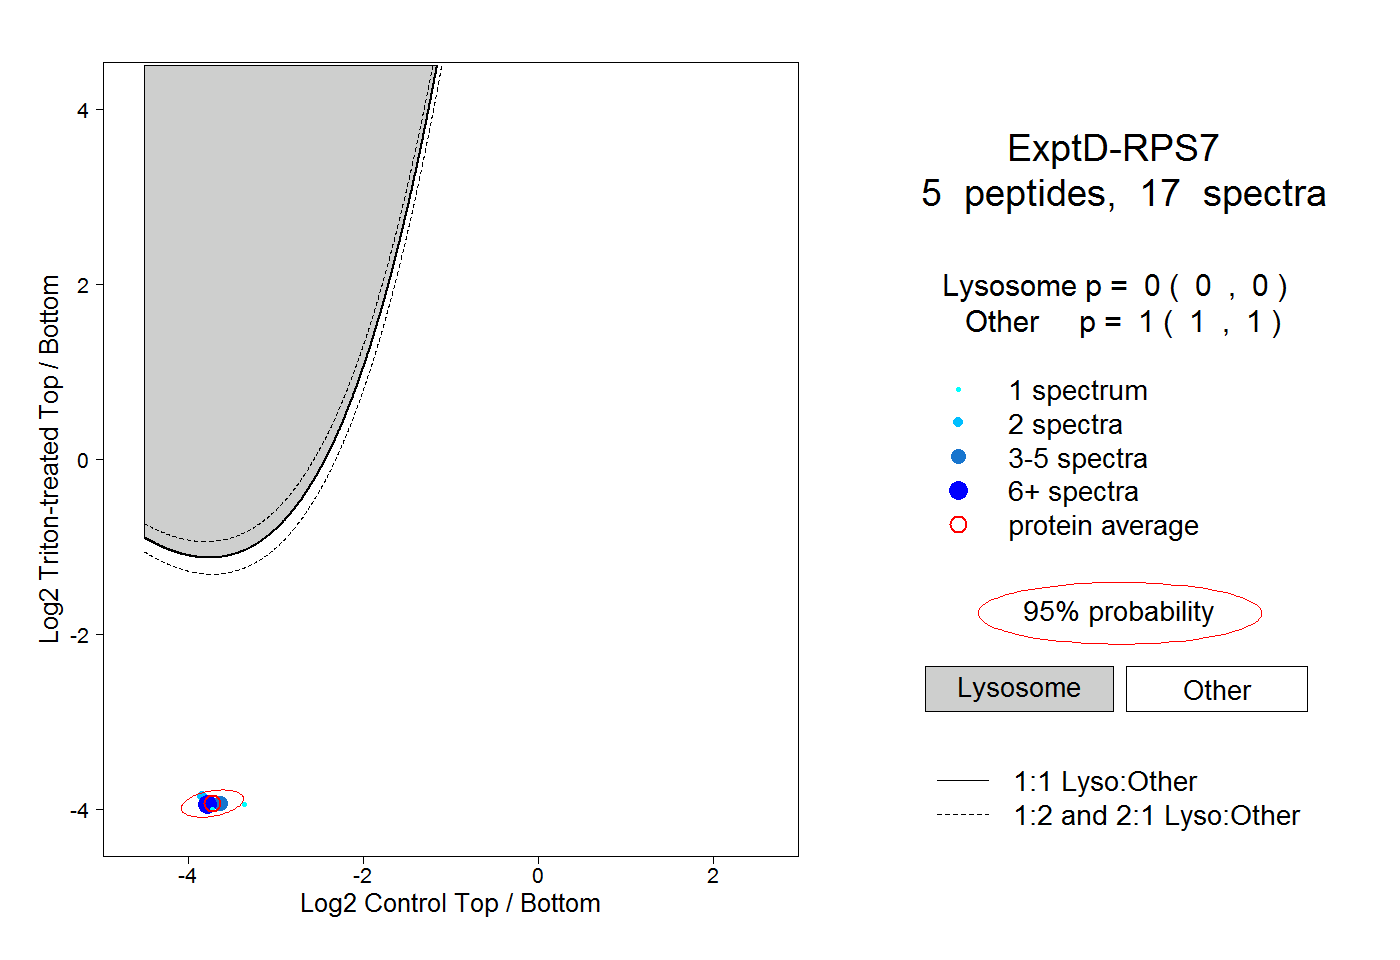
0.000 | 0.000
1.000 | 1.000