RPS7
[ENSRNOP00000011333]
Main page
| | | Plot |
Mito |
Lyso |
|
Perox |
ER |
Golgi |
PM |
Cytosol |
Nucleus |
|
| Expt A |
 9
9
peptides |
110
spectra |
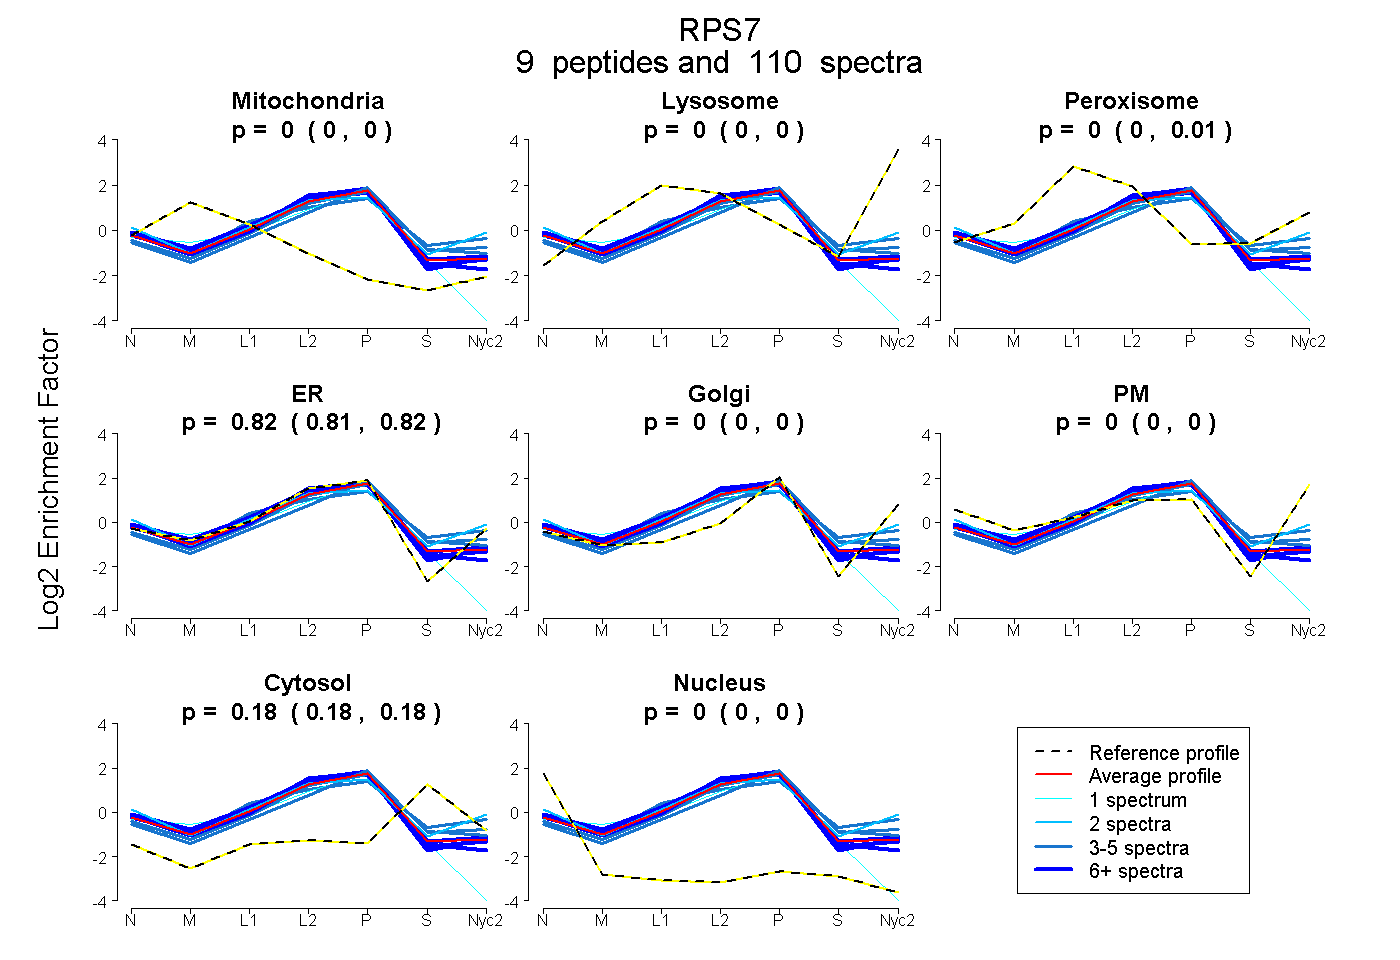 |
0.000
0.000 | 0.000 |
0.000
0.000 | 0.000 |
|
0.003
0.000 | 0.006 |
0.815
0.811 | 0.818 |
0.000
0.000 | 0.000 |
0.000
0.000 | 0.000 |
0.181
0.179 | 0.183 |
0.000
0.000 | 0.000 |
|
| | | Plot |
Mito |
|
Lyso or Perox |
|
ER |
Golgi |
PM |
Cytosol |
Nucleus |
|
| Expt B |
8
peptides |
42
spectra |
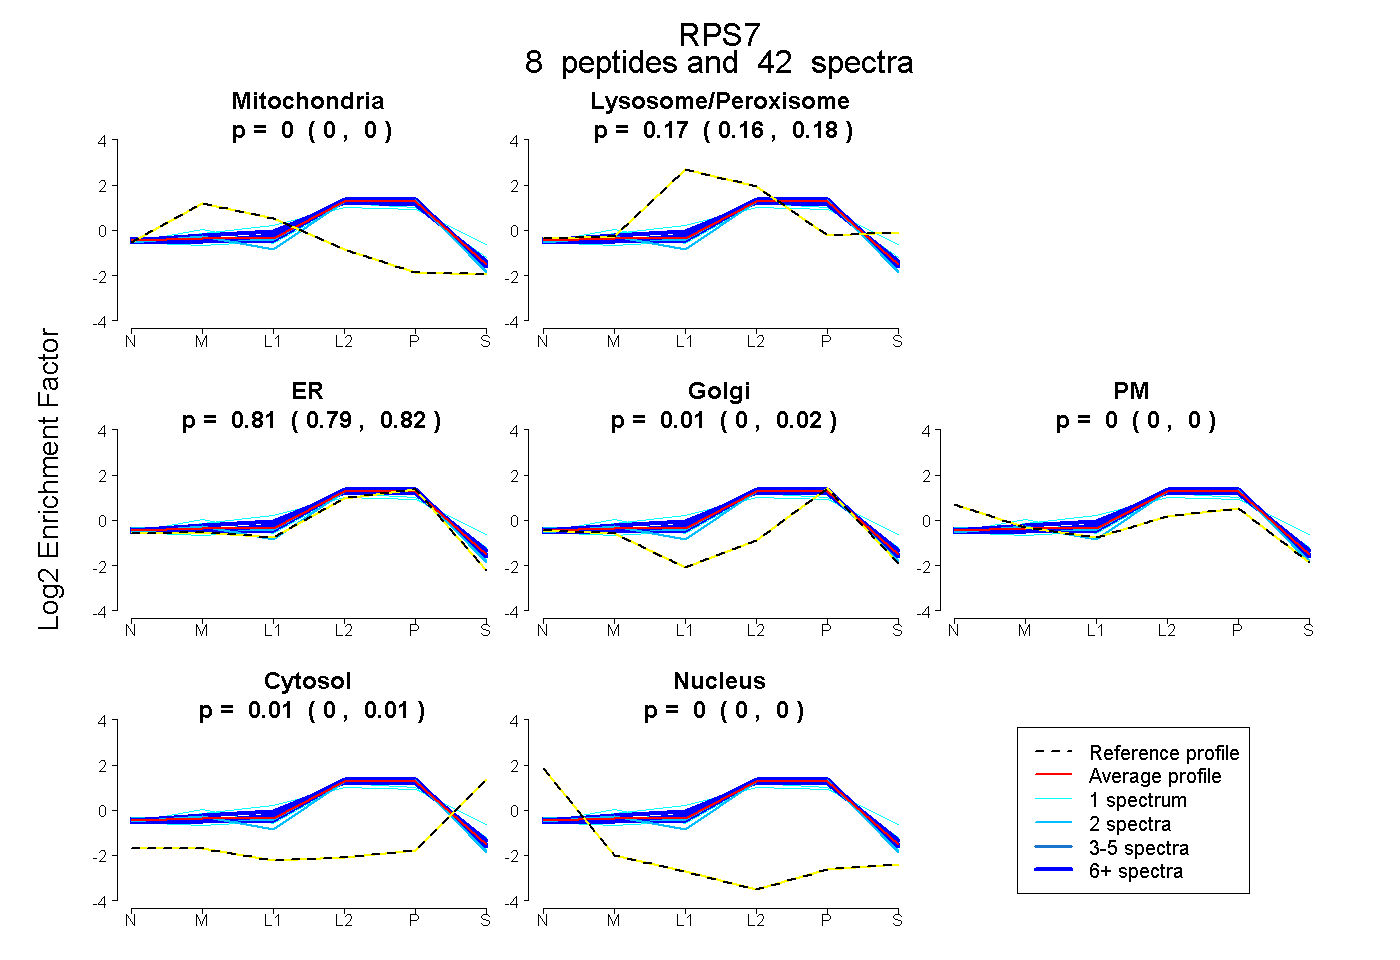 |
0.000
0.000 | 0.000 |
|
0.173
0.164 | 0.182 |
|
0.809
0.791 | 0.823 |
0.010
0.000 | 0.021 |
0.000
0.000 | 0.000 |
0.007
0.001 | 0.012 |
0.000
0.000 | 0.000 |
|
| 2 spectra, ELNITAAK |
0.000 |
|
0.116 |
|
0.884 |
0.000 |
0.000 |
0.000 |
0.000 |
|
| 1 spectrum, DVNFEFPEFQL |
0.000 |
|
0.458 |
|
0.228 |
0.291 |
0.000 |
0.022 |
0.000 |
|
| 2 spectra, VETFSGVYK |
0.000 |
|
0.045 |
|
0.947 |
0.000 |
0.000 |
0.008 |
0.000 |
|
| 20 spectra, HVVFIAQR |
0.000 |
|
0.264 |
|
0.666 |
0.071 |
0.000 |
0.000 |
0.000 |
|
| 9 spectra, ILPKPTR |
0.000 |
|
0.177 |
|
0.823 |
0.000 |
0.000 |
0.000 |
0.000 |
|
| 1 spectrum, AQQNNVEHK |
0.000 |
|
0.174 |
|
0.726 |
0.025 |
0.016 |
0.059 |
0.000 |
|
| 1 spectrum, AIIIFVPVPQLK |
0.000 |
|
0.096 |
|
0.904 |
0.000 |
0.000 |
0.000 |
0.000 |
|
| 6 spectra, EIEVGGGR |
0.000 |
|
0.149 |
|
0.833 |
0.000 |
0.014 |
0.004 |
0.000 |
|
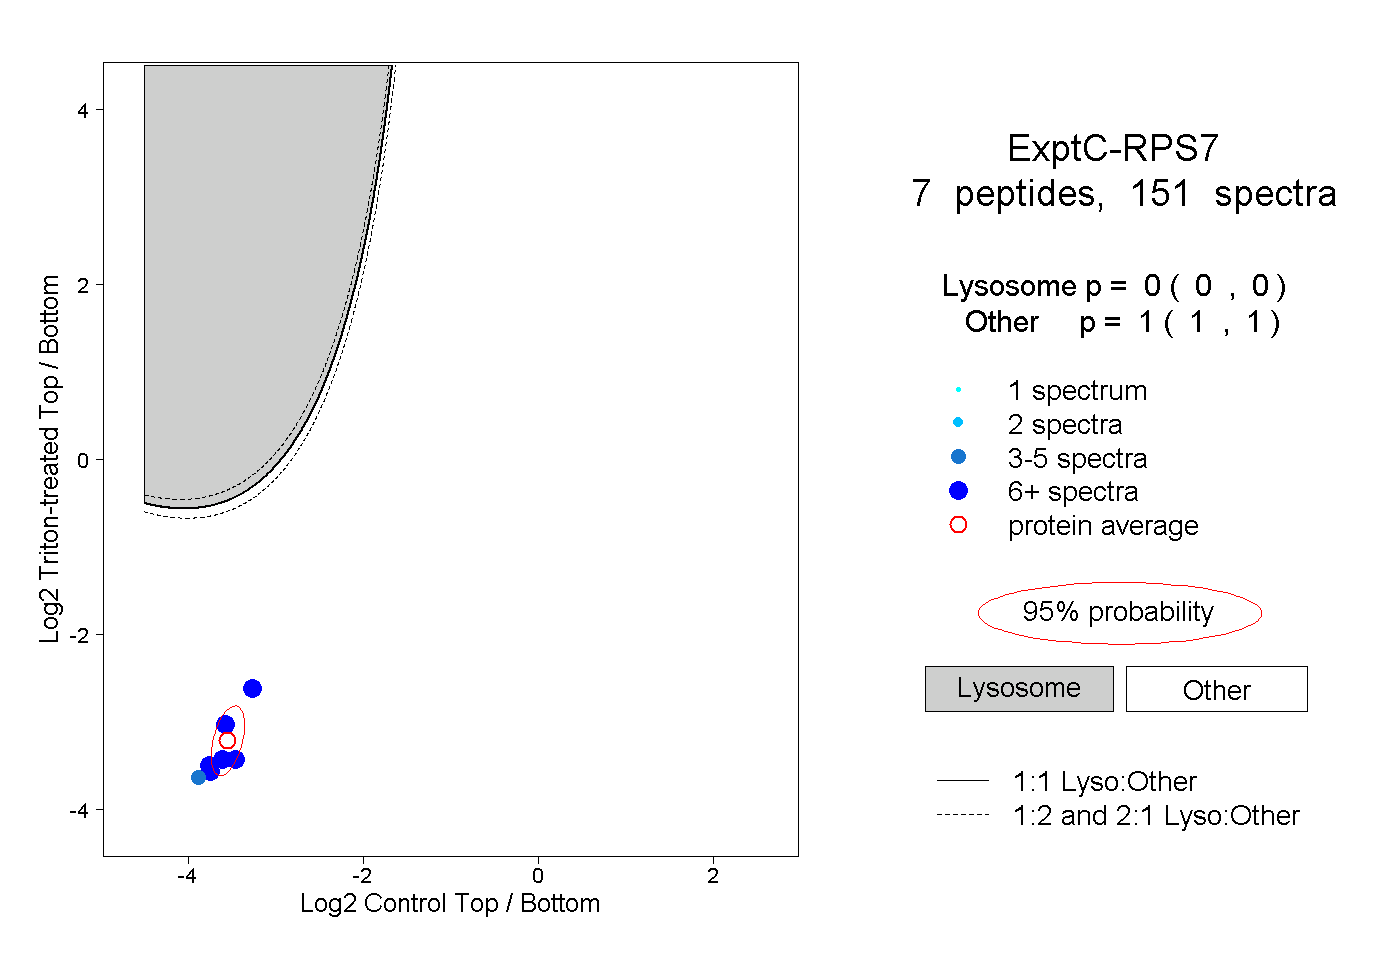
| | | Plot |
|
Lyso |
|
|
|
|
|
|
|
Other |
| Expt C |
7
peptides |
151
spectra |
 |
|
0.000
0.000 | 0.000 |
|
|
|
|
|
|
|
1.000
1.000 | 1.000 |
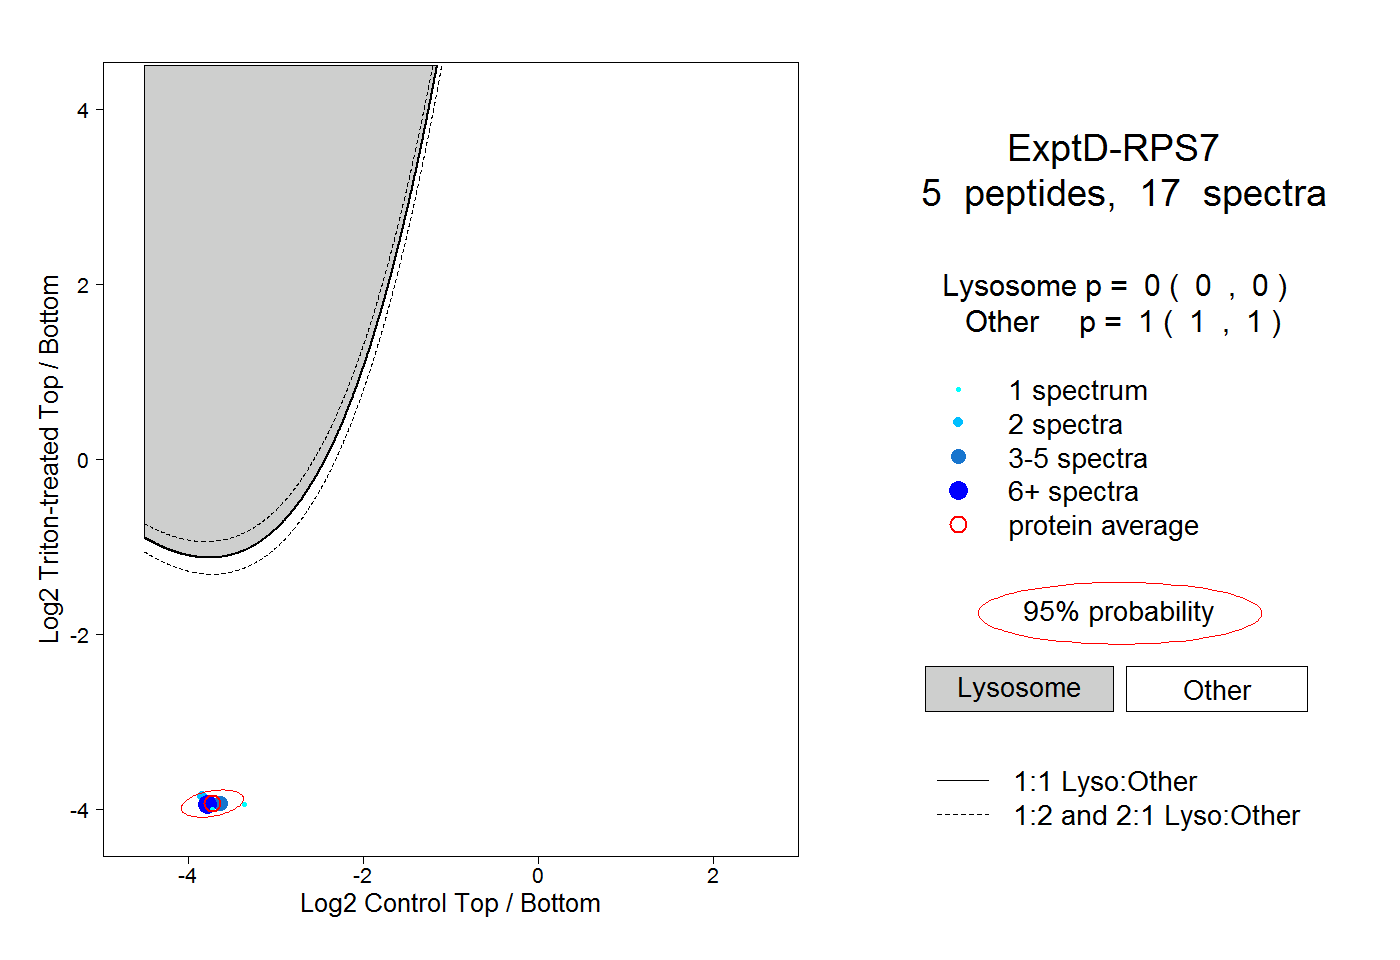
| | | Plot |
|
Lyso |
|
|
|
|
|
|
|
Other |
| Expt D |
5
peptides |
17
spectra |
 |
|
0.000
0.000 | 0.000 |
|
|
|
|
|
|
|
1.000
1.000 | 1.000 |