 9
9peptides
spectra
0.000 | 0.000
0.000 | 0.000
0.000 | 0.006
0.811 | 0.818
0.000 | 0.000
0.000 | 0.000
0.179 | 0.183
0.000 | 0.000
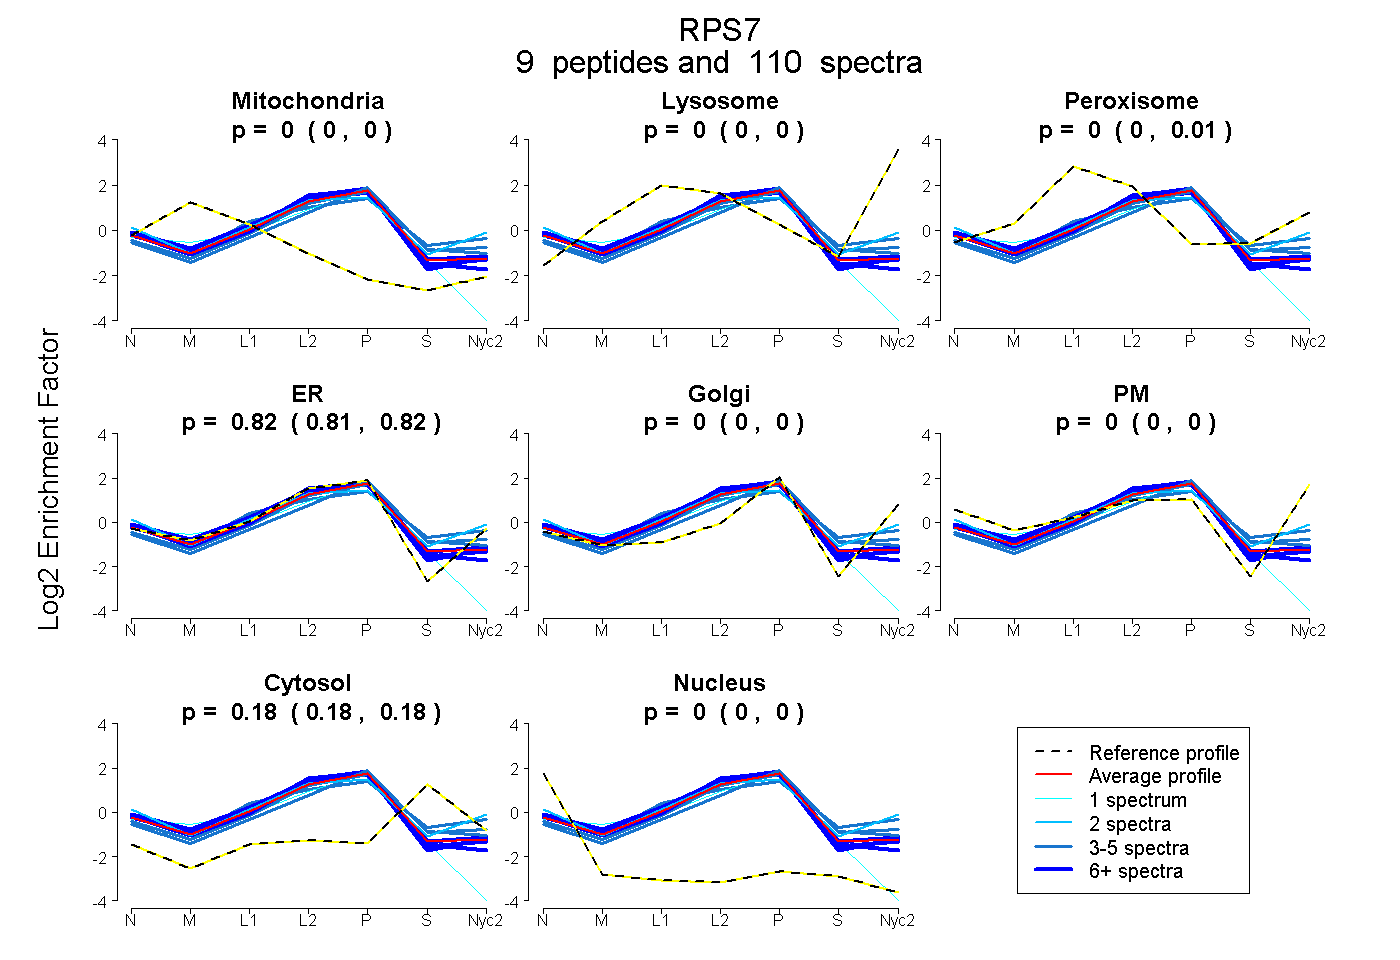
| Plot | Mito | Lyso | Perox | ER | Golgi | PM | Cytosol | Nucleus | |||||
| Expt A |
9 peptides |
110 spectra |
|
0.000 0.000 | 0.000 |
0.000 0.000 | 0.000 |
0.003 0.000 | 0.006 |
0.815 0.811 | 0.818 |
0.000 0.000 | 0.000 |
0.000 0.000 | 0.000 |
0.181 0.179 | 0.183 |
0.000 0.000 | 0.000 |
| 4 spectra, ELNITAAK | 0.000 | 0.000 | 0.002 | 0.745 | 0.000 | 0.000 | 0.253 | 0.000 | ||
| 1 spectrum, DVNFEFPEFQL | 0.133 | 0.000 | 0.000 | 0.684 | 0.000 | 0.000 | 0.051 | 0.133 | ||
| 2 spectra, VETFSGVYK | 0.000 | 0.000 | 0.115 | 0.628 | 0.000 | 0.091 | 0.166 | 0.000 | ||
| 43 spectra, HVVFIAQR | 0.000 | 0.000 | 0.000 | 0.846 | 0.000 | 0.000 | 0.136 | 0.018 | ||
| 27 spectra, ILPKPTR | 0.000 | 0.000 | 0.000 | 0.859 | 0.000 | 0.000 | 0.141 | 0.000 | ||
| 4 spectra, MFSSSAK | 0.000 | 0.000 | 0.000 | 0.725 | 0.000 | 0.000 | 0.275 | 0.000 | ||
| 13 spectra, AQQNNVEHK | 0.000 | 0.000 | 0.034 | 0.801 | 0.000 | 0.000 | 0.165 | 0.000 | ||
| 3 spectra, AIIIFVPVPQLK | 0.000 | 0.000 | 0.182 | 0.599 | 0.000 | 0.000 | 0.218 | 0.000 | ||
| 13 spectra, EIEVGGGR | 0.001 | 0.000 | 0.054 | 0.843 | 0.000 | 0.000 | 0.080 | 0.021 |
| Plot | Mito | Lyso or Perox | ER | Golgi | PM | Cytosol | Nucleus | ||||||
| Expt B |
8 peptides |
42 spectra |
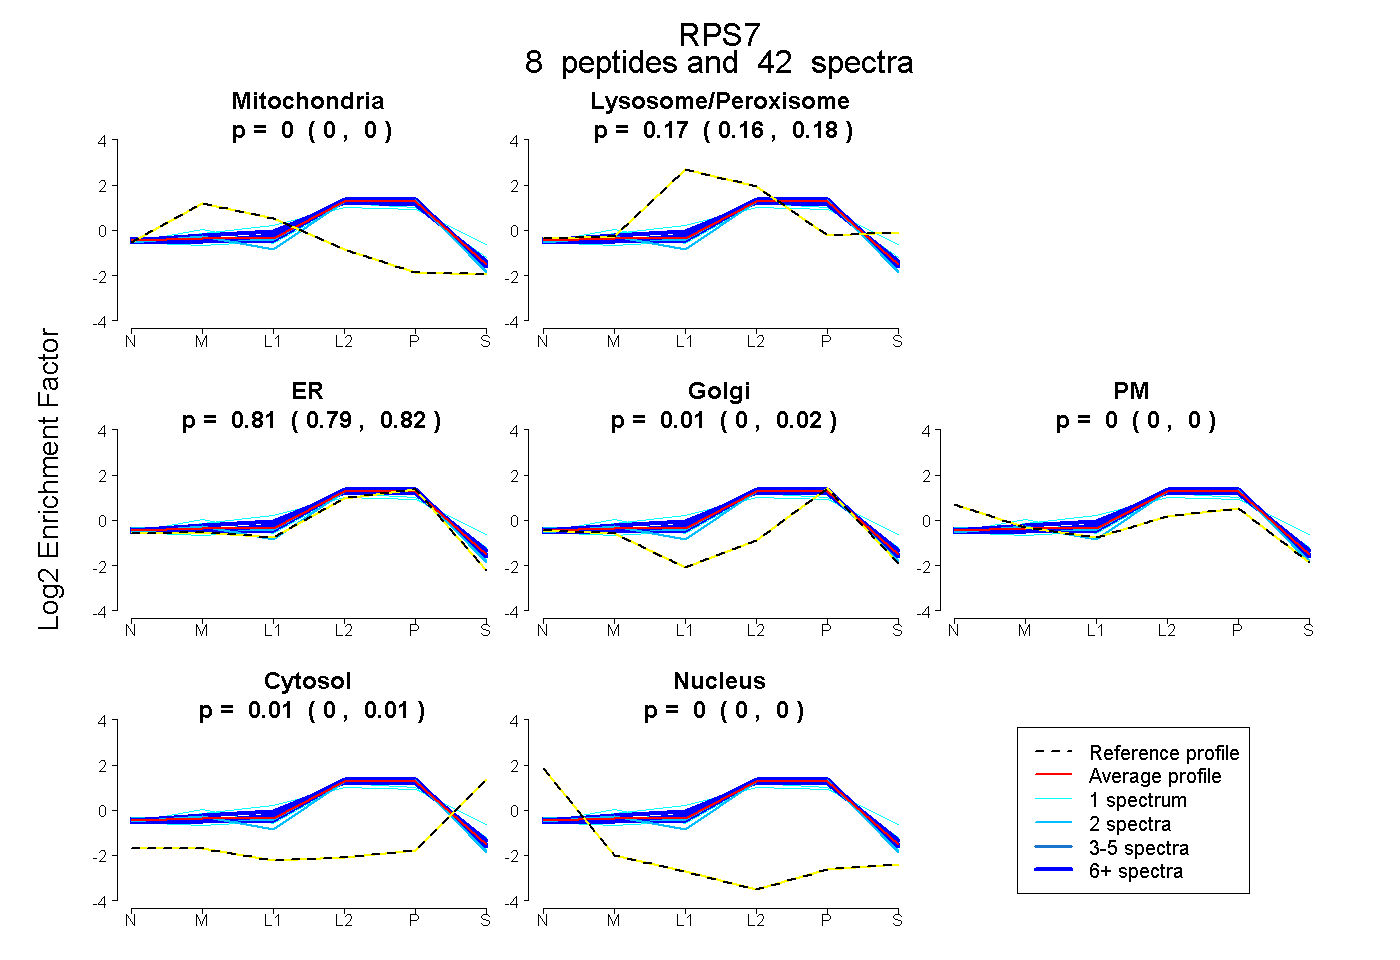 |
0.000 0.000 | 0.000 |
0.173 0.164 | 0.182 |
0.809 0.791 | 0.823 |
0.010 0.000 | 0.021 |
0.000 0.000 | 0.000 |
0.007 0.001 | 0.012 |
0.000 0.000 | 0.000 |
|||
| Plot | Lyso | Other | |||||||||||
| Expt C |
7 peptides |
151 spectra |
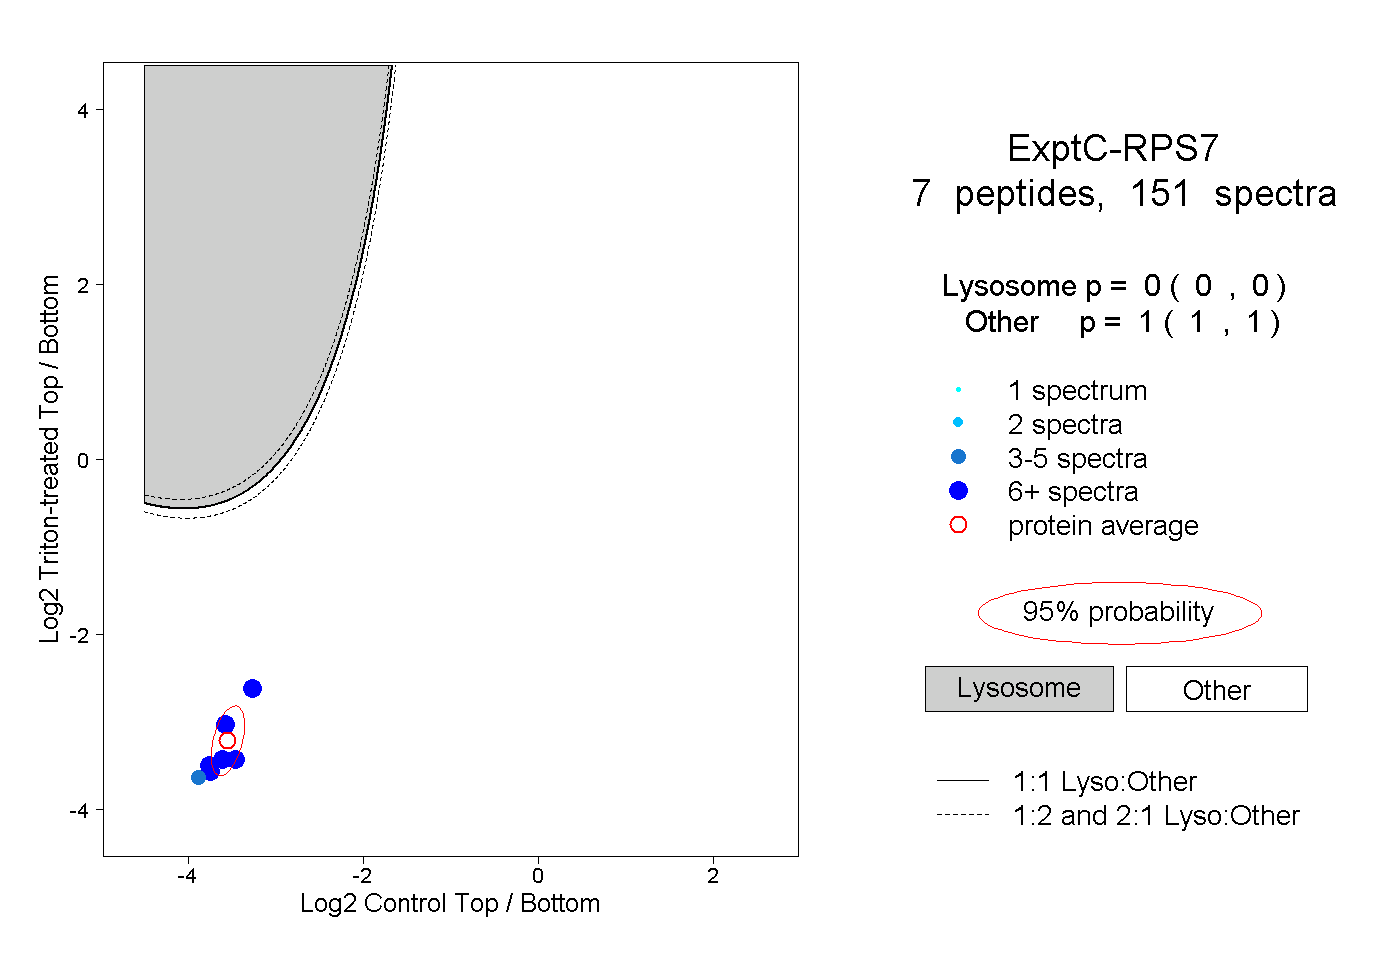 |
0.000 0.000 | 0.000 |
1.000 1.000 | 1.000 |
||||||||
| Plot | Lyso | Other | |||||||||||
| Expt D |
5 peptides |
17 spectra |
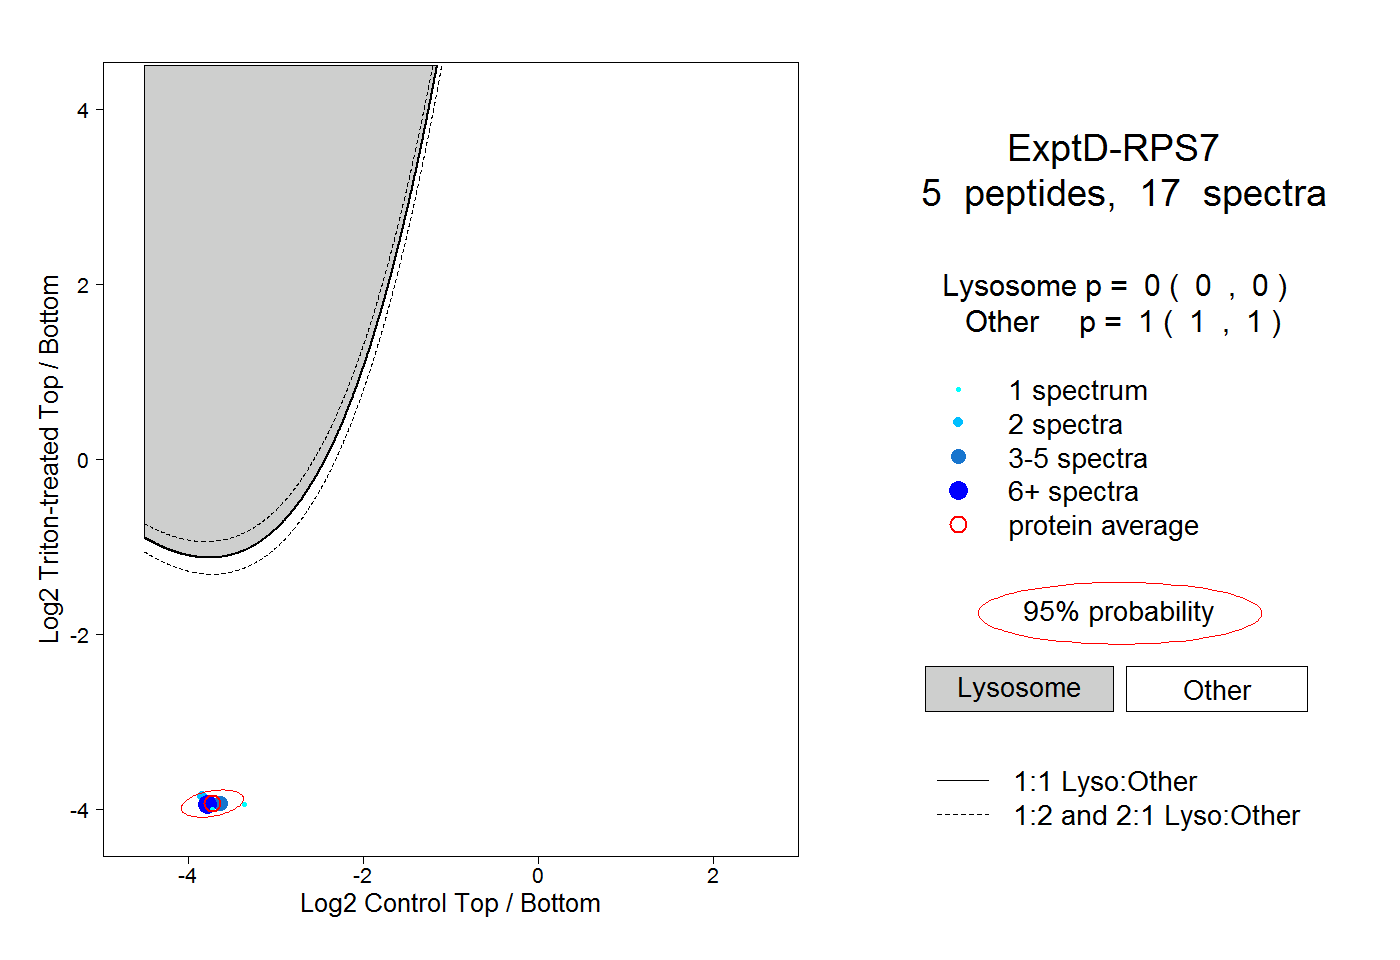 |
0.000 0.000 | 0.000 |
1.000 1.000 | 1.000 |